
Inside the Cisco Live SOC
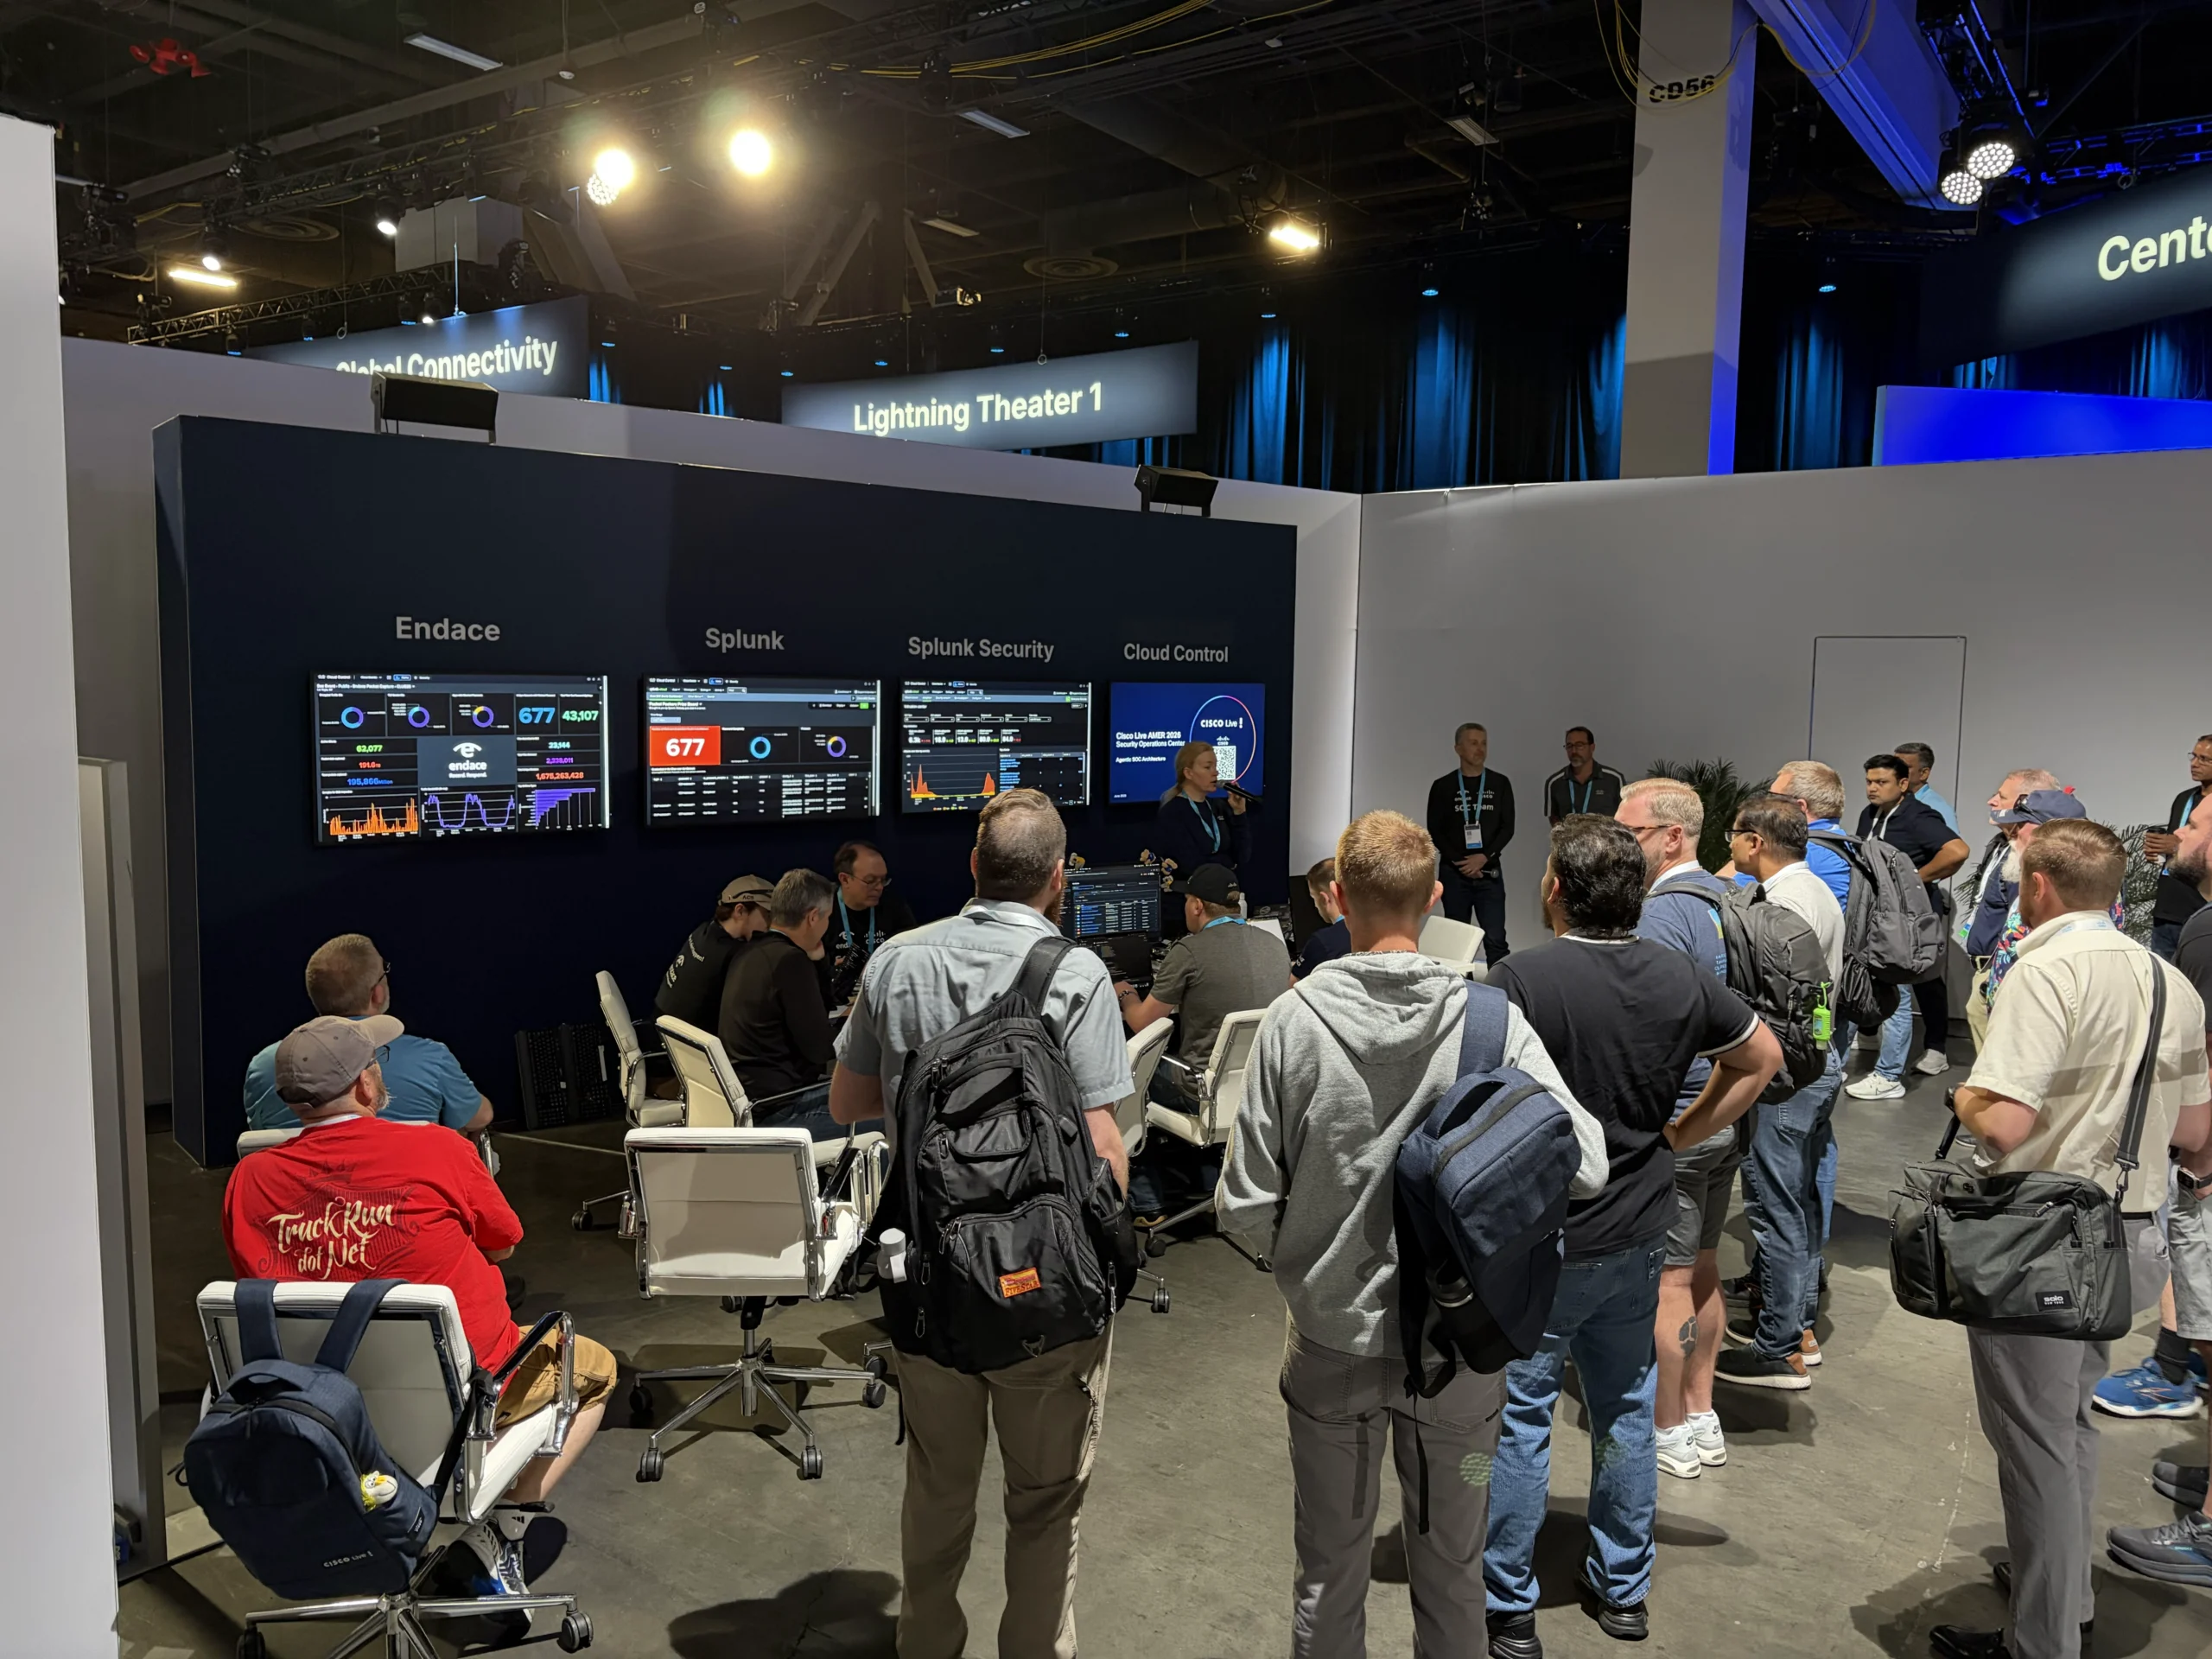
At Cisco Live AMER, the Security Operations Center (SOC) is more than a demo environment. It is a working security operations center protecting the event in real time, bringing together analysts, telemetry, detections, and response workflows across the conference network. For a broader look at how the Cisco Live SOC operates, read this overview.
This post focuses on my experience inside that environment as a product manager using AI, Splunk Enterprise Security, and XDR to investigate real detections and reflect on what better detection and response products should become.
From Customer Conversations to Live Investigations
I spend a lot of time with customer’s Security Operations teams and SOC environments. As a product manager working on XDR at Cisco Splunk, those conversations are one of the most valuable parts of the job. You hear where investigations slow down, where context gets lost, and where analysts still must stitch together too much by hand.
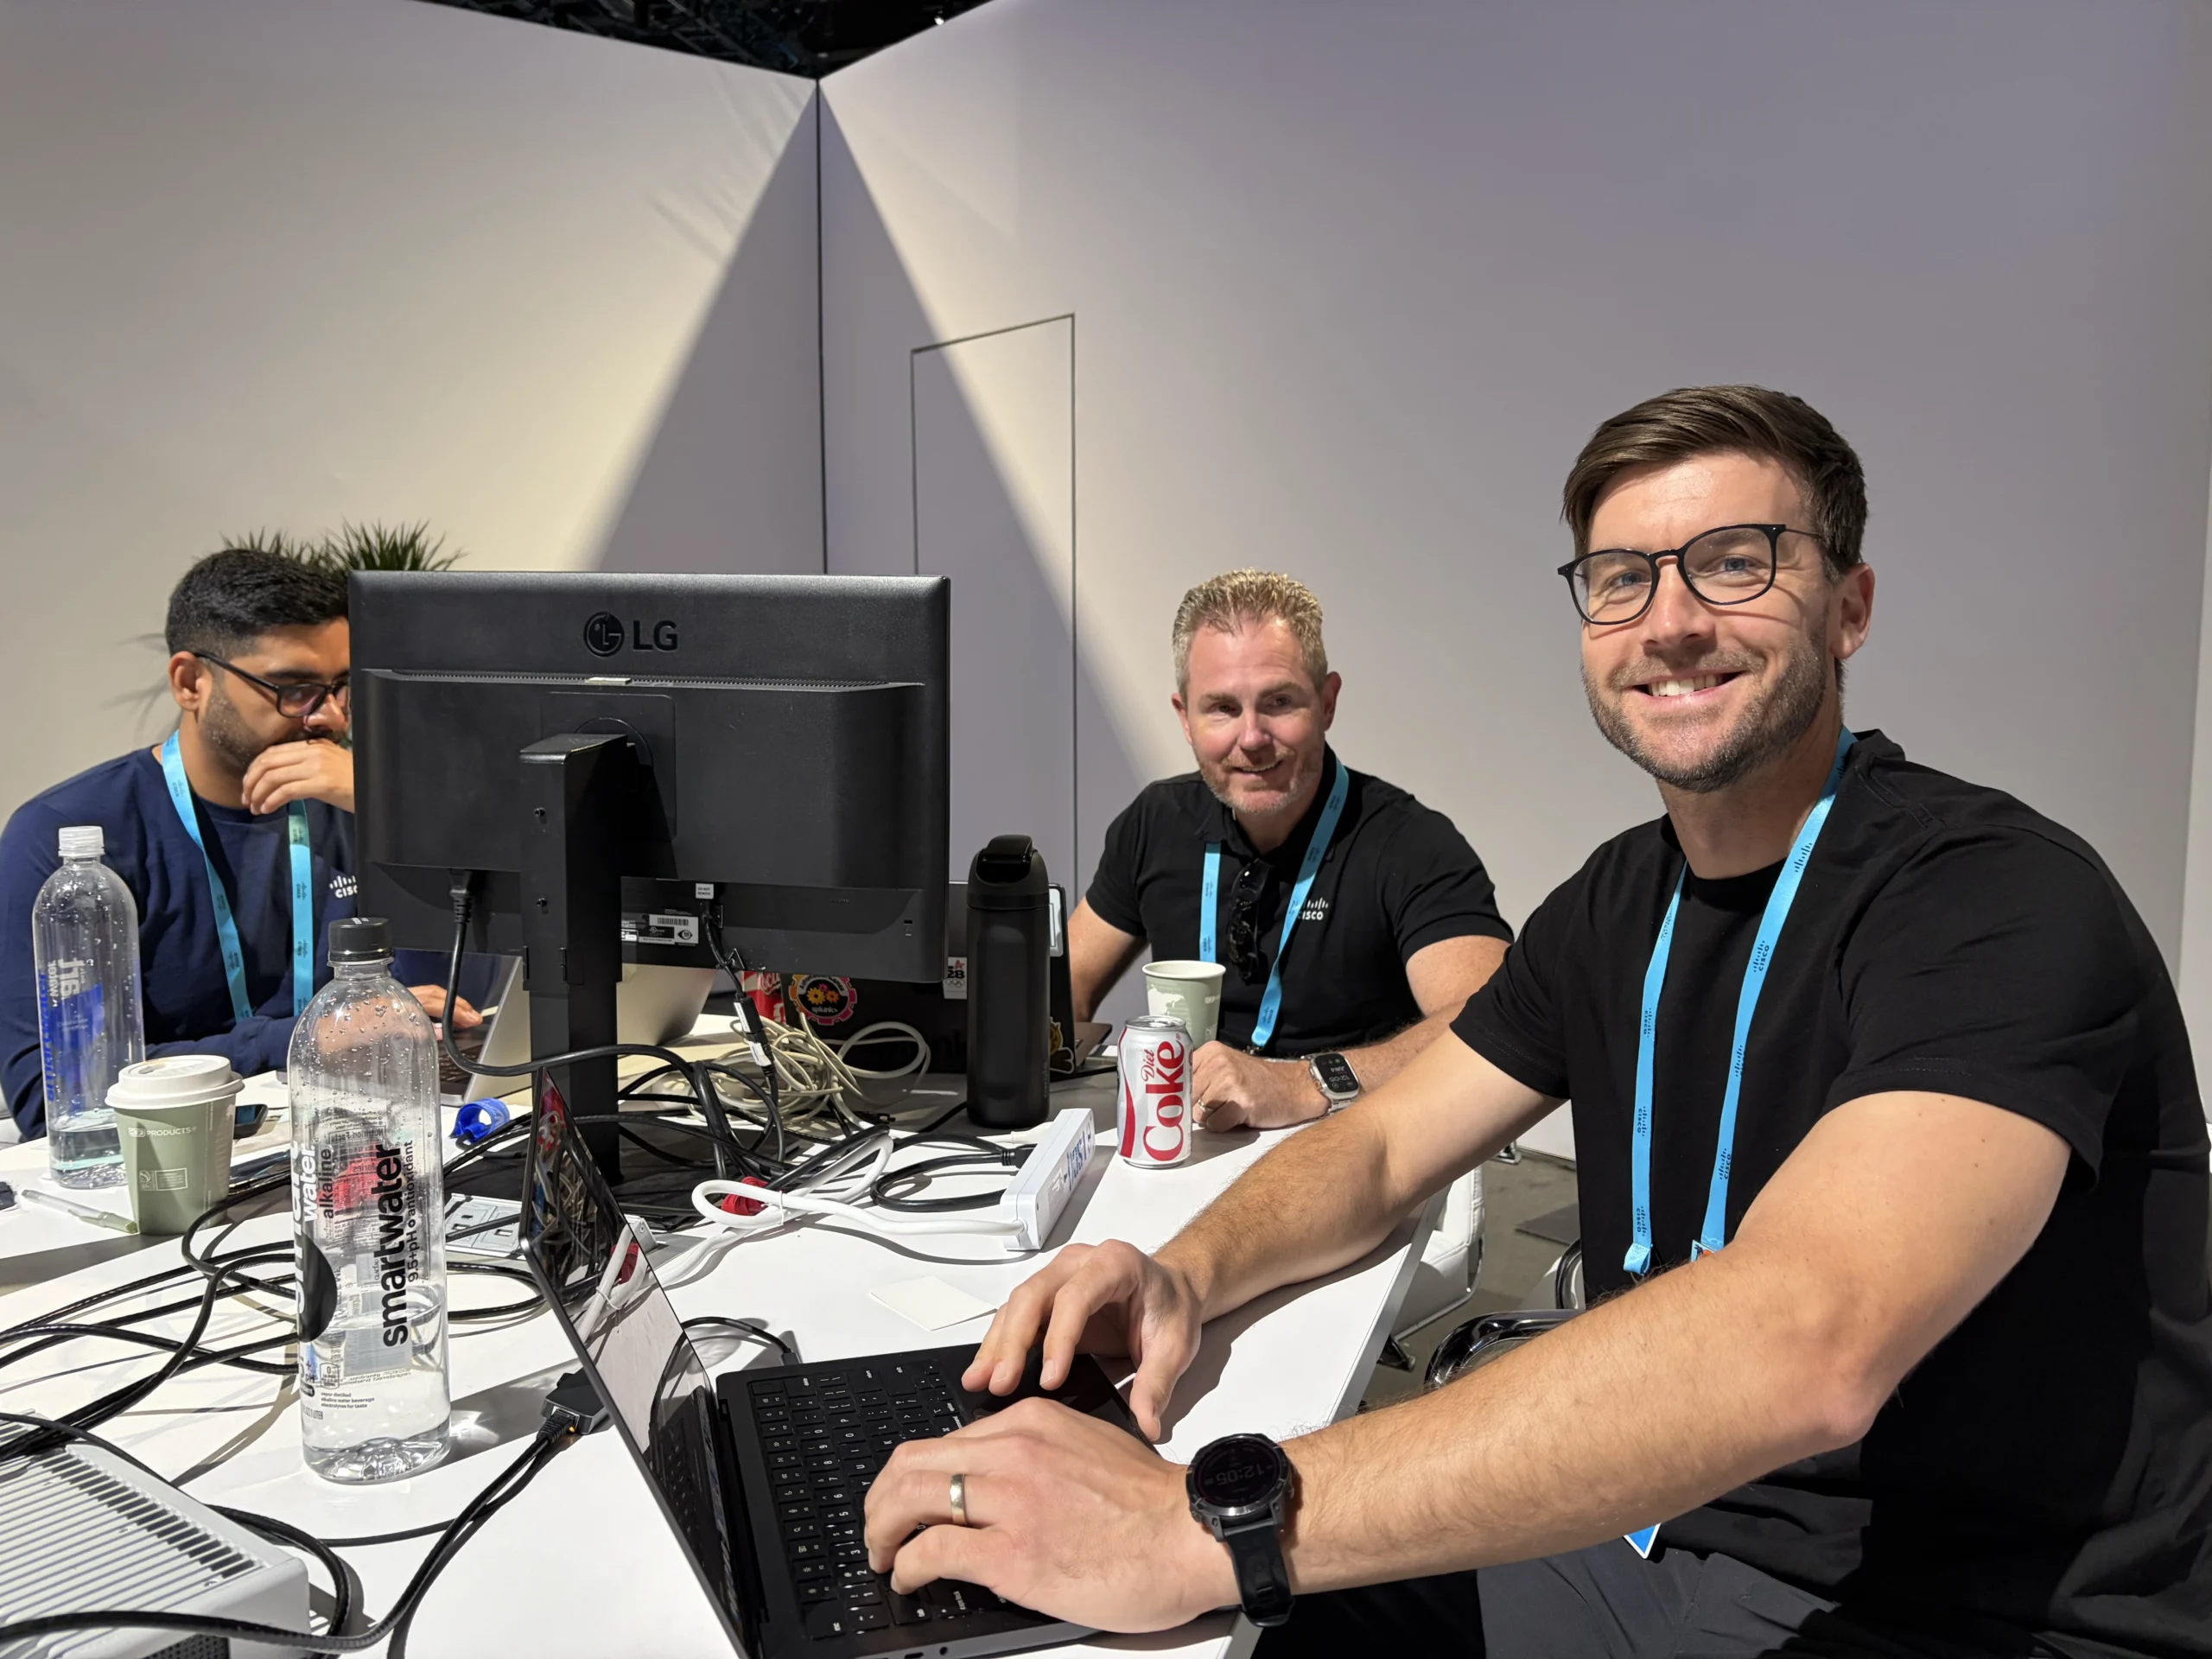
Cisco Live AMER gave me a more direct version of that experience.
Part of the week was spent meeting with customers, listening to how they investigate, and ideating on what better detection and response products should feel like. Another part was spent in the SOC, working real investigations with XDR, Splunk Enterprise Security, firewall events, DNS telemetry, packet data, and AI assistance.
That combination was clarifying. Customer conversations showed me the pain. SOC work showed me the texture of that pain in real time.
The Messy Middle of Detection and Response
The biggest lesson was that detection and response is not a single product problem. It is a workflow problem.
A detection might start in a firewall, get enriched in XDR, require historical context from Splunk Enterprise Security, need packet evidence from a capture platform, and still depend on someone understanding the local network topology. The analyst’s job is to turn all of that into a decision: true positive or false positive, blocked or successful, compromised or simply noisy.
That distinction matters.
A detection might say “overflow attempt” or “denial of service attempt,” but the real questions are more practical:
- Did the session complete?
- Was the traffic blocked?
- Is this asset vulnerable?
- Is this source expected to talk to that destination?
- Is the destination malicious, a resolver, a sinkhole, or a security control doing its job?
That is the everyday work of an analyst and something I got to spend a few days going deep into and now have a better empathy for.
Where AI Helped Me Move Faster
AI was a very useful tool for this first-time employee at the Cisco SOC. It helped me most by enabling me to get oriented faster – both with intelligence, context, and a starting hypothesis, this was very helpful for an analyst that had never seen this environment and was starting their first days on the job at a new “company.”
It did not replace the act of me investigating a potential threat. It helped reduce the time it took to understand what I was looking at, what mattered, and what to check next.
When an alert fired, I still had to understand the source, destination, protocol, action, timing, and business context. But AI helped compress the ramp-up time. It helped translate dense firewall language, normalize timestamps, reason through NAT64 addresses, summarize packet evidence, and separate “the rule matched” from “the asset is compromised.”
That last part is important. In security operations, the hard part is often not knowing whether a detection fired. The hard part is knowing what the detection means in context.
What Real Investigations Reinforced
In several investigations, the most important outcome was not a dramatic confirmed compromise. It was a clean, evidence-backed conclusion.
Sometimes that conclusion was: real detection, blocked connection, no proof of compromise.
Other times it was: signature matched, but likely false positive because the traffic was normal RADIUS or DNS behavior in context.
Those outcomes may sound less exciting, but they matter. Every minute an analyst spends chasing a noisy detection is a minute they are not spending on something more important. Good investigation workflows and capabilities should help analysts reach those conclusions quickly, clearly, and with evidence they can trust.
Where Splunk and XDR Shined Together
Over several days in the SOC, I saw the strengths of Splunk and XDR show up in different moments of the investigation.
Splunk Enterprise Security shined when I needed depth. It gave me the ability to search across raw events, validate timestamps, compare firewall records, inspect DNS and RADIUS activity, and look at what happened before and after a detection. When an alert title sounded severe, Splunk helped answer the practical question: what happened in the logs?
XDR shined as a starting point for me, it gave me a hypothesis to start from, key evidence and analysis towards that hypothesis. It helped connect related entities, detections, source and destination context, and investigation flow into one place. That made it easier to understand whether an event was isolated, correlated with other activity, or part of a larger pattern.
Using them together over multiple investigations made the handoff between products feel especially important. XDR helped me understand the shape of the investigation. Splunk helped me dig into the details and prove with even more evidence what XDR was able to conclude, helping me to quickly resolve large volumes of investigations with a high confidence level.
That mattered because many detections were new to me being this was my first week “on the job.” A firewall signature might say “overflow attempt” or “denial of service attempt,” but the real work was determining whether the traffic was blocked, whether the session completed, whether the asset was vulnerable, and whether the behavior was expected in that part of the network.
For me, Splunk and XDR shined together in three ways:
- XDR helped get me from 0-90 mph in minutes as I investigated incidents, it helped me make relationships obvious: which entities, detections, users, assets, and destinations mattered and what did they mean together, and what is the most likely hypothesis with all the evidence put together.
- Splunk helped me confirm the last 10 percent by making evidence searchable: what the raw logs said, when events happened, and what else surrounded them.
- Together, they helped make conclusions defensible: blocked, benign, suspicious, compromised, or needs escalation.
The experience also gave me immediate product ideas. The handoff between “connected investigation view” and “deep evidence search” should feel natural and even should be brought into a unified experience. An analyst should be able to start with an investigation and review all the data in one experience, pull back the relevant evidence, and even more quickly conclude on the investigation with high confidence.
Working in this SOC only reinforced this intuition: Not forcing analysts to choose between an investigation map and evidence depth, but bringing those strengths together in the workflow truly does allow for quicker decision making.
Building Toward Better Analyst Experiences
That is how I now think about building better detection and response products: not as isolated tools, but as connected investigation systems that reduce translation work for the analyst.
AI can help a product manager become useful faster in a live SOC. More importantly, it can help analysts get to the right question faster without removing their judgment from the process.
Cisco Live gave me a sharper view of what good looks like: products that make complexity understandable, preserve evidence, respect analyst judgment, and turn customer pain into better workflows.
That is the bar I want us to continue building toward as we build Cisco XDR and Splunk Security.
Check out the blogs by the engineers who worked inside the SOC at Las Vegas:
- Building the Agentic SOC at Cisco Live Americas 2026
- Building an Agentic Tier-2 SOC Analyst at Cisco Live AMER 2026
- The Experience Dividend: How Better Digital Experience Protects Revenue, Trust, and Growth
- Cable to Cloud – A Product Engineer’s Journey Through the Cisco Live AMER 2026 SOC
- Educate at Event Speed: Inside the Cisco Live SOC
- Elevating Expertise in the SOC
- Machine Speed, Human Judgement: How AI Changed the SOC in 2026
- SharpHound Recon Attack – How AI enhanced the threat hunt
- Endace: Using LLMs and Endace Full Packet Capture for Incident Response
- Endace: Never Underestimate Cisco Live!
- Endace: Supporting Encryption vs. Using Encryption: When the best laid plans go astray