
From data overload to enhanced digital resilience. Cisco IT unified telemetry data across its vast network, enabling automation to handle 99.998% of alerts and achieving zero major incidents – empowering engineers to proactively manage network health at scale. Watch the video and keep reading to learn more.
The data problem: overload, limited insight, and silos
Cisco IT manages a vast, complex environment with hundreds of thousands of assets – including computers, switches, access points, home devices, and a wide range of applications and services – as well as external systems like internet service and cloud providers. Each of these assets generates telemetry, presenting a challenge to effectively monitor and make sense of high volumes of diverse data across our environment.
In our previous network operations model, we outsourced a function responsible for network observability monitoring, second-level support for triage, and technical expertise. This outsourced function relied on traditional monitoring methods involving manual processes and siloed dashboards.
As a result, we lacked control to tailor how telemetry was processed, routed, and actioned – leading to generic metrics and limited insight into critical areas like user experience and application performance. For example, while we could see that the network was operational, we had limited visibility into critical areas like user experience and application performance.
Recognizing this data problem, we decided to bring the outsourced network operations function in-house. This gave us full control to design and implement a modernized network observability strategy, enabling us to better leverage our wealth of telemetry and ultimately strengthen Cisco’s digital resilience.
However, this shift wasn’t just about changing team responsibilities. It also meant losing our existing network observability system and requiring our smaller team to manage the massive volume of telemetry data.
To add to the pressure, due to contractual obligations, we were given just 40 days to make this transition and build a completely new network observability system.
Inside the blueprint: Building a modern observability system
The task at hand wasn’t just to replace and mirror the outsourced network operations and legacy observability system, but to build something better. We wanted to build a system that could handle massive volumes of data, deliver deeper, actionable, and proactive insights, and enable a leaner team to be more productive.
To achieve this, we designed a network observability model focused on three key areas:
- Collect: Gathers telemetry and metrics from thousands of devices, applications, and platforms – both within owned and unowned, external environments
- Monitor: Uses tools and algorithms to process and analyze the collected data, helping to identify patterns, anomalies, and potential issues within the network
- Act: Initiates human or automated responses when identified problems meet predefined rule criteria, enabling timely remediation.
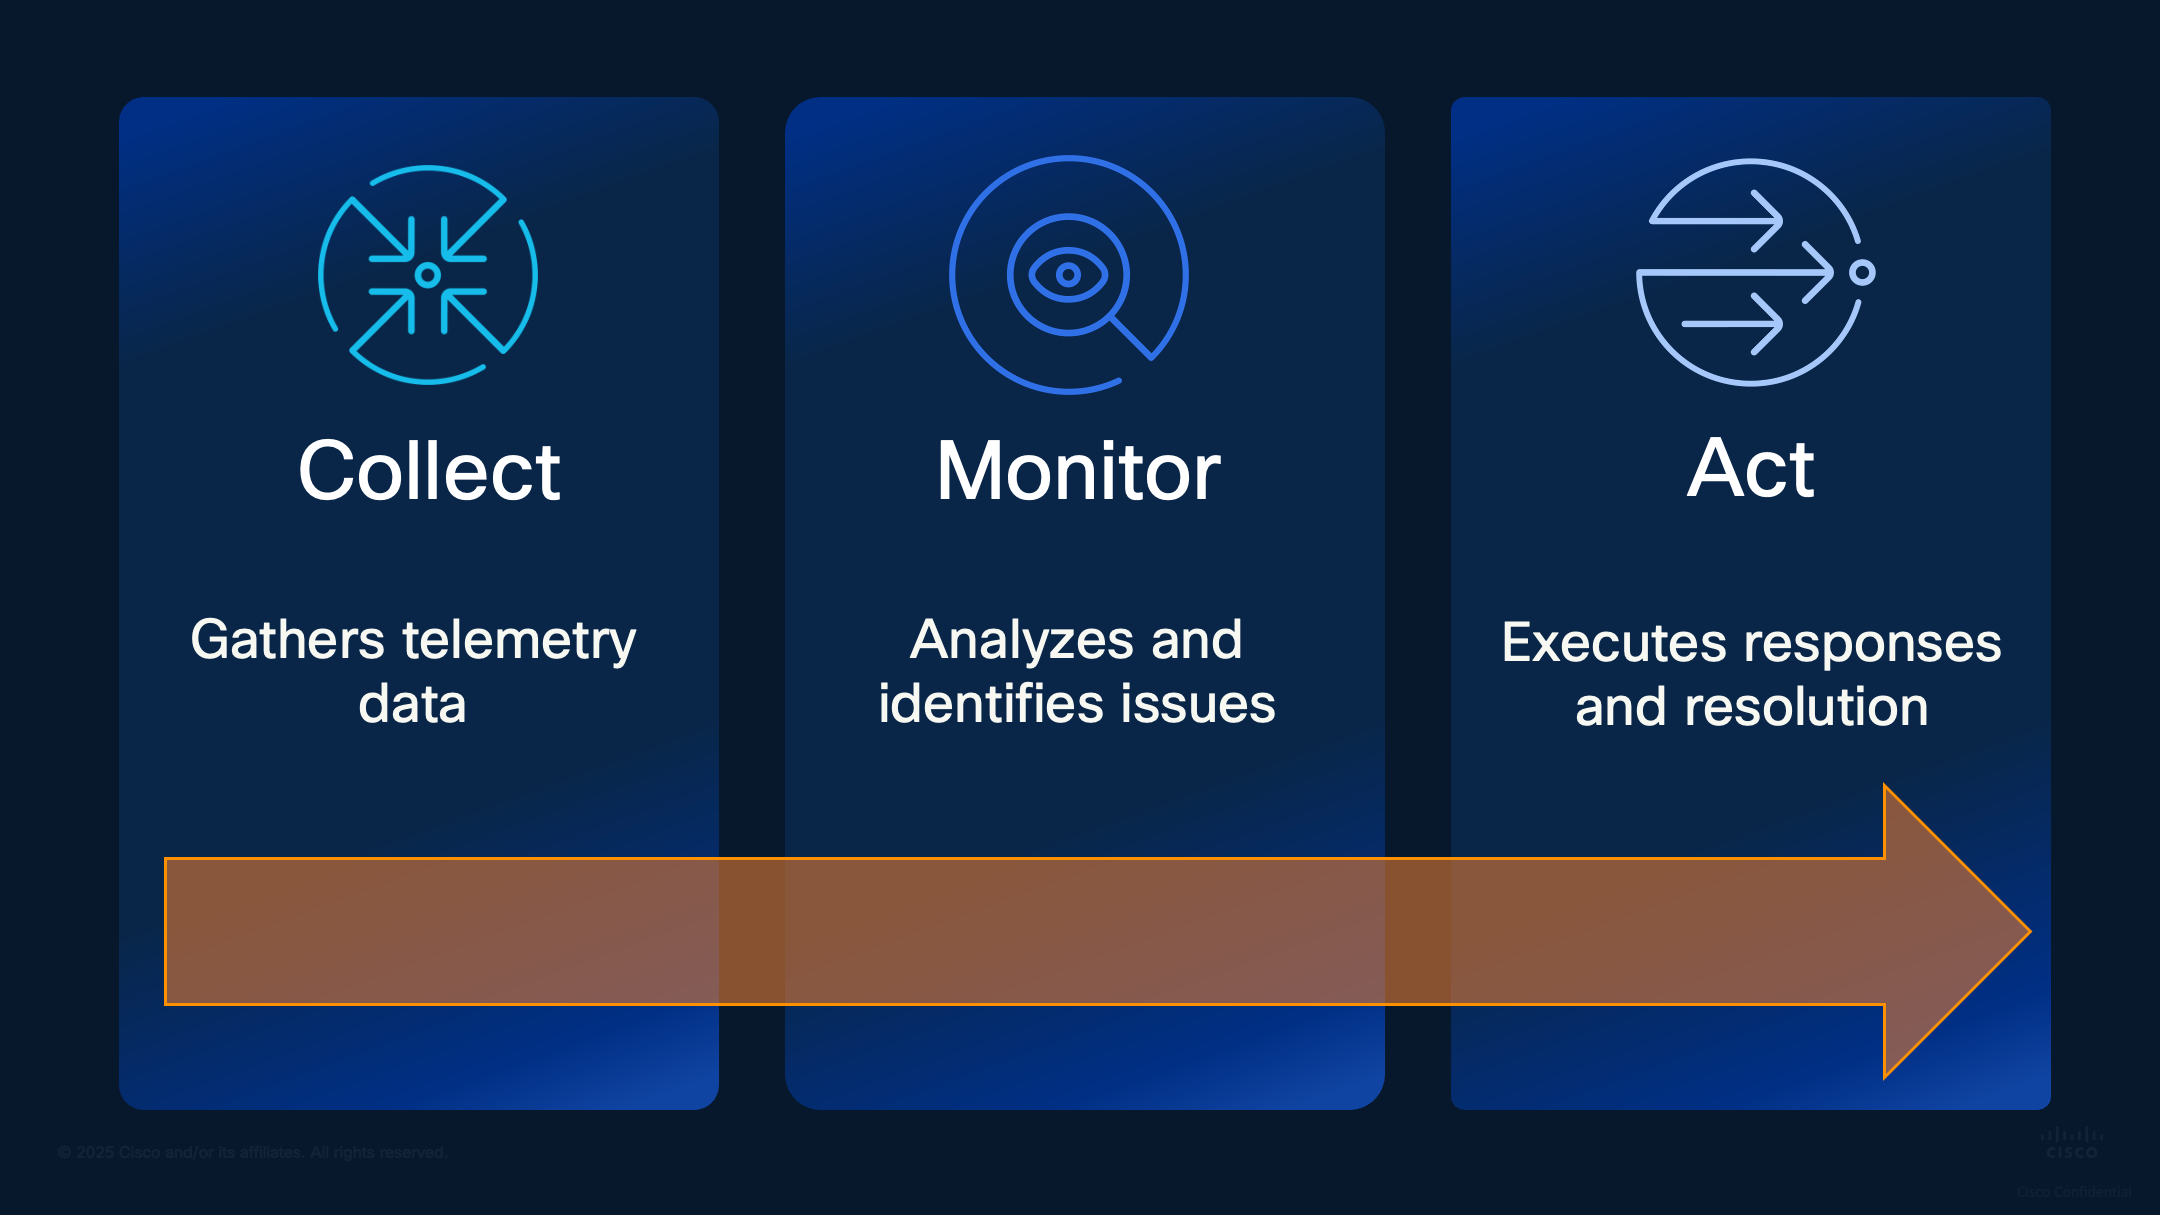
Figure 1: Cisco IT’s network observability model
While this system is run by a centralized networking team, data and rule creation are democratized – allowing engineers and service owners across IT to define and customize their own alert rules via GitOps. This ensures the system adapts to unique and evolving business needs.
To operate this network management strategy, we use a combination of Cisco solutions:
- Cisco’s network management solutions, including Catalyst Center, SD-WAN Manager, Meraki Dashboard, and Nexus Dashboard, collect and monitor detailed telemetry, performance metrics, and security status data on their respective assets. This provides comprehensive visibility and assurance, in addition to their other core capabilities for managing network devices.
- ThousandEyes provides real-time, end-to-end visibility into network and application performance. It also extends this visibility into external, unowned environments such as public internet and cloud services. These granular insights feed into the observability system, giving us a complete view of user experience and connectivity – no matter where employees are working.
- Splunk Cloud Platform acts as a unified operations dashboard – aggregating and visualizing telemetry data from the above solutions that were previously siloed. It enables real-time monitoring, enabling engineers to quickly focus on the most critical alerts.
Together, Splunk and ThousandEyes allow us in Cisco IT to proactively monitor, analyze, and act on millions of events daily.
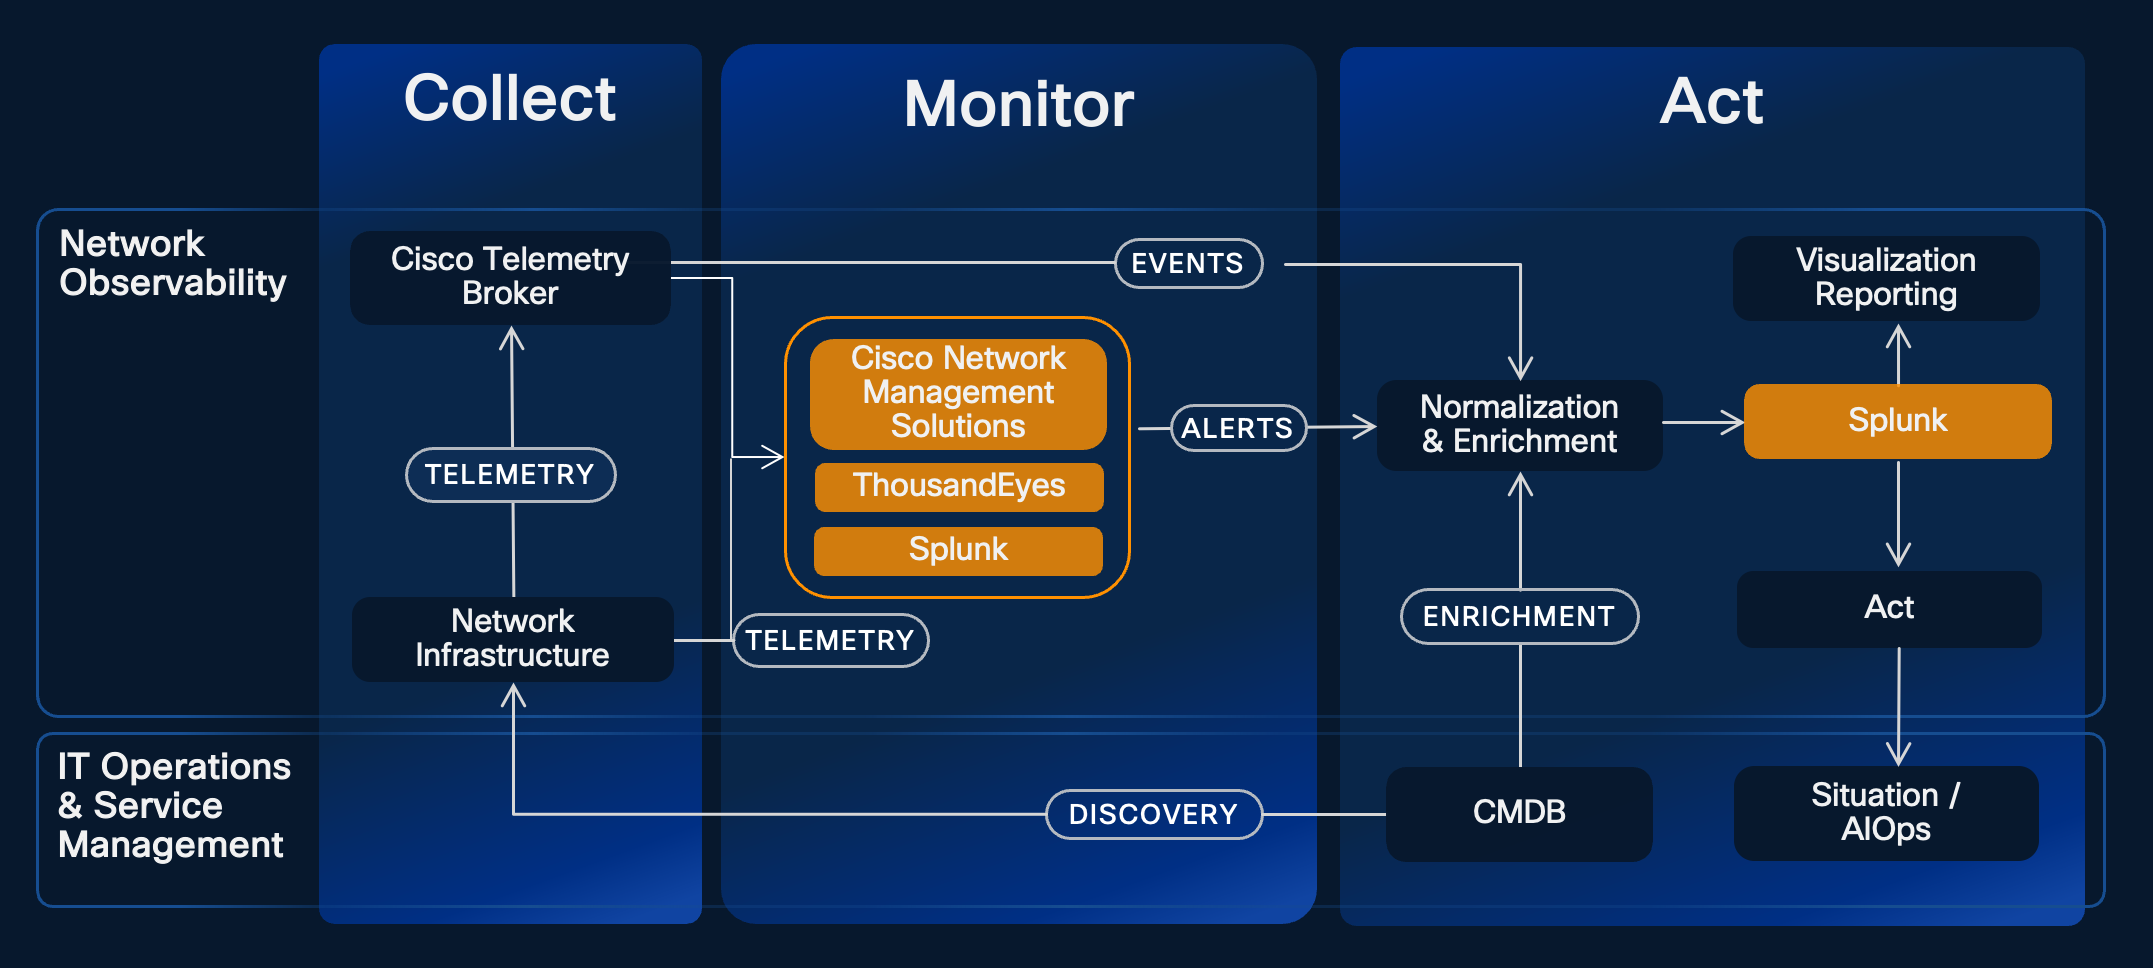
Figure 2: Cisco IT’s observability system tools and integrations
Automation is a critical component of our network observability strategy. By feeding telemetry data and incident outcomes into our Large Language Models (LLMs) and automation systems, we can efficiently process and prioritize millions of daily alerts to reduce engineer workload and speed up response times, improving end-user experience.
The payoff: Enhanced resilience, efficiency, and beyond
From the beginning, we recognized that this initiative would involve significant upfront work. However, the results have far exceeded our initial expectations.
Since deploying this new observability strategy and system:
- 0 major incidents have occurred, down from 3-4 per quarter previously.
- 10x more telemetry data is being monitored, enabling broader and deeper insights into network health, application performance and user experience at a next level of detail.
- 4x greater visibility, with daily alert volume increasing from hundreds of thousands to 4 million, resulting in earlier detection and proactive resolution of potential issues before they escalate.
- Automation now handles 99.998% of 4 million daily alerts generated, minimizing the need for manual intervention, and enabling faster identification and resolution of issues through real-time, automated triage and response workflows.
Perhaps most importantly, this effort laid a foundation that enables us to continuously scale our AI-driven automation and extend AIOps capabilities across the broader Cisco IT environment.
Lessons learned: Strategies that made the difference
Modernizing our observability strategy and system was a fast-paced journey, full of valuable lessons. Here are some key takeaways and strategies to help other teams looking to do the same:
- Collaborative ownership: Bring in subject matter experts from across the organization, share knowledge widely, and build a democratized culture where everyone has a stake in observability and operational success.
- Collect telemetry from everywhere: Comprehensive monitoring starts with capturing data across your entire environment.
- Data normalization and enrichment: Unifying diverse data sources is crucial for holistic visibility. Invest in a high-quality, well-maintained CMDB to keep your inventory and data accurate. Use your CMDB to enrich alerts with business context, ownership, and criticality.
- Rule experimentation: Encourage democratized teams to develop and refine alerting and automation rules to keep alert volumes manageable and relevant.
- AI-driven automation: Feed enriched data into automation and LLMs to streamline remediation and take steps toward self-healing operations.
We’re thrilled and proud of the work and outcomes that our teams have achieved, but our journey doesn’t end here. We will continue to iterate, improve, and advance our AI-driven automation capabilities.
- Get an inside look at Cisco IT’s entire observability approach, read the blog
- For a closer look at how Cisco IT uses AI-driven automation within Catalyst Center, check out this blog and success story
- Access more Cisco on Cisco success stories


