
A keynote is about to start. Thousands of people are opening apps, joining sessions, checking schedules, scanning badges, and expecting the digital layer around the event to simply work.
If it does, almost no one notices. If it does not, everyone does.
That is the part of digital experience leaders cannot afford to miss. A slow login, a failed stream, a stalled session, or a regional connectivity issue is not just a technical event. It is a revenue moment under pressure.
When an application responds fast, a session holds, or an attendee moves through an event without friction, no one notices the experience. That invisibility is worth money. It protects trust and lets the revenue moments happen.
When experience breaks, customers abandon journeys, support tickets climb, and sponsors stop extending the benefit of the doubt. The cost never lands on a network dashboard. It shows up in the P&L.
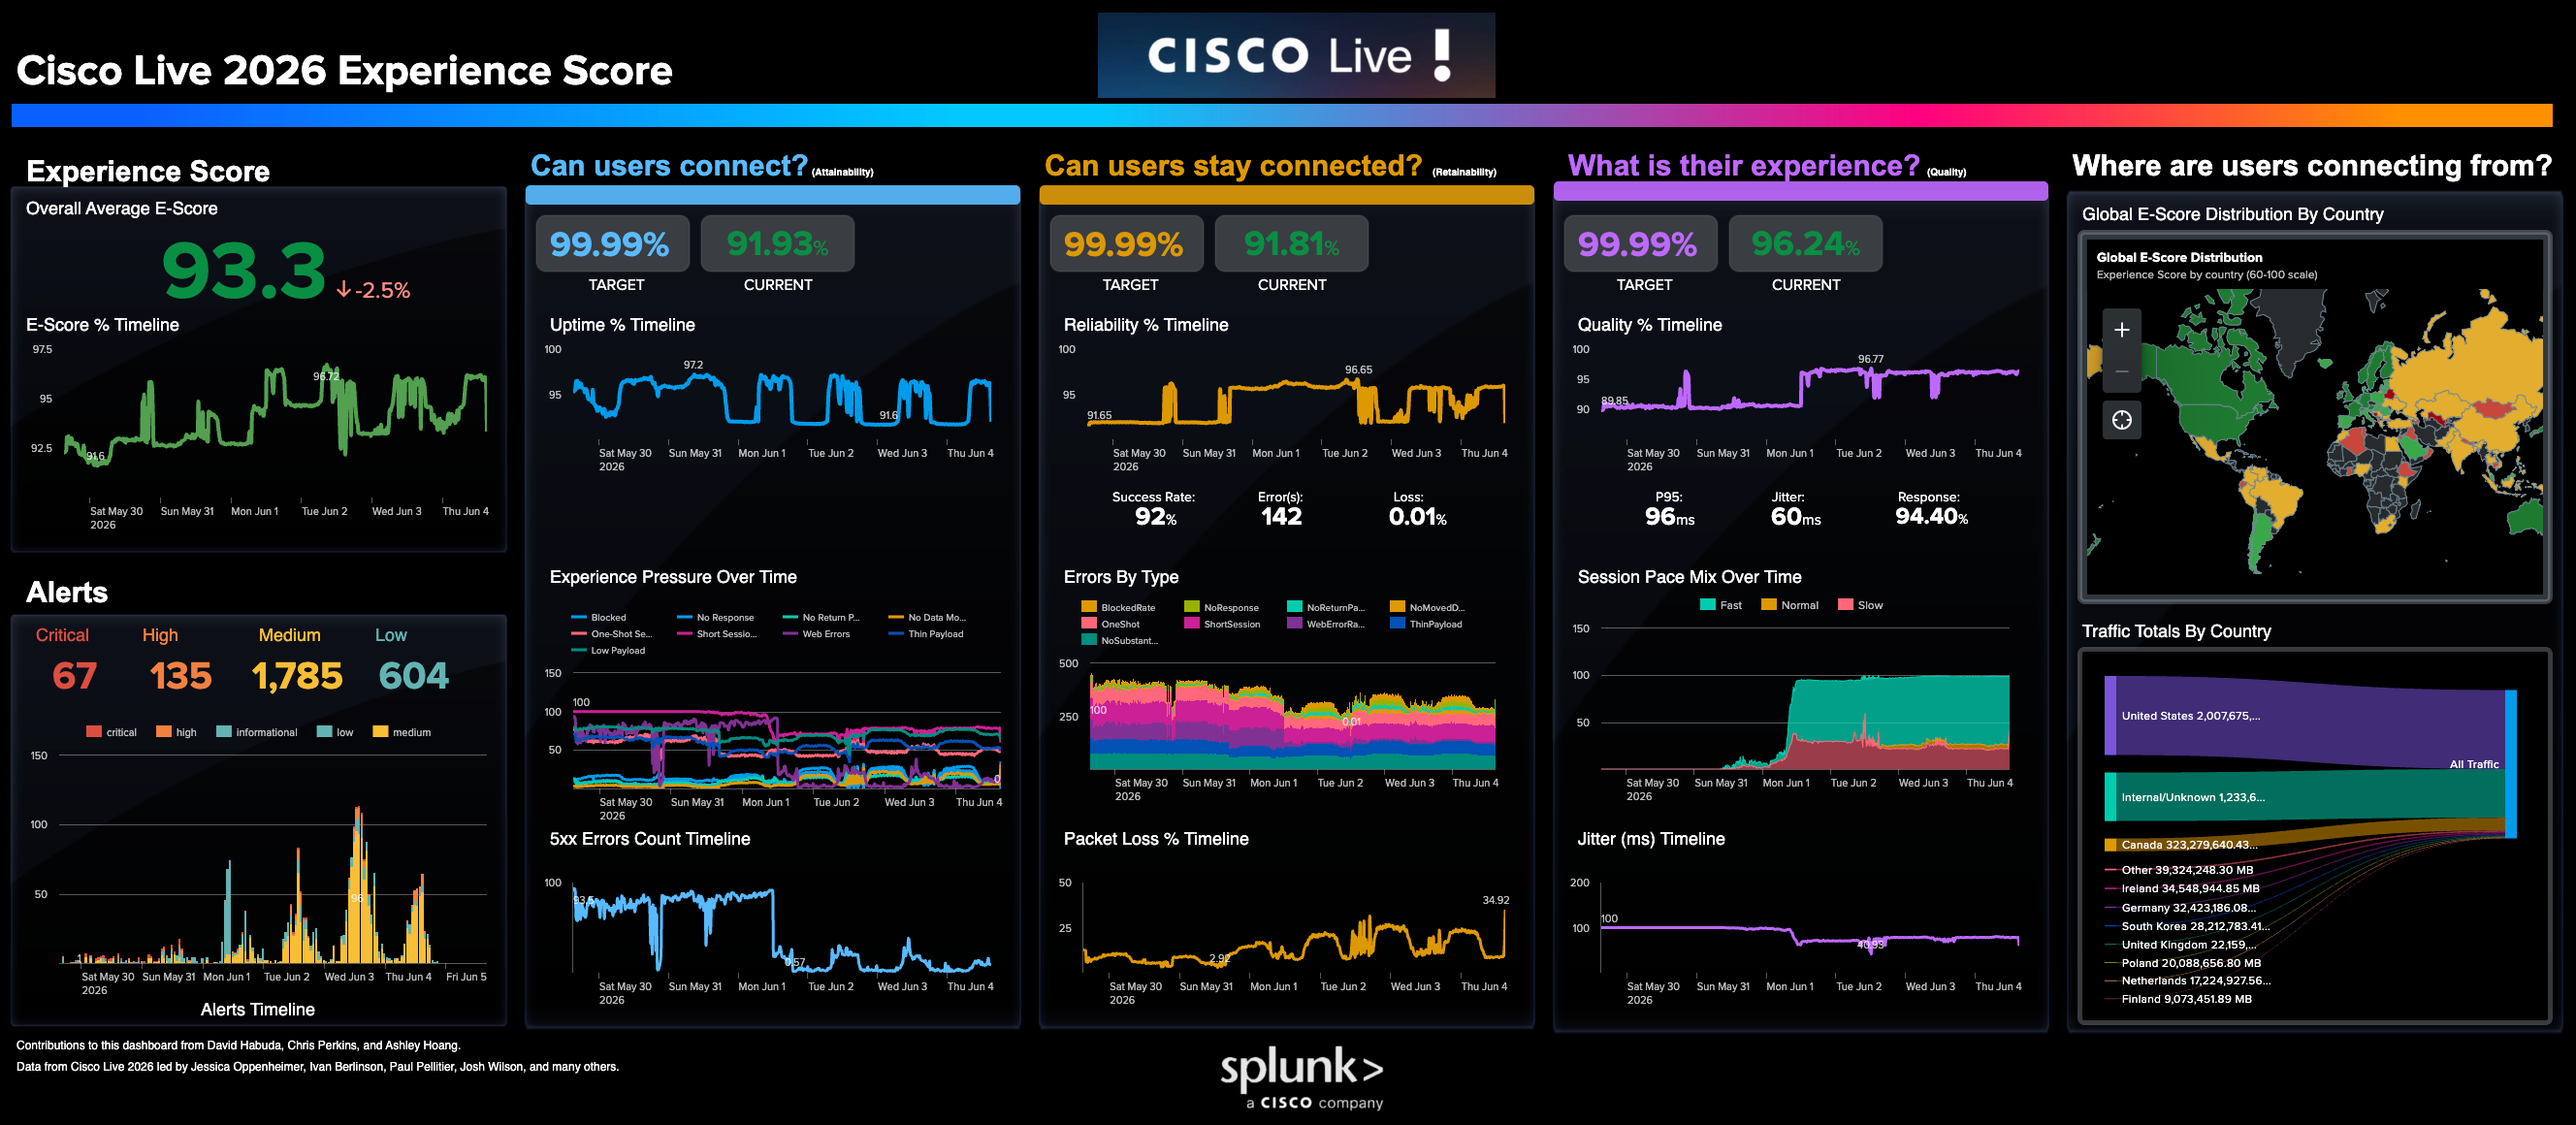
At Cisco Live 2026 (May 30 to June 4: six days, tens of thousands of attendees, hundreds of sessions, a global audience in every time zone), we used the event as a live proving ground for one executive idea: better experience and better business performance are the same conversation. We built an Experience Score model on Cisco and Splunk infrastructure and watched it run against real traffic, at real scale, in real time.
The result was a working model for how leaders measure what customers feel, act before friction surfaces, and tie operational decisions to revenue and trust.
Experience Is Measurable
Executive observation: You cannot prioritize what you cannot see.
Most organizations have more telemetry than they can use. They lack a measurement architecture that connects technical signals to human outcomes.
At Cisco Live, the Experience Score model organized that architecture around four questions business and technology leaders can answer together. The figures below are live readings from the event – the point is not the absolute numbers but that a single model surfaced them, in context, while there was still time to act:
| Dimension | Business question | Cisco Live reading |
|---|---|---|
| Experience | What is the composite signal a leader can act on? | 93.3 E-Score |
| Attainability | Can a customer reach the experience they came for? | 91.94% against a 99.99% aspiration |
| Retainability | Does the experience hold long enough to deliver the outcome? | 91.81%; 92% success rate; 0.01% packet loss |
| Quality | Does it feel responsive enough to keep the user engaged? | 96.26%; P95 latency 96ms; jitter 60ms; 94.40% response rate |
These are business questions in measurable form. Attainability is access. Retainability is continuity. Quality is perceived value. The composite Experience Score tells a leader whether the experience is healthy enough to protect the moments the business depends on. ThousandEyes supplied internet and path intelligence; Splunk turned those signals into a shared operating view.
The geographic view added a second layer: experience distributes unevenly. A global audience can show a strong aggregate while specific regions degrade. Seeing that distribution is the difference between a targeted fix and a brand-wide problem.
Experience Is Operational
Executive observation: A composite score turns interpretation into coordination.
Measurement matters only when it changes how people act.
At a large event, network teams, application teams, security teams, executives, and customer-facing teams can all read valid data and reach different conclusions. A composite model cuts that cost of interpretation. It gives leaders a shared frame for what matters, who owns the next move, and how fast.
During Cisco Live, the alert profile was signal density, not noise:
| Severity | Count |
|---|---|
| Critical | 67 |
| High | 135 |
| Medium | 1,785 |
| Low | 604 |
Nobody is trying to drive every alert to zero. The job is to separate signal from noise fast enough that customers never feel it. Medium and low alerts flag drift before it reaches a customer. Critical and high alerts focus leadership before coordination breaks down.
That coordination must be practiced. Cisco Live ran an analog tabletop exercise around the Experience Score with Joe Casella. Printed dashboards and scenario cards forced participants to decide what they would check first, who they would call, and what they would tell the people depending on the outcome. One lesson held: many incidents that look like network problems are coordination problems wearing network symptoms.
Experience operations is more than tooling. Mean time to coordinated action often decides whether customers feel a blip, a degraded journey, or an outage.
Experience Is Financial
Executive observation: The distance between the experience you aim for and the experience you deliver is a number with a dollar sign in front of it.
Experience is a financial signal, not only a service metric.
We held the model to a 99.99% aspiration across the key dimensions. Observed experience varied by dimension, time, and geography – and that variance is exactly what a leader needs to see, because each kind of gap maps to a different business risk.
An attainability gap maps to abandonment, missed conversion, and sponsor dissatisfaction. If customers cannot reach the experience, the business moment never happens.
A retainability gap maps to engagement loss, higher support volume, and weaker loyalty. If the experience does not hold, the customer does not finish the journey.
A quality gap maps to perceived brand weakness. A slow or inconsistent experience makes a working system feel unreliable, and that perception shapes whether a customer renews or buys.
A geographic gap maps to market-level risk. If experience is weaker in one region, the revenue and reputation impact concentrates there. That is a growth question.
The highest-value signal may be lead time. During peak moments, the Experience Pressure Over Time view surfaced blocked connections, no-responses, and 5xx patterns before some downstream failures became obvious. Lead time is one of the most under-valued assets in digital business. An experience platform earns its keep in the minutes it buys you before customers feel the failure.
So experience work is not a cost center. It is the shortest path between operations and revenue.
Experience Is Human
Executive observation: The number is not the customer. The customer is the customer.
An Experience Score is a translation layer, not a substitute for judgment. It lets a stage manager, a CIO, a solutions engineer, and an operations lead describe the same moment without reducing the customer to a metric.
That translation is the point. Customers do not experience uptime, packet loss, and response codes as separate categories. They experience whether they can do what they came to do. An experience model makes that reality visible early enough for teams to act.
Cisco Live validated the cultural side as much as the technical side. Shared framing across disciplines turns digital experience from a metric into an operating habit. The dashboard and mission-control work came from a cross-functional team spanning operations, data engineering, and event delivery, and it gave the room a way to see the same moment together.
Technology changes behavior here by giving people a common language for care, accountability, and action.
From Cisco Live to LA28
Cisco Live was a rehearsal for larger exposure surfaces, where digital experience, revenue, brand trust, and public attention converge.
As the official networking sponsor of the LA28 Olympic and Paralympic Games, Cisco is preparing for exactly that scale: more venues, more concurrent experiences, more global audiences, and less tolerance for blind spots. The disciplines carry over. Measure what people feel. Coordinate from a shared frame. Treat experience gaps as business risk. Keep the human outcome at the center.
At scale, the value is not one dashboard or one event. It is a repeatable discipline for protecting experience wherever the business cannot afford friction – and that discipline is what we are carrying from a conference hall in 2026 to a global stage in 2028.
Executive Takeaways
- Experience is a revenue system. Treat the distance between what you aim for and what you deliver as a financial number.
- A composite score beats a wall of dashboards once leaders agree on what goes into it.
- Operational coordination is the highest-leverage outcome of an experience platform.
- Lead time before failure is a strategic asset. Platforms that surface it earliest give leaders more options.
- Geographic distribution of experience is a board-level signal, not a support ticket.
- Organizations that hold digital experience steady protect trust, keep loyalty, and grow.
Check out the blogs by the engineers who worked inside the SOC at Las Vegas:
- Building the Agentic SOC at Cisco Live Americas 2026
- Building an Agentic Tier-2 SOC Analyst at Cisco Live AMER 2026
- Cable to Cloud – A Product Engineer’s Journey Through the Cisco Live AMER 2026 SOC
- What Working the Cisco Live SOC Taught Me About AI, Detection, and Response
- Educate at Event Speed: Inside the Cisco Live SOC
- Elevating Expertise in the SOC
- Machine Speed, Human Judgement: How AI Changed the SOC in 2026
- SharpHound Recon Attack – How AI enhanced the threat hunt
- Endace: Using LLMs and Endace Full Packet Capture for Incident Response
- Endace: Never Underestimate Cisco Live!
- Endace: Supporting Encryption vs. Using Encryption: When the best laid plans go astray