Before you read this, stop and glance around. If you are at home, at work, or in a public place, I bet you see people on their phone, texting, tweeting, or talking. More and more, the smart phone is changing everything about our daily lives. We are streaming music, watching TV, and downloading apps to get the fastest workout or the fastest route home. This massive growth in mobile use is rippling across every industry. Businesses are increasing wireless speeds to meet employee demand, and thinking more about security with the BYOD trend. They are also finding new ways to meet customer needs, especially in retail, thanks to the availability of real-time data from Wi-Fi routers and mobile devices. So where is the future of mobility headed? The Network is taking a look this month, with Focus Magazine. Check out our issue on mobility and learn about the trends that will impact your life.
I’ve always enjoyed my work in coding. Sure, some days it can be monotonous, frustrating, and terrible on my back and eyes, but more often than not I find myself elated to be able to intricately manipulate letters, numbers, symbols, and lines to form a beautiful new creation. Being able to see that same elation within the eyes of so many young and eager minds this past weekend, reminded me (once again) of what incredible opportunities we have to further technology and better our world.
With its native support in Apple’s iOS 8.0, Voice over Wi-Fi (aka Wi-Fi Calling) has suddenly gotten a lot of attention. With Voice over Wi-Fi, a mobile phone which used to be only limited to placing and receiving calls and texting when “cellular coverage” was present, can now use Wi-Fi to provide the same service!
Advanced threats are continuously evolving and so must our ability to detect, understand, and stop them. Indicators of Compromise are vital to this process. At Cisco, our approach to developing Indicators of Compromise and interpreting them is continuously evolving to empower you with the best intelligence to thwart stealthy attacks.
Not only the Indicators themselves, but the process for producing them needs to be dynamic and able to adapt to changing conditions. Cisco AMP Threat Grid tackles this challenge by automating the entire process, including the analyst’s approach to making a determination.
Creating an Indicator of Compromise is a multi-step process driven by analyst experience and knowledge. We start by asking: What actions, entities or artifacts, transient or persistent, can we detect and leverage throughout the analysis process? This question always leads to many more. Is the Indicator specific to a type of attack observed before, for example an eXtreme Rat variant? Or is it using an infection and persistence vector such as DLL Search Order Hijacking? Or is it more of a ‘behavior’? The creation of a CurrentControlSet Registry key would be an example of what we consider a generic Behavioral Indicator; it’s a means of maintaining persistence on a host but it’s not necessarily malicious. Indicators produced through Static Analysis also provide valuable insights. An Object Stream in a PDF that contains JavaScript is not uncommon. But an Object Stream with a reference to another Object that contains JavaScript and that JavaScript contains Indicators for obfuscated shell code is likely malicious.
Thinking about Indicator creation in this way leads to additional questions and steps that involve frequency analysis, clustering, tagging, variable scoring models, and the application of historical analyses and enriched content to the generation of Indicators.
Why are we expending so much effort on Indicators? It’s simple; Indicators are the first step in applying context to the analysis we produce. We see hundreds of thousands of submissions a day pass through the AMP Threat Grid analysis engine. This generates a huge wealth of data including PCAPs, Disk, Memory and Network Artifacts, entities such as registry entries, file paths, network activity, process information, and more. All of this is searchable and extractable via our UI or API. There is no context though. Generating context through the application of knowledge allows for the creation of intelligence that is actionable and specific to the organization that requested it.
AMP Threat Grid solves various use cases and the challenges they pose. As an example, let’s consider Security Operations Centers or SOCs. They typically follow a tiered model when it comes to staffing – junior or Tier 1 analysts through to Tier 3 or 4 specialists. With the volume of commodity malware today it is simply not scalable to expect the specialists on your team to deal with daily infections of banking Trojans or DDoS bots or Bitcoin miners. A process should be defined for each so that they can be treated as expeditiously as a password reset request. Detect, remediate, and move on. How do you operationalize the Tier 1 analyst to be able to effectively respond to an infection of this sort? Context.
Since we began creating Indicators for our data, we’ve always tried to consider the various user types and their areas of expertise. We cannot expect everyone to look at thousands of lines of output and know, for example, that the CurrentControlSet key that was created was not simply operating system noise but a means of persisting on the host. Each of our Indicators includes a detailed description of the activity, why it might be used by a malware author, and the analysis entities that triggered the Indicator. By providing detailed and educational descriptions as well as the actionable content we’re not simply ensuring the analysts have the data to quickly respond. We are also providing an educational platform where analysts constantly gain knowledge and insight into malware and the various techniques leveraged, all the while reducing the total time of an incident. This has the added benefit of freeing up the technical specialists to focus on the attacks and events that are truly critical to the security of an enterprise.
Context allows us to better address threat content enrichment, threat intelligence creation, automation, and integration to improve response, security operations, and help drive enterprises in implementing an intelligence-driven security model.
Next time we’ll take a look at the role of AMP Threat Grid as part of an integrated workflow for response.
In the world of Cisco ACI, there is never a shortage of excitement and action. Today, we are pleased to bring to your attention news about the latest Cisco APIC software release. If you wonder what’s hot of the press in APIC SW release 1.0(3f) for Nexus 9000 series ACI mode, there are quite a few.
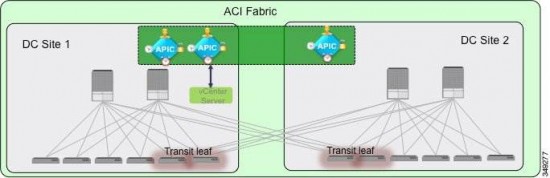
The Stretched Fabric feature captures the headlines. For quite some time now customers have been asking for an ACI Fabric that can stretch across datacenters and over long distances. The new software allows for each leaf and spine, that participate in creating a fabric, to be located up to 30 KMs apart. It also removes the restriction for every leaf to be connected to all spines. Let us take a close peek at the stretched fabric feature.
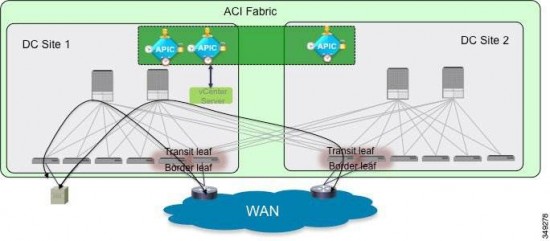
Stretched ACI fabric is a single fabric. It is a partially meshed design that connects ACI leaf and spine switches distributed in multiple locations. Typically, an ACI fabric implementation is a single site where the full mesh design connects each leaf switch to each spine switch in the fabric. This yields the best throughput and convergence. In multi-site scenarios, full mesh connectivity may be not possible or may be too costly. Multiple sites, buildings, and rooms can span distances that are not serviceable by enough fiber connections, or are too costly to connect each leaf switch to each spine switch across the sites. Diagram below illustrates the stretched fabric architecture.
Transit Leaf Switch Guidelines
Transit leaf refers to the leaf switches that provide connectivity between two sites. Transit leaf switches connect to spine switches on both sites. There are no special requirements and no additional configurations required for transit leaf switches
The key benefits of stretched fabric include workload portability and VM mobility.The stretched ACI fabric behaves the same way as a regular ACI fabric, supporting full VMM integration. For example, one VMWare vCenter operates across the stretched ACI fabric sites. The ESXi hosts from both sites are managed by the same vCenter and Distributed Virtual Switch (DVS). They are stretched between the two sites.
The ACI switch and APIC software recover from various failure scenarios. Check out the failover scenario analysis for details.
Don’t look now, but that guy’s app just measured his heartbeat when he saw you and we think it’s a match! Sound far-fetched? Well, it’s not.
In a very interesting (and possibly draining) year-long dating social experiment, a Newsweek contributor discovered that finding love has gone beyond reviewing online profiles, as some of the industry’s largest match-making companies are developing “wearables” and apps that are becoming the newest weapon in match-making. Utilizing everything from musical playlists to physiological reactions (like that racing heartbeat) the apps match daters in close vicinity with similar-minded interests. Not surprisingly, millennials are becoming some of the fastest adopters of the wearables movement.
In a recent survey, more than half of millennials revealed they were excited about the growth of the wearables market. And it’s no wonder, considering the fact that overall, millennials are an extremely connected and influential generation. They’ve grown up in a world where smartphones are the norm, social media apps are preferred communication platforms and an untold number of studies have been conducted on best practices for marketing to them. And the lens from which they view technology – as an expected day-to-day necessity – is part of the reason they’re the power behind the growing widespread adoption of wearable technology.
As the Internet of Everything continues to evolve and connect more people, process, data and things, wearable technology is not only delivering more information to us – but also bringing us all closer together. Holidays like Valentine’s Day are the perfect reminder that connections matter and go to the heart of who we are as people. Considering our natural inclination to seek out meaningful connections and the technology we have on-hand, wearables are on trend to become an invaluable networking tool, empowering an entire new level of collaboration and opportunities between employees, clients and business leaders.
According to the Cisco 2014 Connected World Technology Report, millennials believe a wearable device will be an important part of workplace 2020. Indeed, it’s estimated more than 177 million wearable devices will be in use by 2018. With a smart phone in one hand, and perhaps a fitness tracker attached to their wrist, mobility is an essential part of the millennial lifestyle. In other words, they are data-driven and businesses the world over have taken a new look at everything from their recruiting practices (using Skype for interviews) to mobile-office options to recruit and keep millennial talent on board. Companies who have embraced a holistic approach to mobility are moving in the right direction, as the millennial workforce shuns the idea of carrying multiple devices to perform work-related tasks.
A couple of years ago, I talked about a connected workforce, focusing specifically on millennials and how their perspective, as the newest generation of workers, would alter the employment scene as we know it. I’m by no means a fortune teller, but myself and the entire industry have seen this become reality. Through the tools of the Internet of Everything – wearables among them – millennials are empowered to connect with people who they have never had the chance to meet and learn from. These connections and the cross-sharing of ideas, goals and common experiences are opening up a new world of opportunity as the world changes and our connections evolve.
What type of new experiences and opportunities for wearables do you hope to see in the future? Share your thoughts here and be sure to follow the discussion using #Internet of Everything.
Welcome to our latest #SocialRoundup blog series about new social media efforts and best practices. Today, we visit the stadium turf and the concert stage to see how brands leveraged the Super Bowl and the GRAMMYS to drive awareness and engagement with their audiences.
The New England Patriots’ 28-24 victory over the Seattle Seahawks was the most watched TV show in U.S. history. The challenge for brands, which spent a record $4.5 million for a 30-second TV ad, was maximizing this investment on social media.
McDonald’s, for example, used its “Lovin“-themed campaign in a TV commercial to promote new way for patrons to pay for their order – with an act of love.
The fast food giant also gave away every product advertised during the game, tweeting the offers out in real-time. The strategy worked — McDonald’s got 1.2 million retweets overall, and 25,000 new Twitter followers that day.
The live TV event that is the GRAMMYs proved to be another potent venue for social media, with brands like MasterCard and Patron using Twitter to publish promoted tweets in real time in reaction to what was taking place during the show.
You can’t forget about one of the biggest basketball games of the year –NBA All-Star 2015. This week, the Cisco Corporate Social Responsibility team followed Deborah Huyler and Andrew Torres, two Cisco Networking Academy Dream Team students, as they set up wireless access points and provided network troubleshooting in advance of the NBA All-Star 2015. They have been sharing their stories from Madison Square Garden, the Barclays Center, and other event venues through journal entries, photo slideshows, and videos.
Learn more about Cisco’s involvement at the NBA All-Star game and follow the #NetAcadNBA hashtag on Twitter to see real-time updates from Deborah and Andrew’s NBA All-Star 2015 experiences.
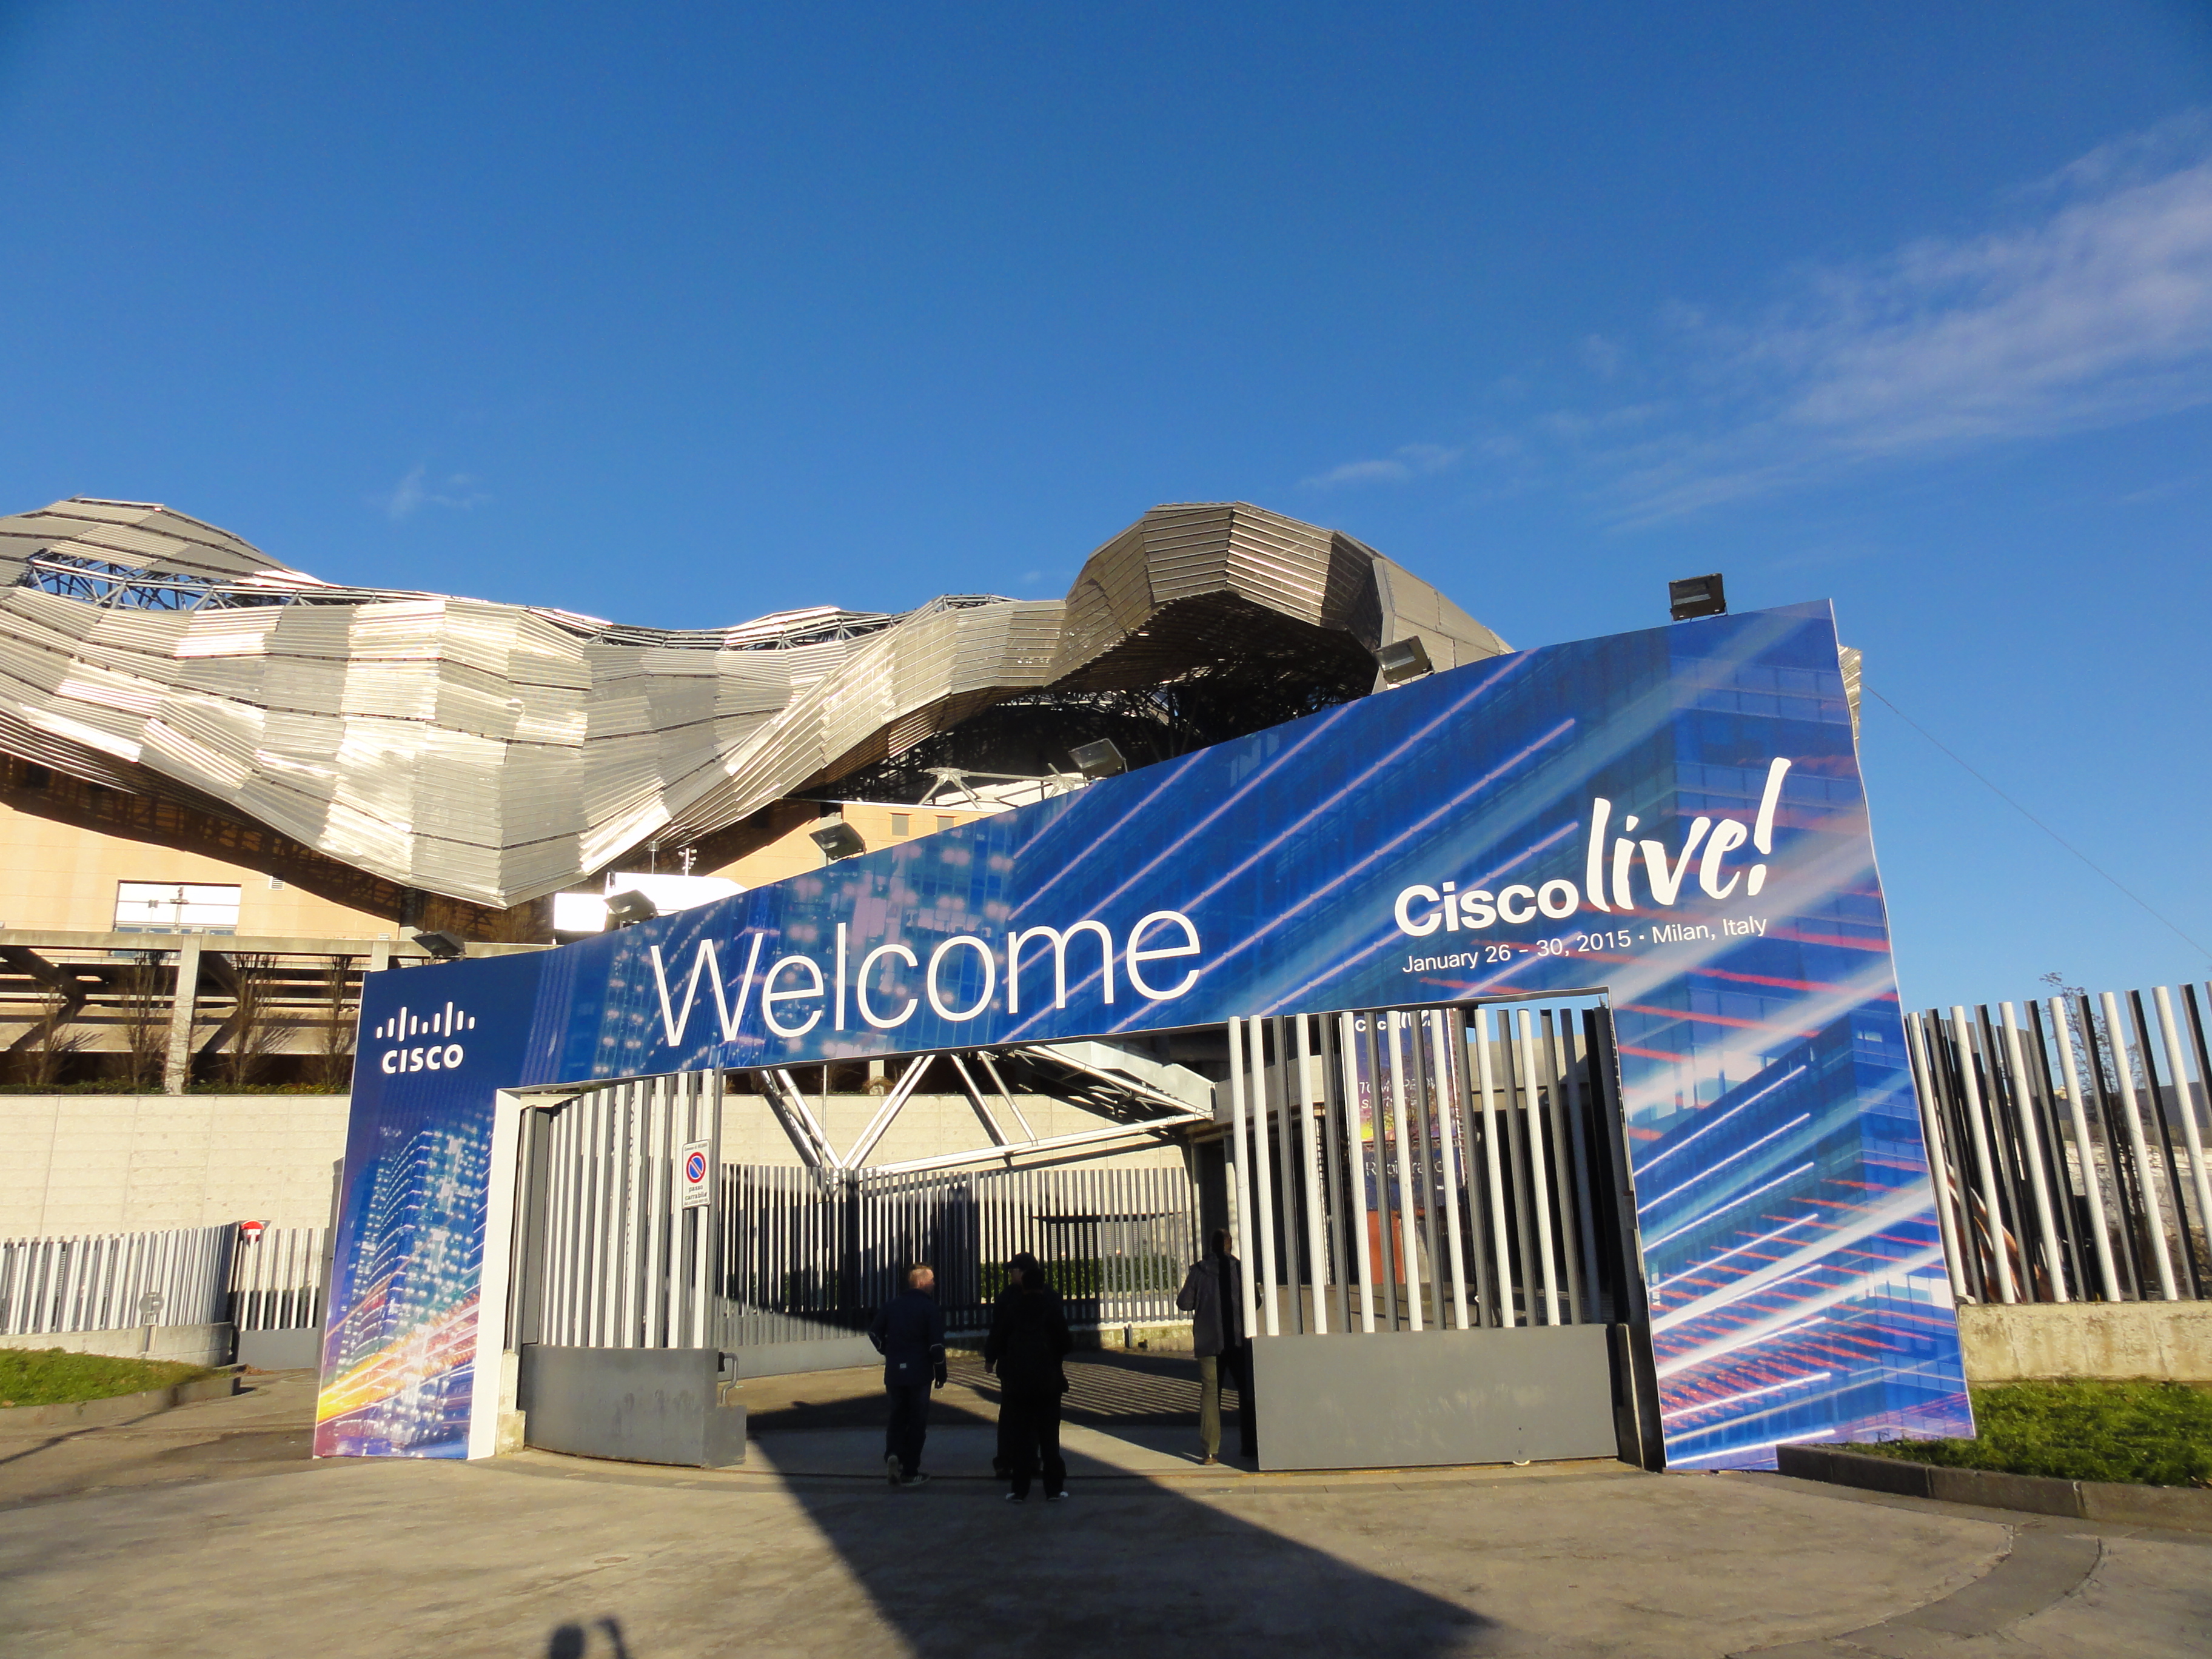
Written by Igor Dayen, SP Product and Solutions Marketing
If you had a chance to join us at Cisco Live Milan last month, thank you very much for making this another exciting event for all of us. If you missed out being there in person, let me give you a brief summary of the highlights. Milan is the main industrial, commercial, and financial center of Italy and a leading global city where the EXPO 2015 will take place. What could be better than such a city to host the Cisco Live 2015 event! It proved to be fertile grounds for driving innovations with our service provider customers and partners. Our exhibition was structured to tell the story of the Open Network Strategy by presenting over 15 technology and business demos. We also brought the newest routers and switches with us to showcase the latest innovations that service providers can start deploying today. Last but not least we have teamed up with the DevNet area where attendees could get their hands on developing applications and learning on virtualization, orchestration, and automation. Our service provider booth of the Cisco Campus in the World of Solutions was very busy: “standing room only” and so many insightful conversations were conversations around the NFV (Network Functions Virtualization) and the SDN (Software Defined Networks), as pillars for delivering cloud services and an automated networking handling respectively, have matured significantly and are ready for prime time. Continue reading ““Standing Room Only” in the Service Provider Booth at Cisco Live Milan 2015”
Here’s the scenario: you have a remote branch office in Miami that has been running smoothly for months. Today you are getting complaints from the site that relate to phone calls dropping, email and network connectivity being intermittent. Management is pushing your team to get it fixed.
You start by looking closely at the WAN circuit going into the site. You use a program that Cisco introduced called NetFlow. By using this program you are able to determine that the WAN link is being saturated by a particular server to server file transfer. You need a quick fix to this issue. You could go with QoS but that could take some time and input from the site to gather statistics on the critical traffic. Instead you decide to utilize Rate-Limiting on the WAN interface.


 Open Network Strategy