Authored by: Ivan Berlinson, Aditya Raghavan
As the technical landscape evolves, automation stands as a cornerstone in achieving XDR outcomes. It’s a testament to the prowess of Cisco XDR that it boasts a fully integrated, robust automation engine.
Cisco XDR Automation embodies a user-friendly, no-to-low code platform with a drag-and-drop workflow editor. This innovative feature empowers your SOC to speed up its investigative and response capabilities. You can tap into this potential by importing workflows within the XDR Automate Exchange from Cisco, or by flexing your creative muscles and crafting your own.
Remember from our past Black Hat blogs, we used automation for creating incidents in Cisco XDR from Palo Alto Networks and Corelight.
The following automation workflows were built specifically for Black Hat use cases:
Category: Create or update an XDR incident
- Via Splunk Search API — XDR incident from Palo Alto Networks NGFW Threats logs
- Via Splunk Search API — XDR incident from Corelight Notice and Suricata logs
- Via Splunk Search API — XDR incident from Cisco Secure Firewall intrusion logs
- Via Splunk Search API — XDR incident from ThousandEyes Alert
- Via Splunk Reporting API — XDR incident from Umbrella Security Events
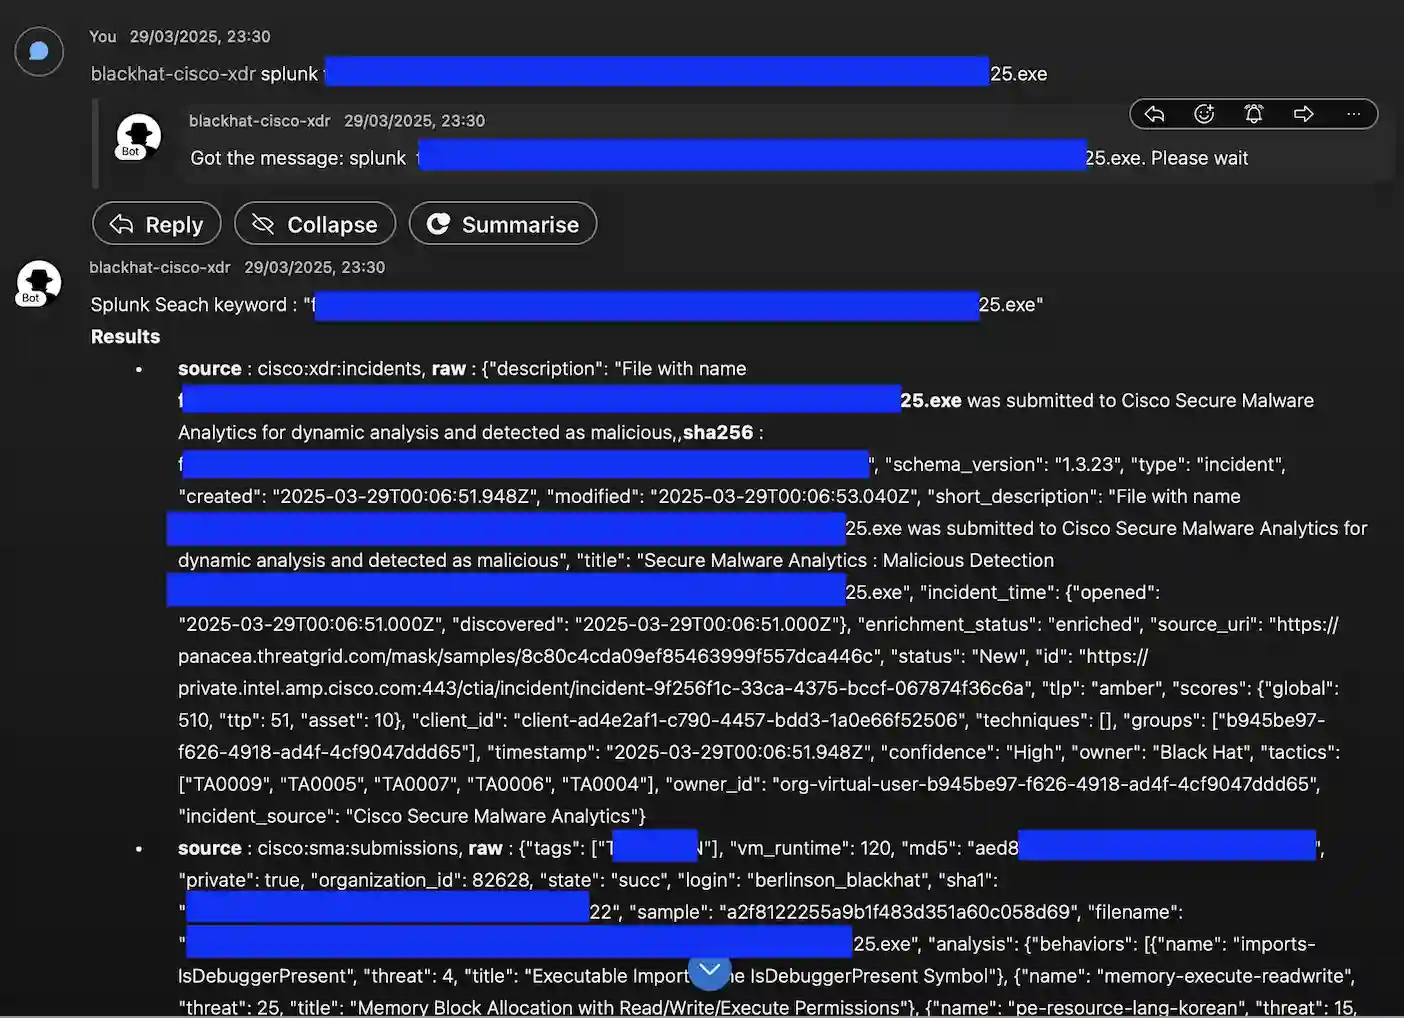
- Via Secure Malware Analytics API — XDR incident on samples submitted and convicted as malicious
Category: Notify/Collaborate/Reporting
- Webex notification on new incident
- Last 6 hours reports to Webex
- Last 24 hours reports to Webex
Category: Investigate
- Via Splunk Search API and global Variables (table) — Indentify Room and Location (incident rules on status new)
- Identify Room and Location (incident playbook)
- Identify Room and Location (Pivot Menu on IP)
- Webex Interactive Bot: Deliberate Observable
- Webex Interactive Bot: Search in Splunk
- Webex Interactive Bot: Identify Room and Location
Category: Report
- XDR incident statistics to Splunk
Category: Correlation
- Merge XDR incidents
Workflows description
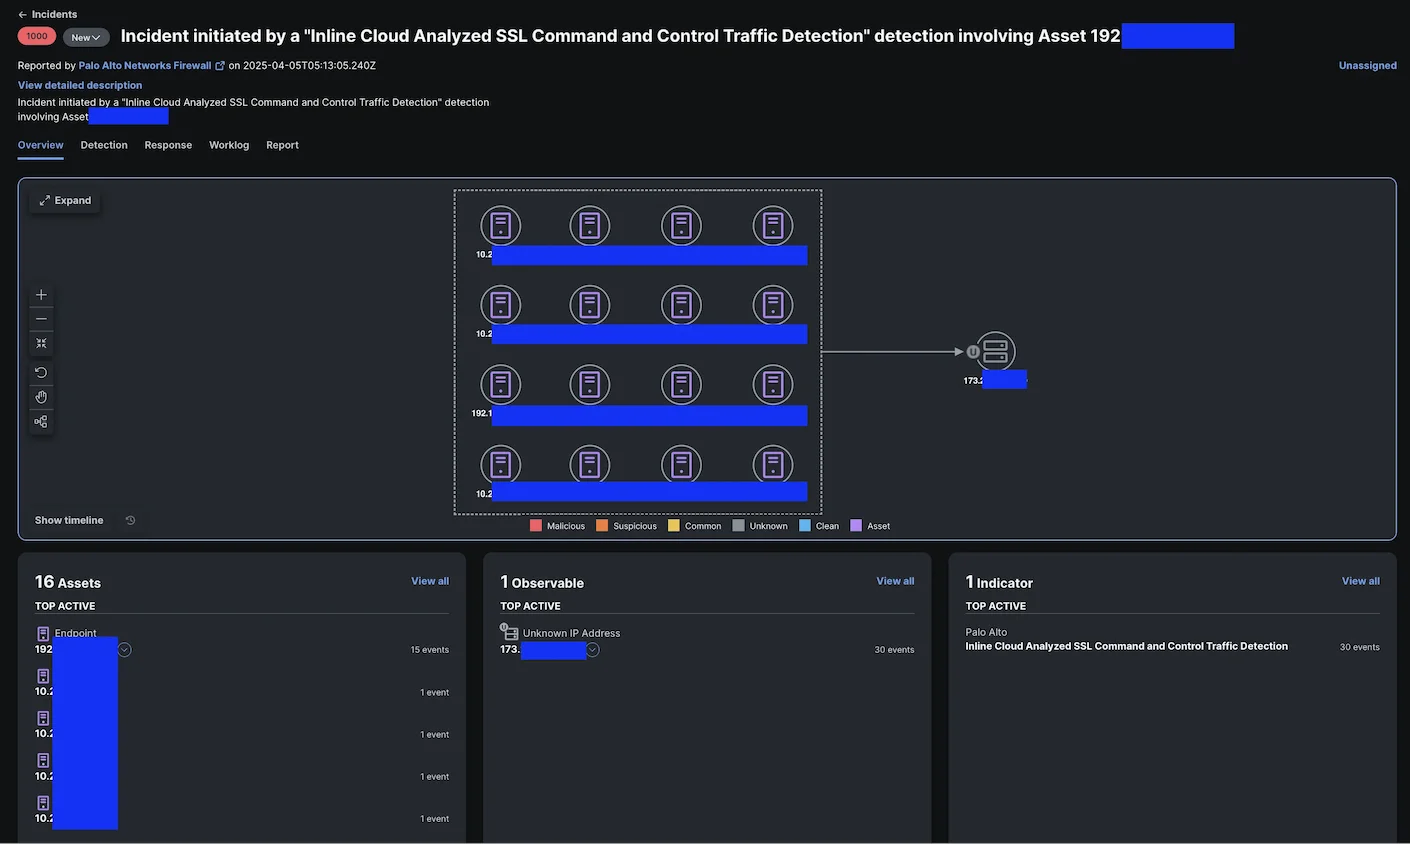
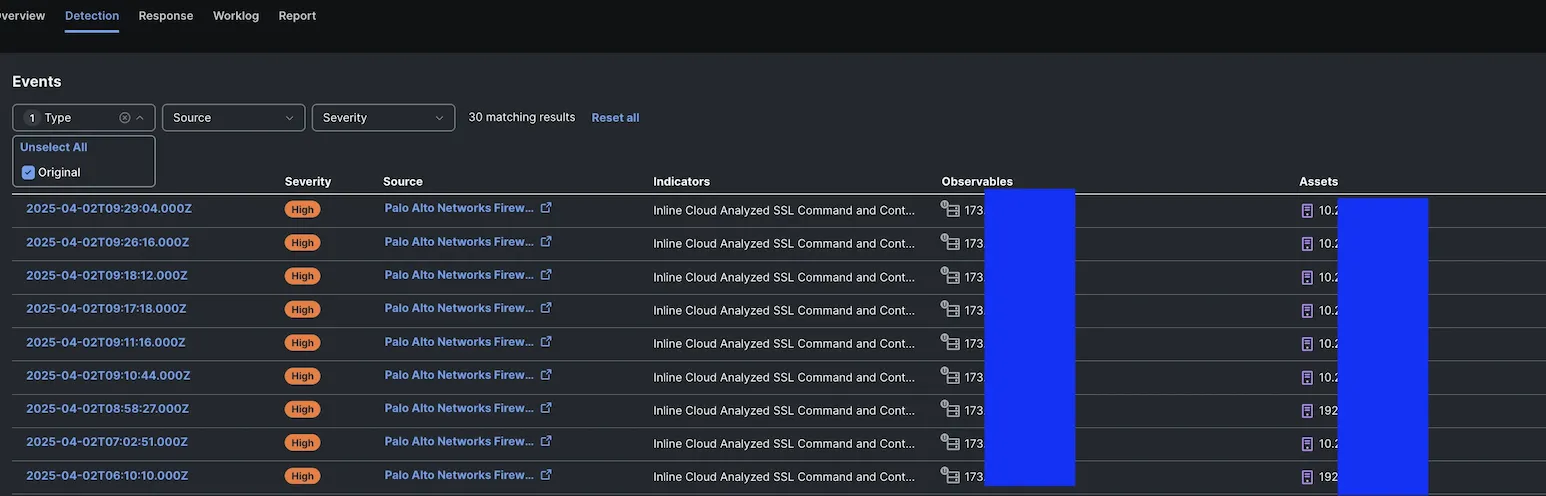
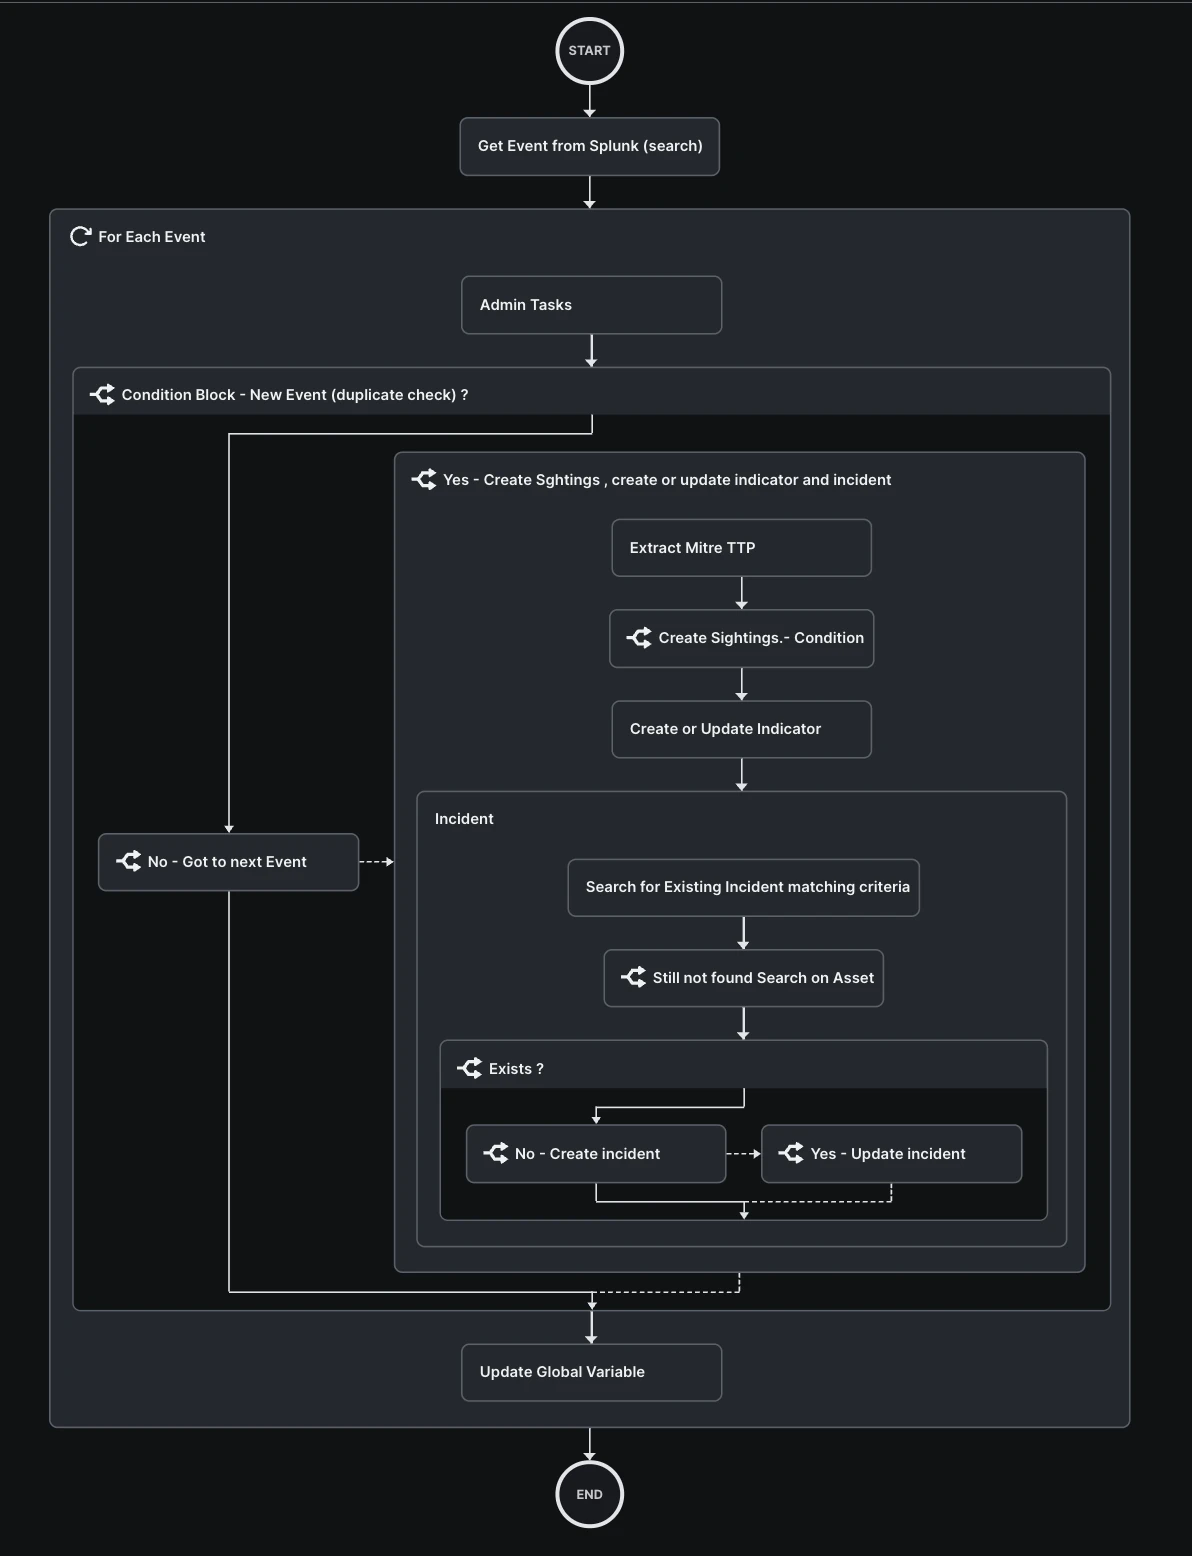
These workflows are designed to run every five minutes and search the Splunk Cloud instance for new logs matching certain predefined criteria. If new logs are found since the last run, the following actions are performed for each of them:
- Create a sighting in XDR private intelligence, including several pieces of information useful for analysis during an incident investigation (e.g., source IP, destination IP and/or domain, destination port, authorized or blocked action, packet payload, etc.). These alerts can then be used to create or update an incident (see next steps), but also to enrich the analyst’s investigation (XDR Investigate) like other integrated modules.
- Link the sighting to an existing or a new threat indicator.
- Create a new XDR incident or update an existing incident with the new sighting and MITRE TTP.
- To update an existing incident, the workflow uses the method described below, enabling the analyst to have a complete view of the different stages of an incident, and to identify whether it could potentially be part of a Training Lab (several Assets performing the same actions):
- If there is an XDR incident with the same observables related to the same indicator, then update the incident
- If not, check there is an XDR incident with the same observables and only if the observable type is IP or Domain then update the incident
- If not, check if an XDR incident exists with the same target asset, then update the incident
- If not, create a new incident
- To update an existing incident, the workflow uses the method described below, enabling the analyst to have a complete view of the different stages of an incident, and to identify whether it could potentially be part of a Training Lab (several Assets performing the same actions):
Identify Room and Location
It was important for the analysts to obtain as much information as possible to help them understand whether the malicious behavior detected as part of an incident was a true security incident with an impact on the event (a True Positive), or whether it was legitimate in the context of a Black Hat demo, lab and training (a Black Hat Positive).
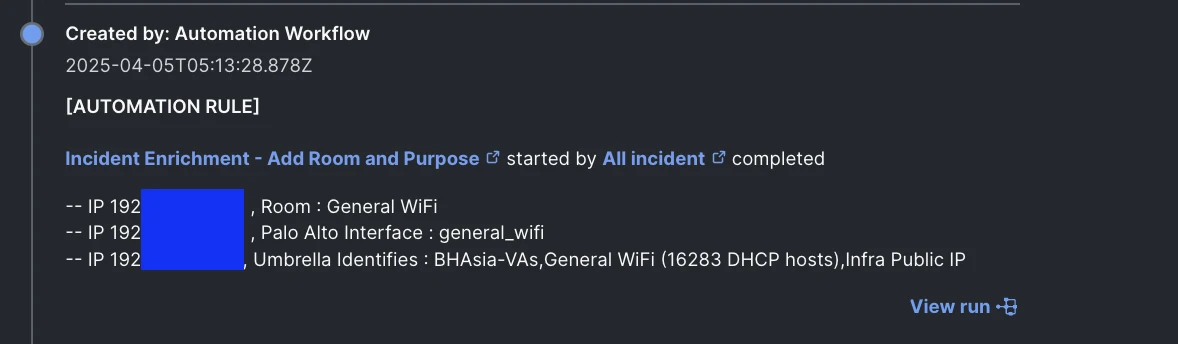
One of the methods we used was a workflow to find out the location of the assets involved and the purpose of it. The workflow is designed to run:
- Automatically on new XDR incident and add the result in a note
- On demand via a task in the XDR incident playbook
- On demand via the XR pivot menu
- On demand via the Webex interactive bot
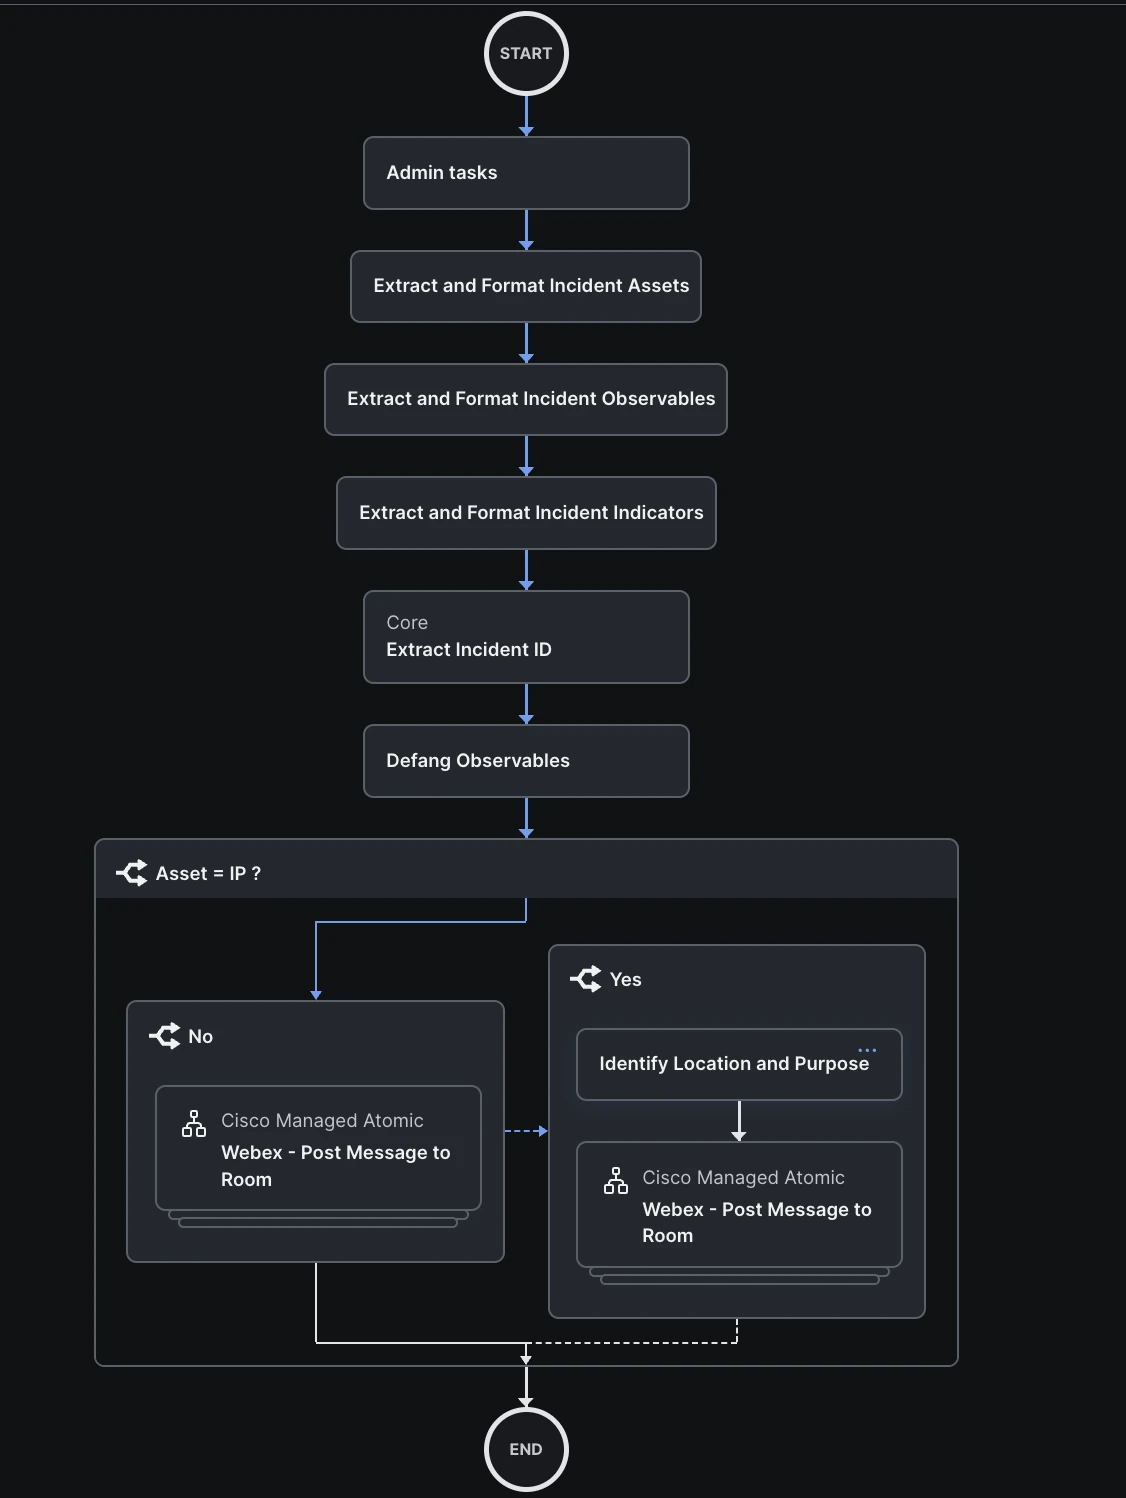
The workflow uses one or more IP addresses as input, and for each of them:
- Queries an array (global variable XDR), including network address of each room/area of the event and purpose (Lab XYZ, Registration, General Wi-Fi, etc.)
- Runs a search in Splunk on Palo Alto Networks NGFW Traffic Logs to get the Ingress Interface on the given IP
- Run a search in Splunk on Umbrella Reporting Log to get to the Umbrella Network Identities


Webex Notification and Interactive Bot
Proper communication and notification are key to ensure no incident is ignored.
In addition to Slack, we were leveraging Cisco Webex to receive a notification when a new incident was raised in Cisco XDR and an interactive Bot to retrieve additional information and help in the first step of the investigation.
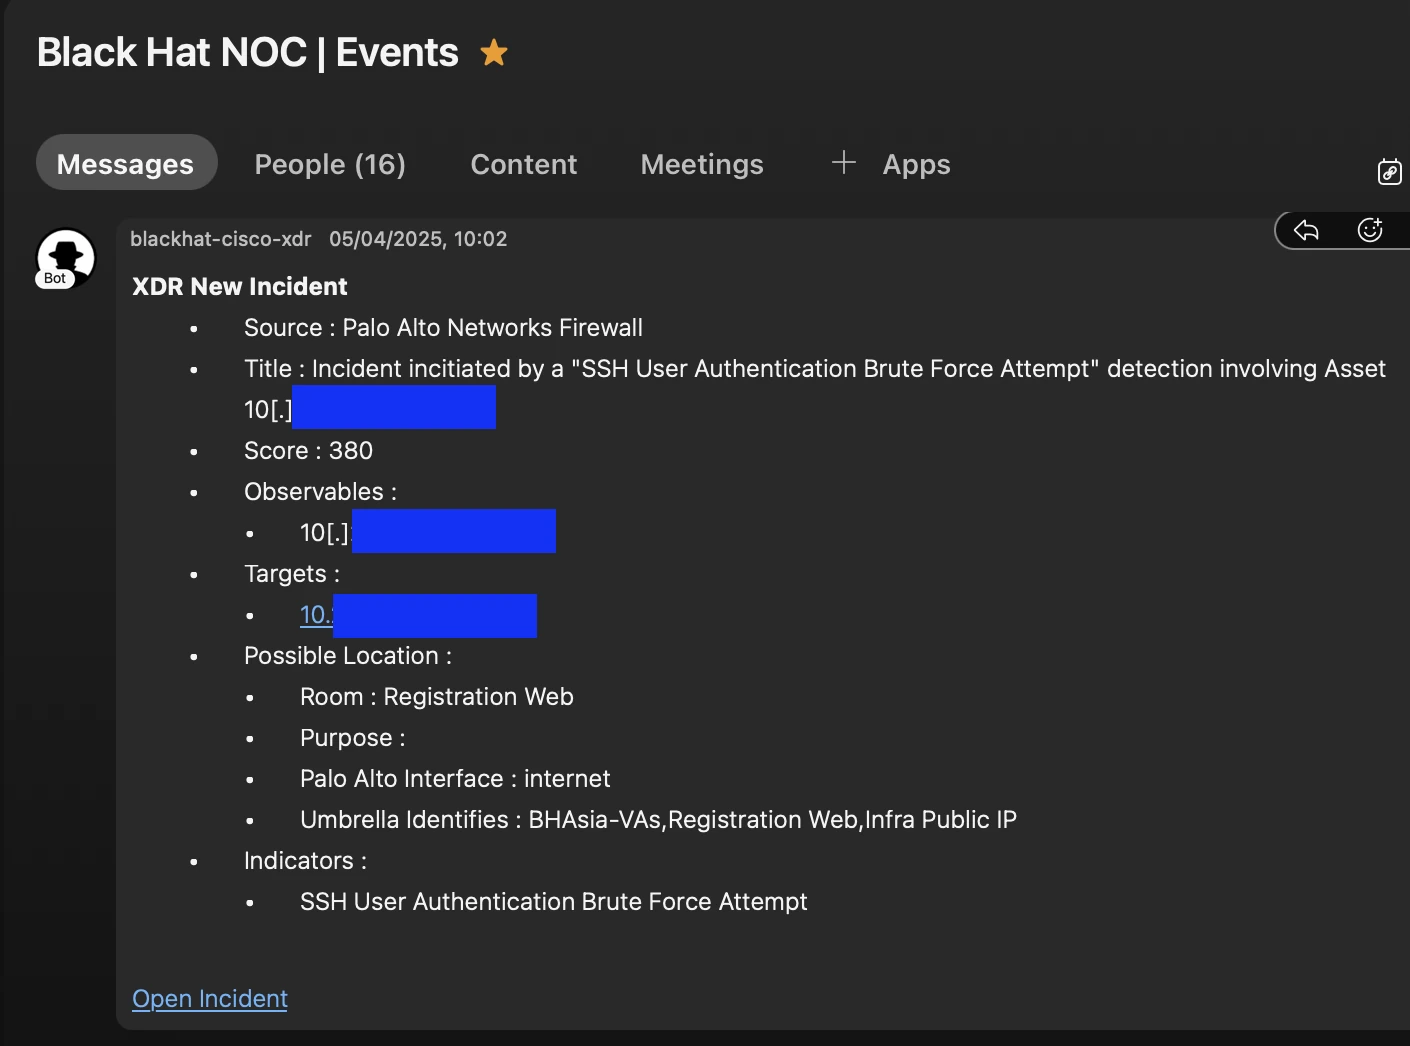
Notification
On new incident an automation was triggering a workflow to grab a summary of the incident, trigger the enrichment of the location and purpose of the room (see previous workflow) and send a Notification in our collaborative room with details about the incident and a direct link to it in XDR.
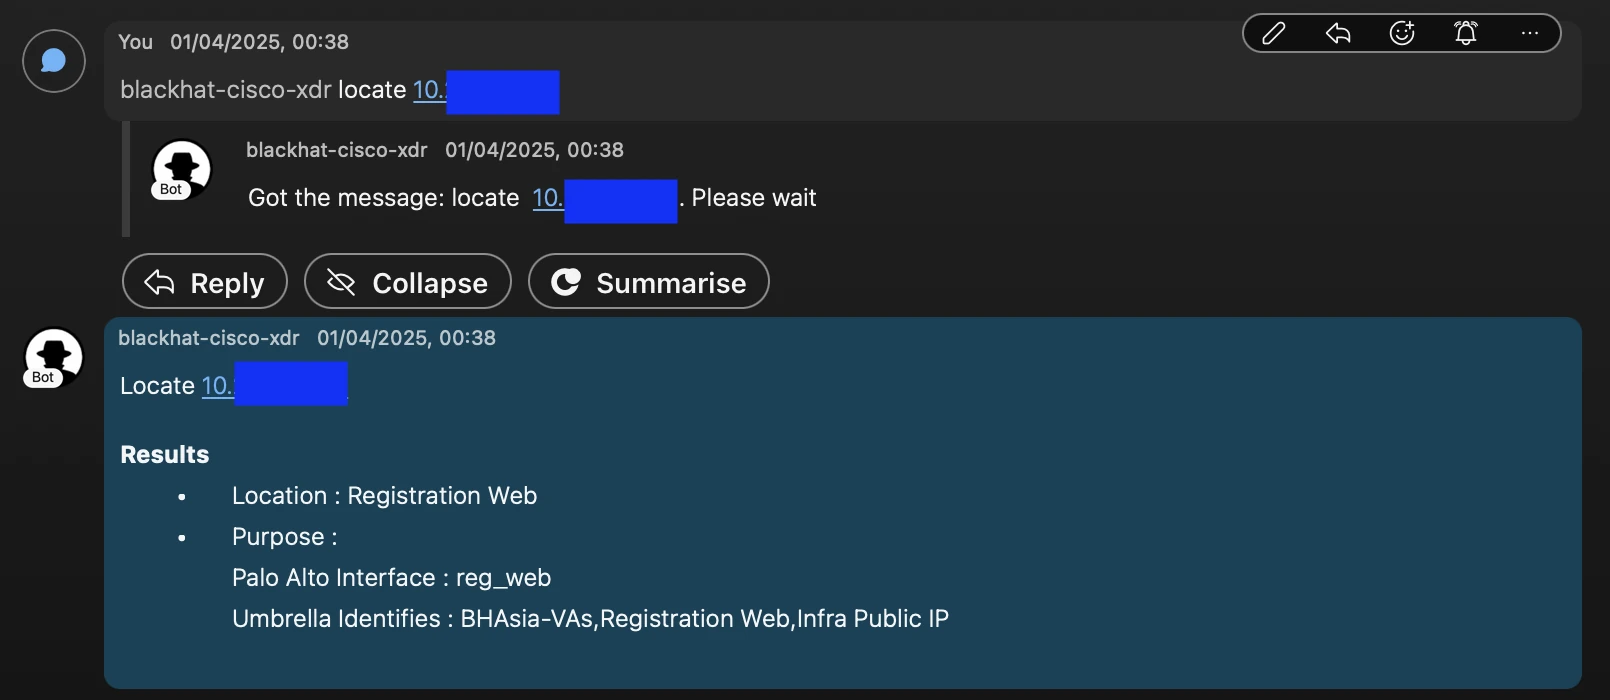
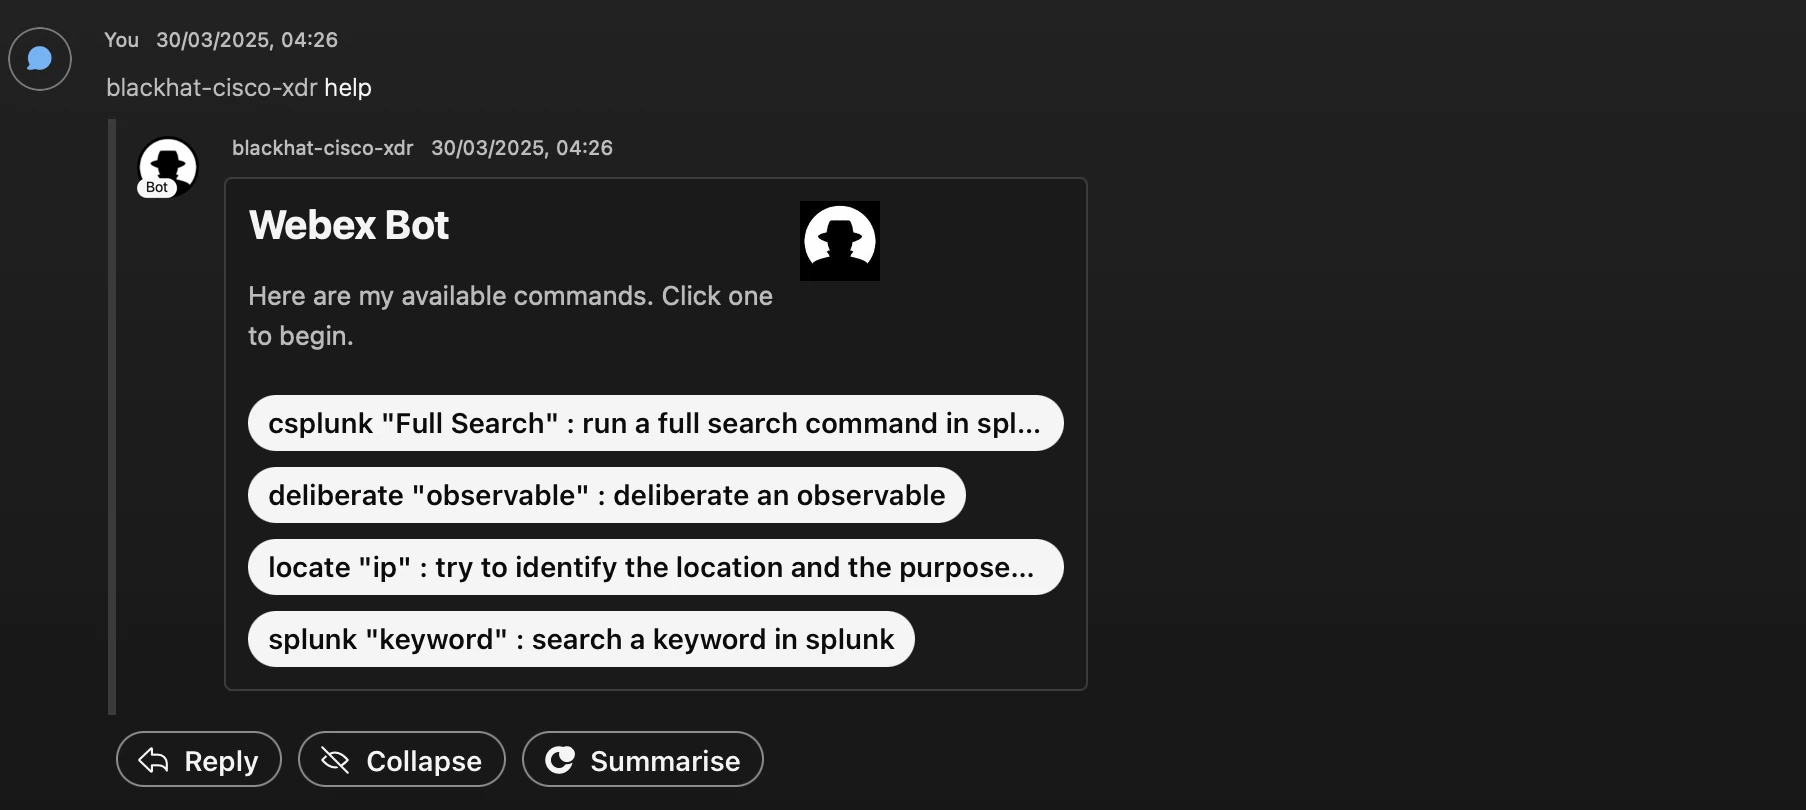
Interactive Bot
An interactive Webex Bot tool was also used to help the analyst. Four commands were available to trigger a workflow in Cisco XDR via a Webhook and display the result as a message in Cisco Webex.
- locate [ip] — Search for location and purpose for a given IP
- deliberate [observable] — Obtain verdicts for a given observable (IP, domain, hash, URL, etc.) from the various threat intelligence sources available in Cisco XDR (native and integrated module)
- splunk [custom search query] — Search Splunk with a custom search query

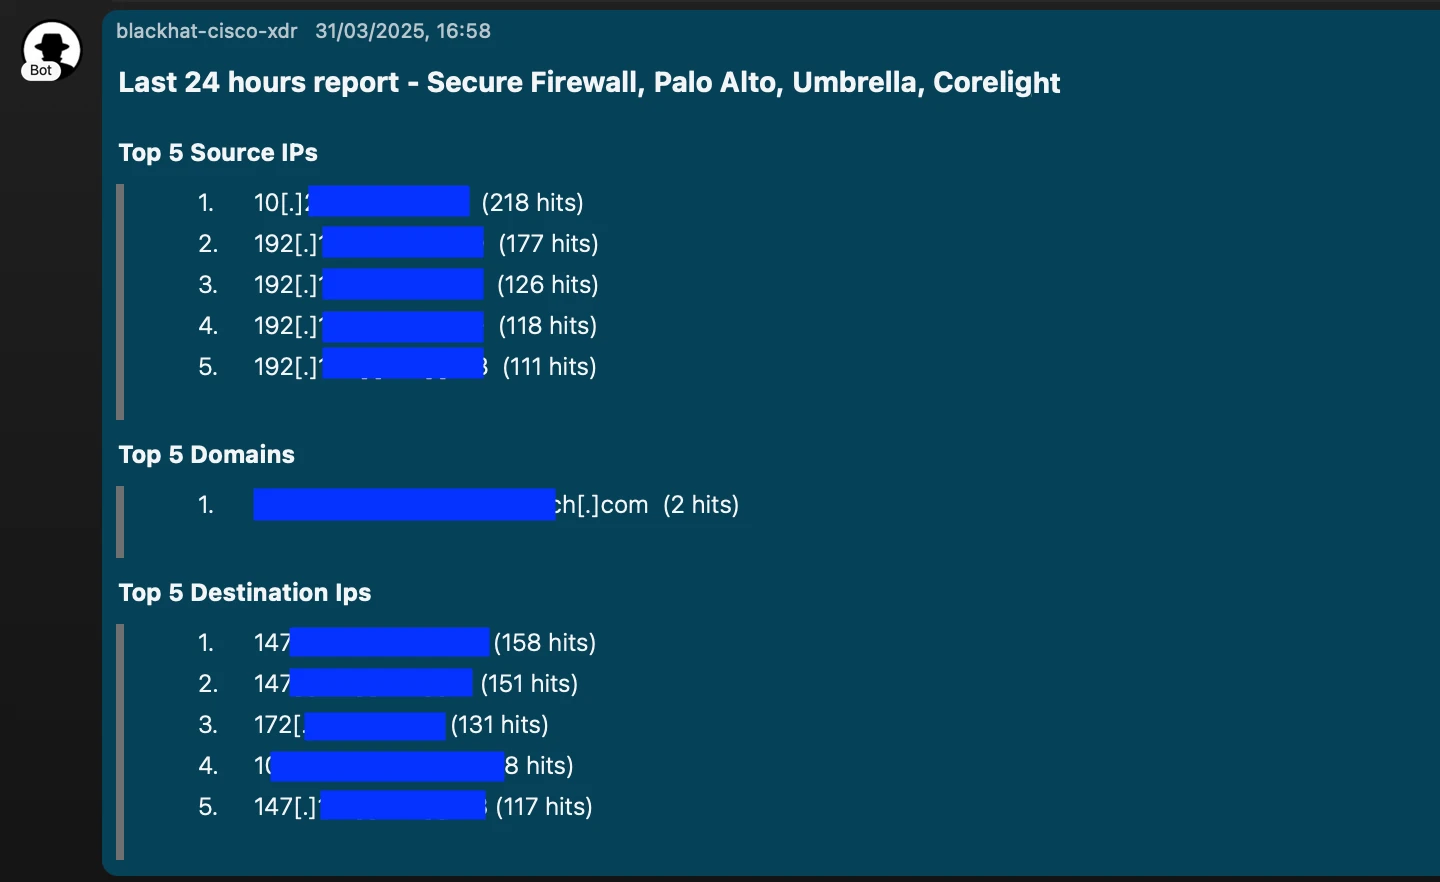
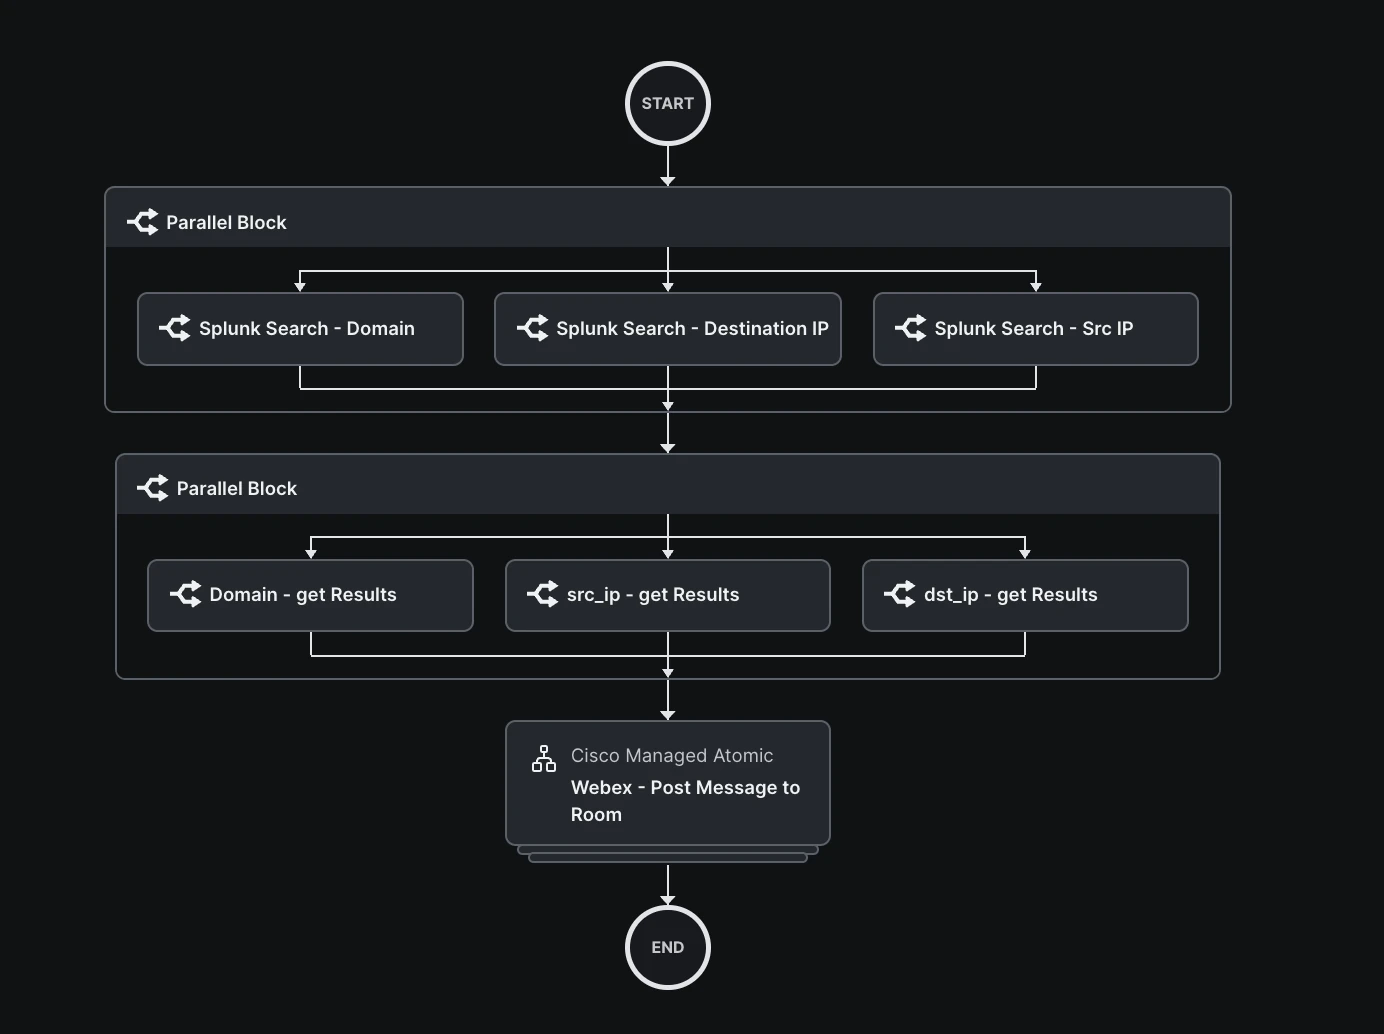
Last 6/24 hours report to Webex
Both workflows run every 6 hours and every 24 hours to generate and push to our Webex collaboration rooms a report including the TOP 5 assets, domains and target IPs in the security event logs collected by Splunk from Palo Alto Networks Firewall, Corelight NDR and Cisco Umbrella (search […] | stats count by […]).
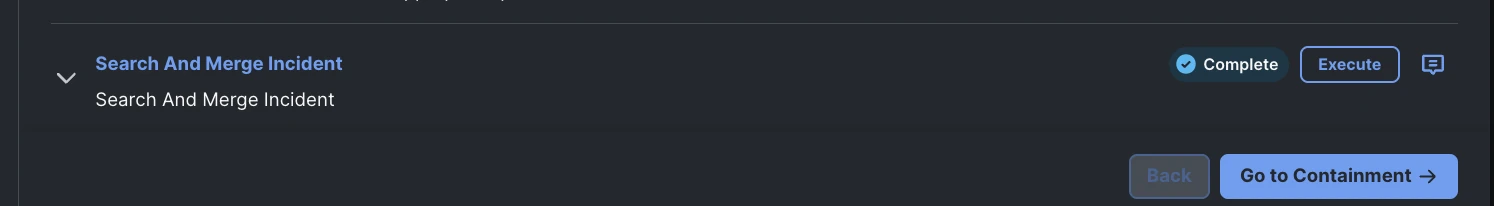
Merge XDR Incident
Cisco XDR uses several advanced techniques to identify a chain of attack and correlate various related security detections together in a single incident. However, sometimes only the analyst’s own investigation can reveal the link between the two. It was important for analysts to have the option, when they discover this link, of merging several incidents into one and closing the previously generated incidents.
We’ve designed this workflow with that in mind.
During the identification phase, the analyst can run it from the “merge incident” task in the Incident playbook of any of them.

At runtime, analysts will be prompted to select the observables that are part of the current incident that they wish to search for in other incidents that include them.
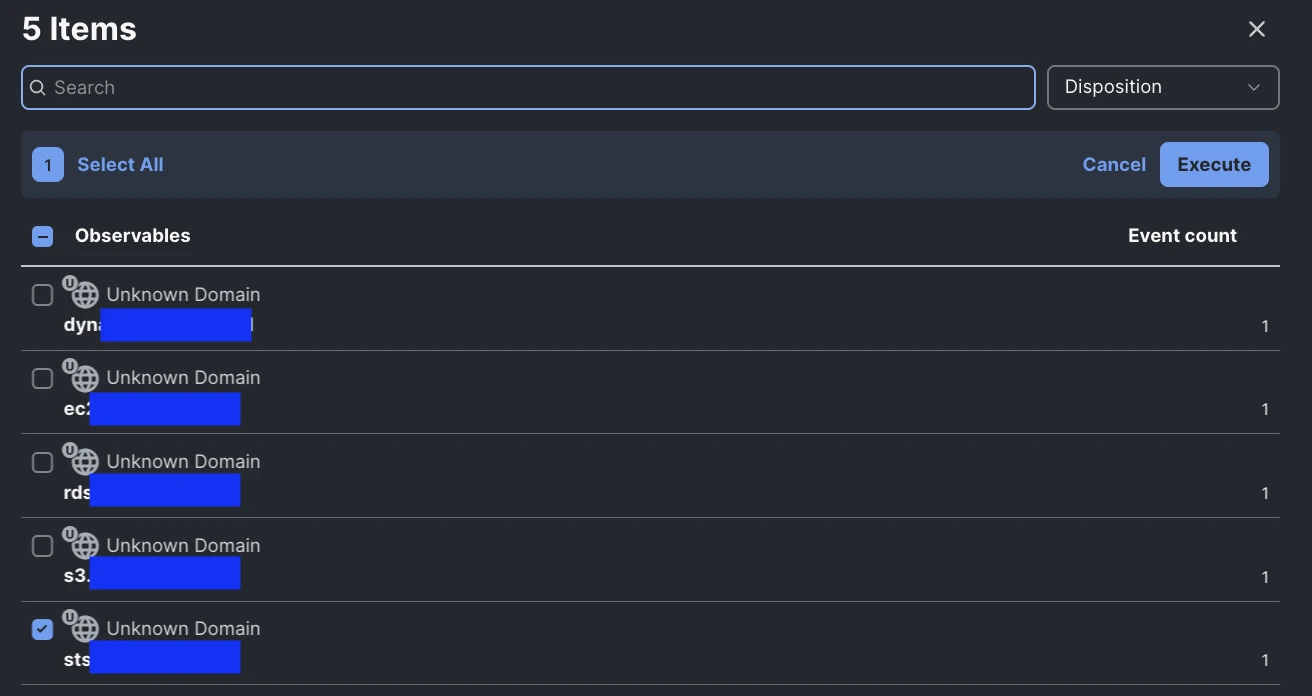
The workflow will then search in XDR for other incidents involving the same observables and report incidents found in the current incident notes.
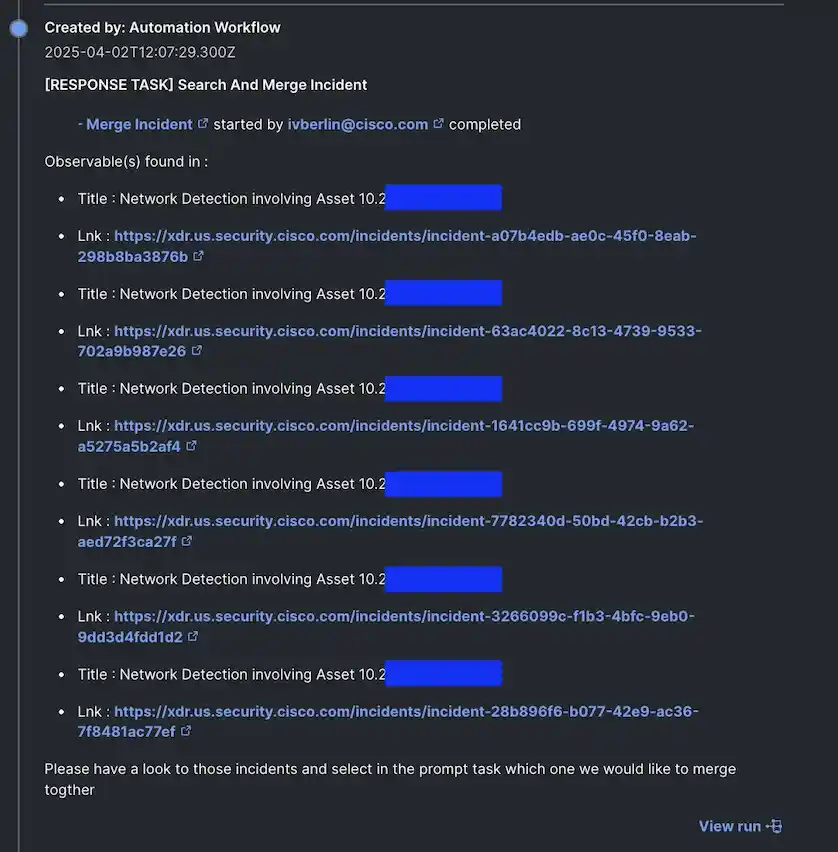
Analysts are then invited via a prompt to decide and indicate the criteria on which they would like the merger to be based.
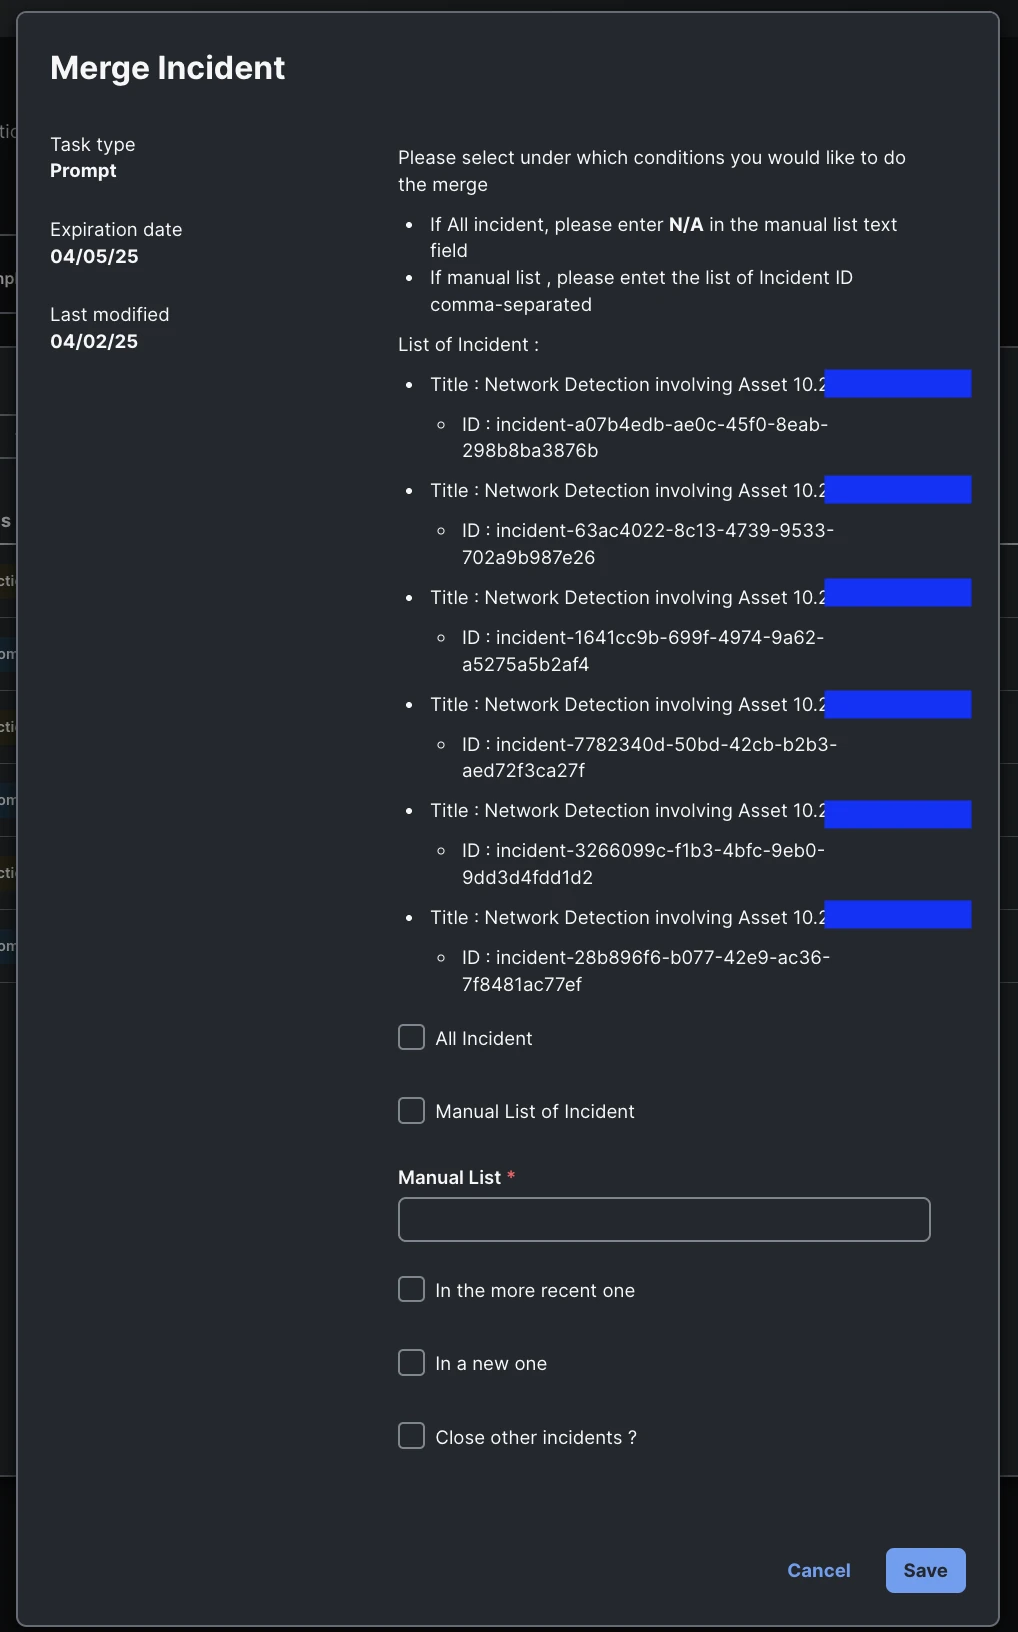
The prompts include:
- All incidents — Accept the list of incidents found and merge them all
- Manual list of incidents — Manually enter the identifier of the incidents you wish to merge; the list may include the identifier of an incident discovered by the workflow or another discovered by the analyst
- Merge in a new incident or In the most recent one
- Close other incidents — Yes/No
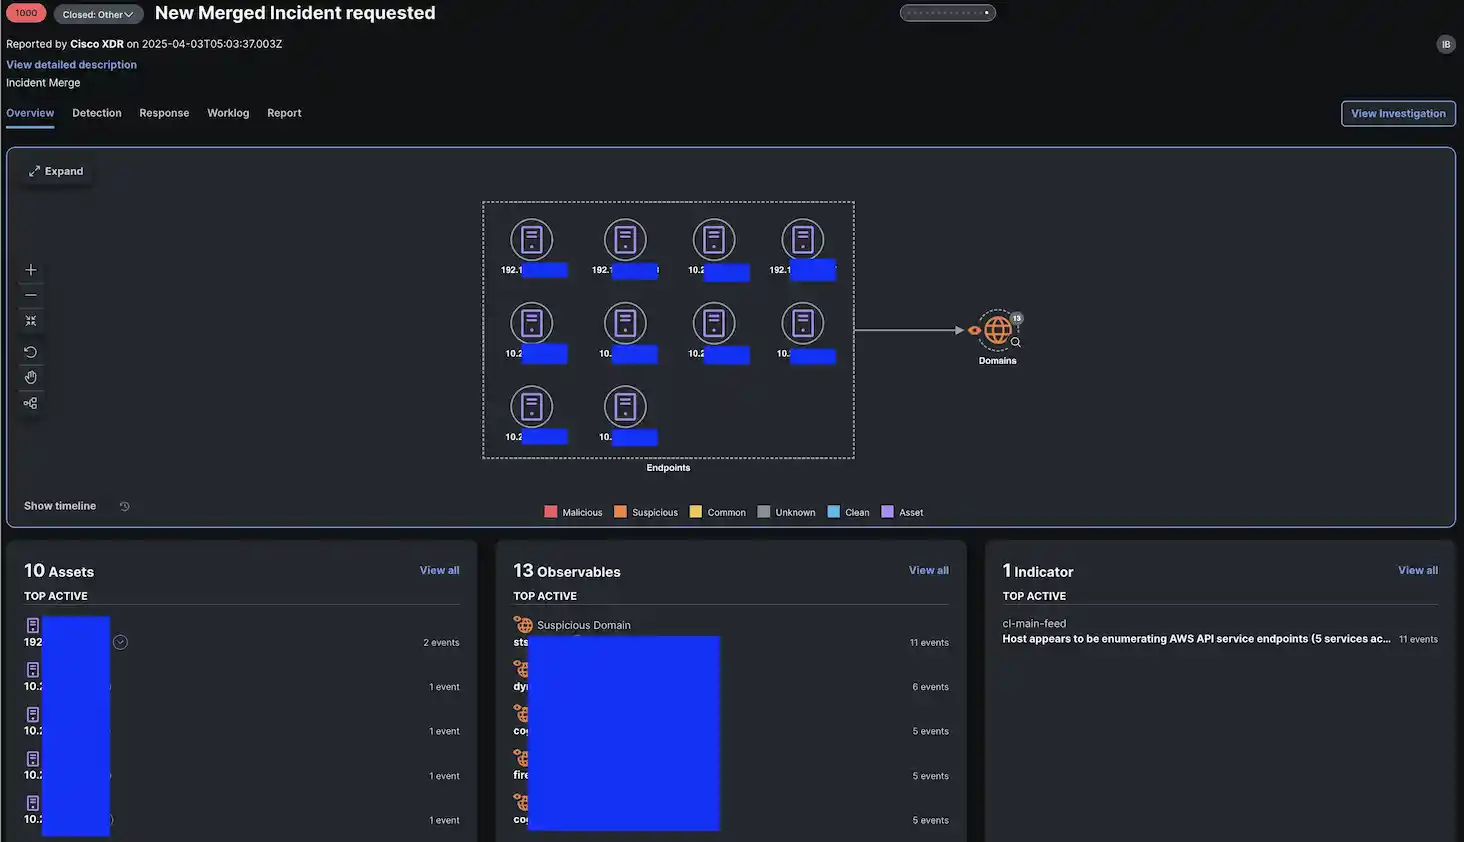
The workflow then extracts all the information from the selected incident and creates a new one with all this information (or updates the most recent incident).
To make our threat hunters’ lives richer with more context from ours and our partners’ tools, we brought in Splunk Enterprise Security Cloud at the last Black Hat Europe 2024 event to ingest detections from Cisco XDR, Secure Malware Analytics, Umbrella, ThousandEyes, Corelight OpenNDR and Palo Alto Networks Panorama and visualize them into functional dashboards for executive reporting. The Splunk Cloud instance was configured with the following integrations:
- Cisco XDR and Cisco Secure Malware Analytics, using the Cisco Security Cloud app
- Cisco Umbrella, using the Cisco Cloud Security App for Splunk
- ThusandEyes, using the Splunk HTTP Event Collector (HEC)
- Corelight, using Splunk HTTP Event Collector (HEC)
- Palo Alto Networks, using the Splunk HTTP Event Collector (HEC)
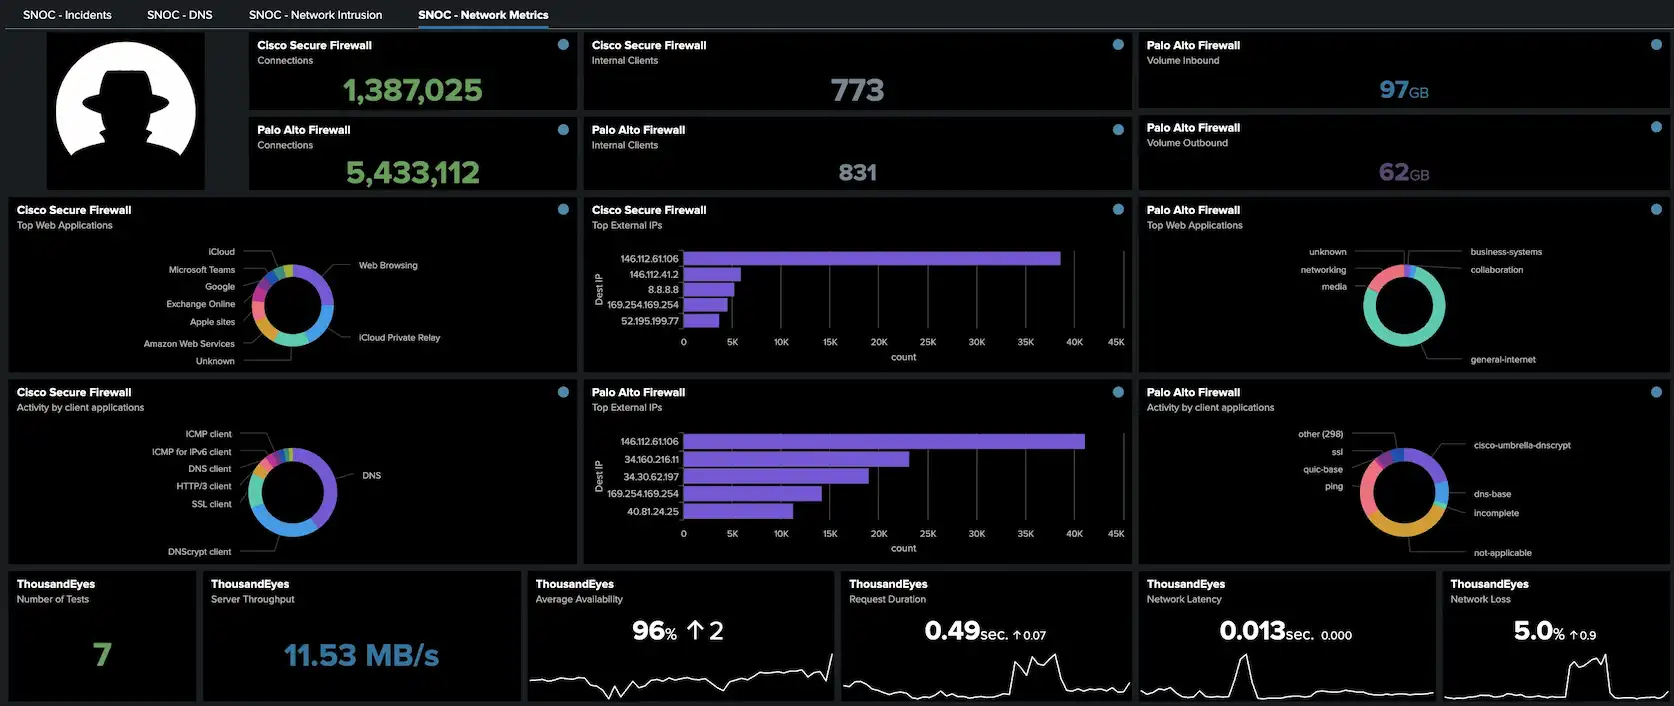
The ingested data for each integrated platform was deposited into their respective indexes. That made data searches for our threat hunters cleaner. Searching for data is where Splunk shines! And to showcase all of that, key metrics from this dataset were converted into various dashboards in Splunk Dashboard Studio. The team used the SOC dashboard from the last Black Hat Europe 2024 as the base and enhanced it. The additional work brought more insightful widgets needing the SOC dashboard broken into the following 4 areas for streamlined reporting:
1. Incidents
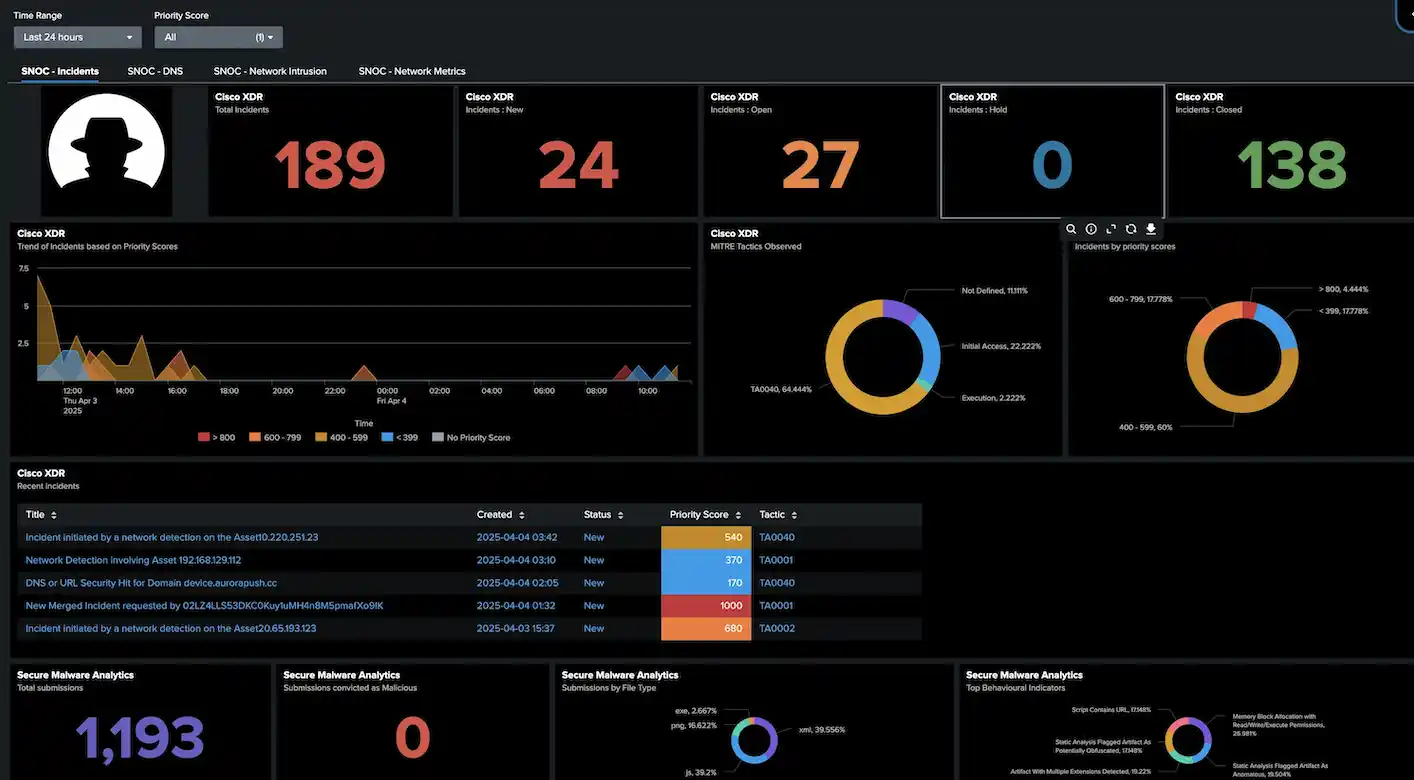
2. DNS

3. Network Intrusion
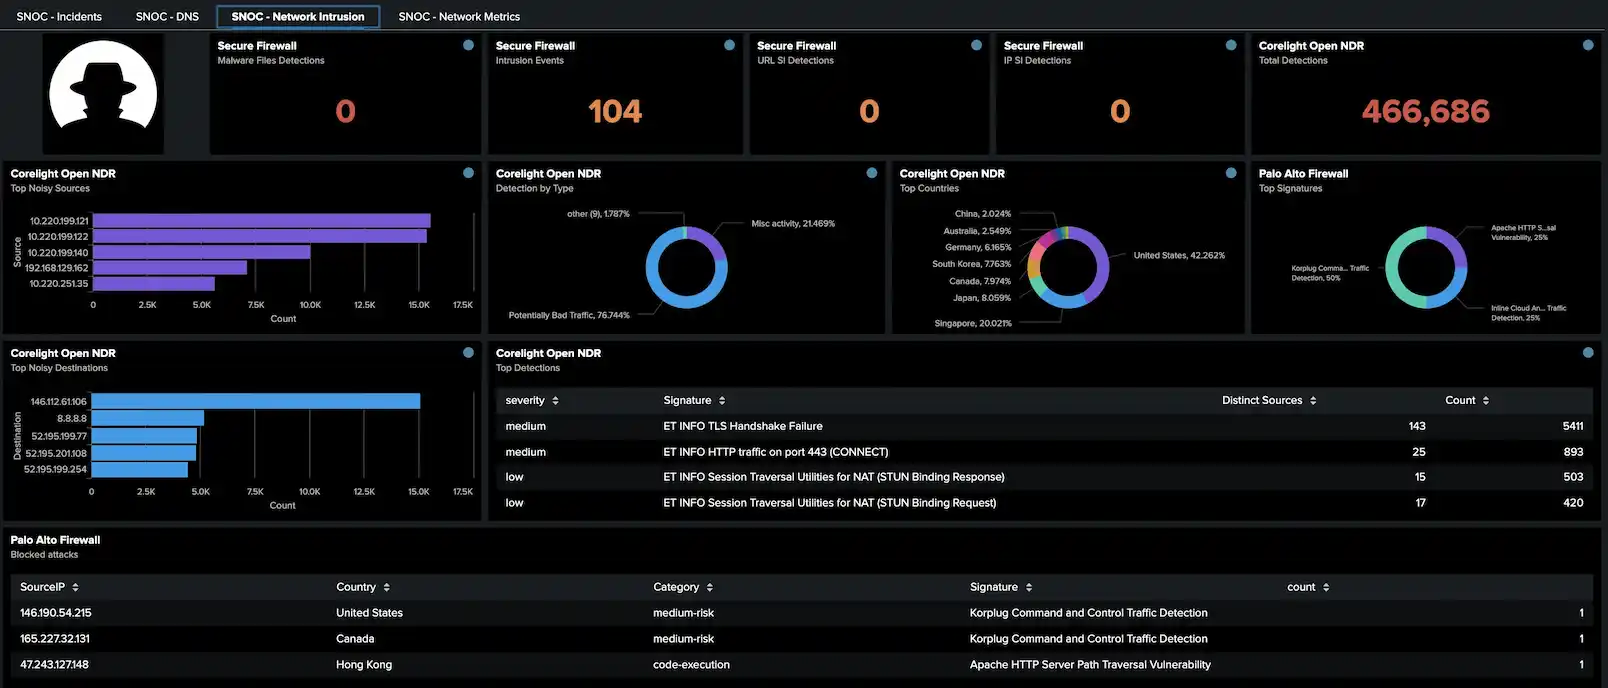
4. Network Metrics
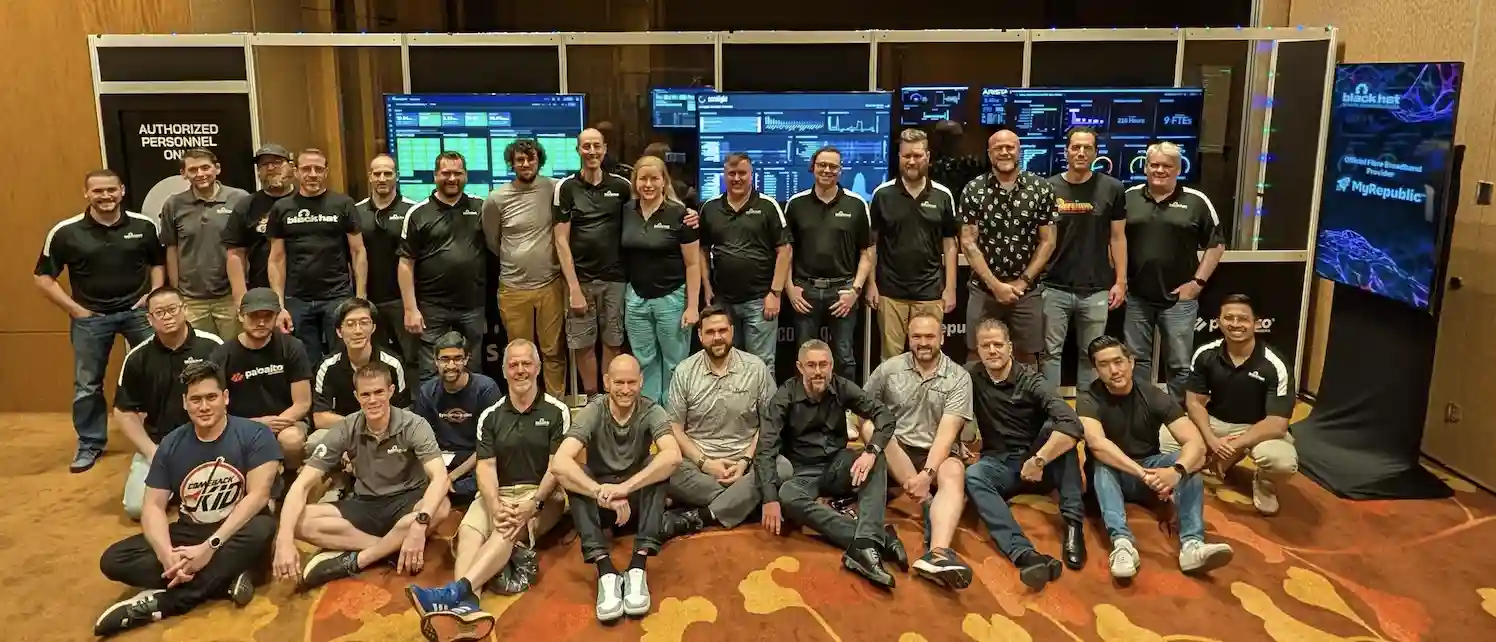
With the charter for us at Black Hat being a ‘SOC within a NOC’, the executive dashboards were reflective of bringing networking and security reporting together. This is quite powerful and will be expanded in future Black Hat events, to add more functionality and expand its usage as one of the primary consoles for our threat hunters as well as reporting dashboards on the large screens in the NOC.
Want to learn more about what we saw at Black Hat Asia 2025? Check out our main blog post — Black Hat Asia 2025: Innovation in the SOC — and the rest of our Black Hat Asia 2025 blog content.
Acknowledgements
Thank you to the Cisco NOC team:
- Cisco Security: Christian Clasen, Shaun Coulter, Aditya Raghavan, Justin Murphy, Ivan Berlinson, and Ryan Maclennan
- Meraki Systems Manager: Paul Fidler, with Connor Loughlin supporting
- ThousandEyes: Shimei Cridlig and Patrick Yong
- Additional Support and Expertise: Tony Iaconbelli and Adi Sankar
Also, to our NOC partners Palo Alto Networks (especially James Holland and Jason Reverri), Corelight (especially Mark Overholser and Eldon Koyle), Arista Networks (especially Jonathan Smith), MyRepublic and the entire Black Hat / Informa Tech staff (especially Grifter ‘Neil Wyler’, Bart Stump, Steve Fink, James Pope, Michael Spicer, Jess Jung and Steve Oldenbourg).
About Black Hat
Black Hat is the cybersecurity industry’s most established and in-depth security event series. Founded in 1997, these annual, multi-day events provide attendees with the latest in cybersecurity research, development, and trends. Driven by the needs of the community, Black Hat events showcase content directly from the community through Briefings presentations, Trainings courses, Summits, and more. As the event series where all career levels and academic disciplines convene to collaborate, network, and discuss the cybersecurity topics that matter most to them, attendees can find Black Hat events in the United States, Canada, Europe, Middle East and Africa, and Asia.
For more information, please visit the Black Hat website.
We’d love to hear what you think! Ask a question, comment below, and stay connected with Cisco Security on social media.
Cisco Security Social Channels