It’s 8:07 a.m. and your day as a network administrator is already escalating. The London HQ reports intermittent wireless drops in conference rooms. Following a scheduled maintenance window, a campus in Santa Clara shows degraded switch health. A fast-growing business unit in Sydney flags application performance issues affecting remote users.
Three regions, different issues, and multiple Catalyst Center instances. Before you can troubleshoot, you ask yourself, what’s actually broken, and where?
Cisco Catalyst Center Global Manager (CCGM) is designed to eliminate this operational complexity. It provides a centralized operations layer across connected Catalyst Centers, unifying network health, alerts, sites, devices, and clients into a single view. With massive telemetry data, built-in filtering, noise reduction, and global search, CCGM helps automate the discovery and health correlation process—freeing network operations teams from manual data gathering and making troubleshooting a breeze. You can quickly narrow down what’s impacted and seamlessly pivot into the corresponding Catalyst Center for detailed root-cause analysis and remediation.
Here are five actions you can take using CCGM to cut through complexity in real-world operations.
Tip 1: Instantly locate any device or client
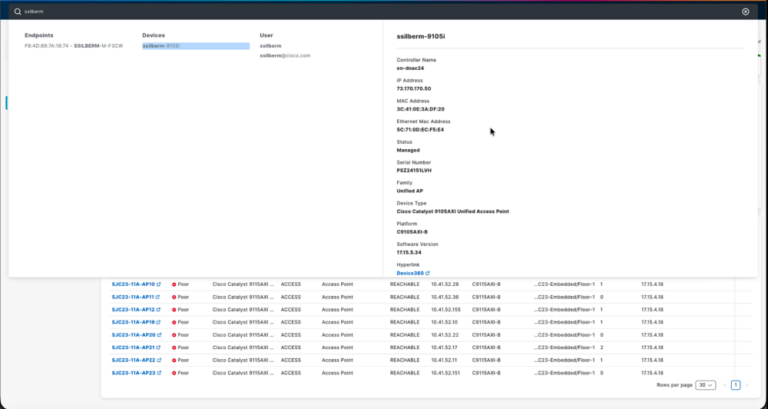
Global Search in CCGM is built to eliminate time spent hunting across multiple Catalyst Center instances.
How it works: You can search by hostname, IP address, MAC address, serial number, or software version for any switch, router, wireless LAN controller (WLC), access point, or wired and wireless client managed by any connected Catalyst Center instance. CCGM will return the best match along with a direct Device 360 or Client 360 link.
Why it matters: Instant access to actionable insights reduces downtime and saves valuable IT resources. With one click, network admins can cross-launch into the specific Catalyst Center instance where that device or client is hosted and continue deeper troubleshooting. You can also search by site name or application name to quickly pull up site or application context and drill into the details without manually navigating through multiple dashboards.
Tip 2: Get visibility for a specific site
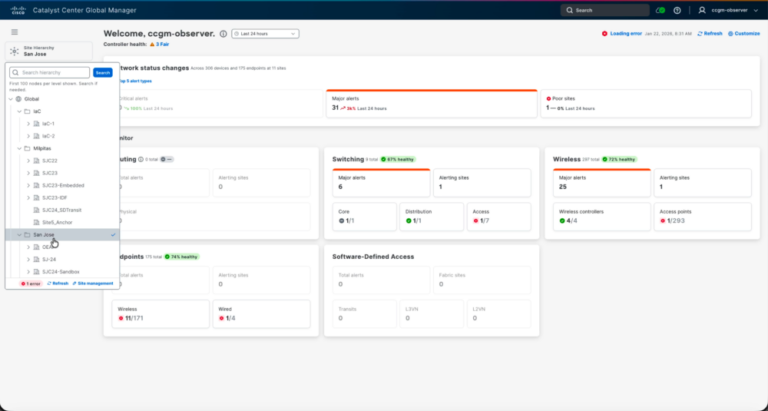
CCGM makes it easy to focus on exactly the sites you are responsible for, even when sites are distributed across multiple Catalyst Center instances.
How it works: On the CCGM overview page, the left-side site hierarchy provides a consolidated view of all sites collected from connected Catalyst Center instances. Built-in role-based access control (RBAC) ensures users only see sites they are authorized to access.
Why it matters: For network operations center (NOC) teams or site-specific network admins, this is especially powerful because selecting a single site in the hierarchy automatically scopes the entire global overview experience to that location, updating alerts, health, and device views to show only what is relevant for that site.
Tip 3: Quickly find devices and clients in poor/critical health
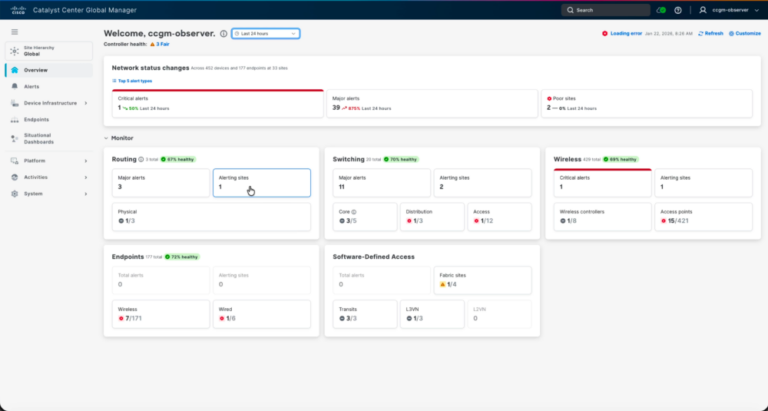
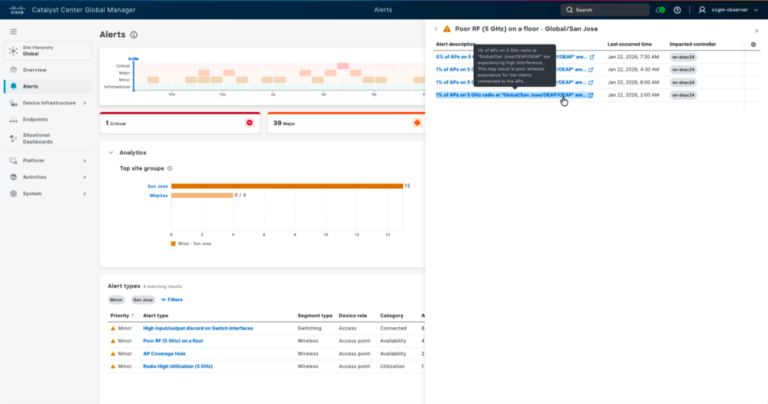
CCGM helps operations teams quickly zero in on what needs attention by surfacing devices and clients that are in poor or critical health across the environment.
How it works: Instead of combing through multiple dashboards, admins can filter health views to immediately see which network devices and endpoints are degraded, understand the severity and scope of impact, and prioritize remediation based on what is impacting users the most.
Why it matters: The massive scale of Catalyst Center telemetry data enables proactive operations because it highlights problems early. By correlating client impact to upstream infrastructure health, you can prioritize remediation based on what is affecting users the most, speeding up triage significantly.
Tip 4: Cross-launch to the right Catalyst Center with SSO
CCGM simplifies troubleshooting workflows by enabling cross-launch into the correct Catalyst Center instance with single sign-on (SSO).
How it works: When SSO is configured and your user account exists in the target Catalyst Center instance, you can open a device, client, or alert from CCGM and jump directly into the correct Catalyst Center context without re-entering credentials.
Why it matters: This removes friction for NOC and network admins operating at scale while maintaining secure access. CCGM automatically maps which Catalyst Center instance owns this device, client, or alert, while the deep, detailed troubleshooting remains in Catalyst Center where the full set of workflows and insights reside.
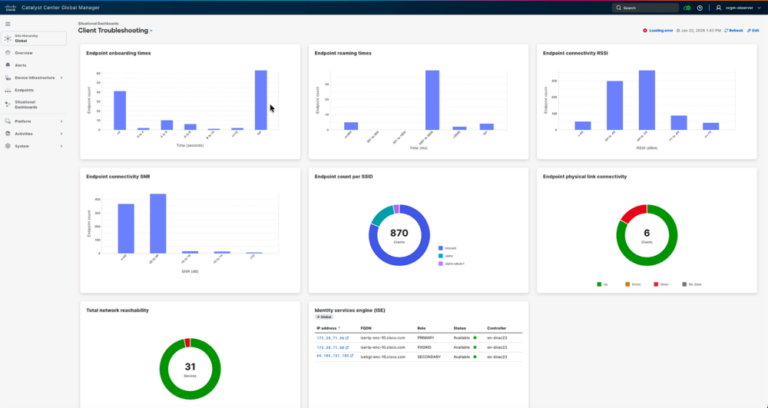
Tip 5: Create your own dashboard with Situational Dashboard
The Situational Dashboard in CCGM lets you create a personalized troubleshooting workspace by combining the specific dashlets you care about into a single, reusable view.
How it works: Instead of jumping between multiple pages for clients, applications, device health, or network services (like AAA, DNS, and DHCP), you can build a dashboard that matches your operational role and workflow, then customize it as needs evolve.
Why it matters: You no longer need to jump between pages. This makes it easier for NOC and network admins to monitor the right signals, accelerate triage, and keep a consistent “single pane” view for day-to-day operations. You can add 15 dashlets per dashboard and create as many dashboards as you like.
A complete view that cuts through complexity
When alerts start rolling in from London, Santa Clara, and Sydney, your team needs clarity, not more dashboards to sort through.
Catalyst Center Global Manager brings together the key signals teams need to run large, distributed networks with confidence. It unifies global visibility across multiple Catalyst Center instances, flexibly scoping down to single-site, health-based triage for on-premises devices and clients.
As your environment grows, CCGM becomes a practical operations hub that helps reduce noise, speed up response, and scale network management.
Watch a demo of how to deploy Catalyst Center Global Manager