Universidad EAFIT was at a pivotal network point. Faculty wanted the ability to use new, and more demanding applications including video content. Pervasive wireless access had become a necessity for an enriched student experience. EAFIT took this opportunity to refresh the network to empower educators to innovate, to connect students academically and socially, as well as to better IT’s agility.
As one of the most prestigious educational institutions in Colombia, Universidad EAFIT is one of the first universities to receive the Ministry of National Education’s Institutional High Quality Accreditation twice in a row.
Given the rapid growth at Universidad EAFIT, Wi-Fi usage increased, causing wireless availability to drop below 85 percent. To improve the performance, security and manageability of their network, Universidad EAFIT partnered with Cisco to implement an end-to-end Cisco® solution for converged wired and wireless access.
It’s that time of the year where pundits from the cable and broadband industry gather at SCTE Cable-Tec Expo 2016. This year we will be in the historic and largest city in the Commonwealth of Pennsylvania, Philadelphia. While many of us are looking forward Philly Cheesesteaks, we are also looking forward to hearing and sharing best practices, trends in broadband and pay TV, business and technology challenges and the latest innovative products and solutions to address those challenges.
At this year’s event we will show how our cable access strategy can empower service providers to deliver new services faster, and transform experiences with a network that is more agile and elastic for the future. We have several event activities including demonstrations for video, cable access, optical, and services. Cisco subject matter experts will also participate in eight workshops covering key trends such as DOCSIS 3.1, Software Defined Networking (SDN), Network Functions Virtualization (NFV) and the Internet of Things (IoT).
We are also sponsoring the IP Challenge on Monday, September 26 at 5:30 p.m. ET. The IP virtual qualifiers took place in June and July, and now the eight highest scoring participants will face off to be this year’s IP champion.
Speaking of IP—with the industry increasingly transitioning to “all-IP (Internet protocol)”, it’s no surprise that IP traffic is on the rise. According to Cisco’s latest VNI report, IP video traffic is expected to drive 82 percent by 2020. Also on the rise is the Internet of Things (IoT), an array of devices, machines, and sensors that will be connected to the Internet. We expect 50 billion devices will be connected to the Internet by 2020. With this growth, we anticipate operators will need Gigabit speeds and an IP network that is more agile, elastic and virtualized. As service providers shift to a more virtualized infrastructure, technologies such as SDN and NFV will be essential.
It’s with these key trends in mind that Cisco experts will share insights to service providers on the future of these technologies, how to deploy them and the opportunities they can offer. While this year’s event workshops offer a plethora of informative sessions, we welcome you to attend a few of the sessions we are participating in including:
As a Service with SDN/NFV
Deploying SDN/NFV
The Internet of Things (IoTs) Impact and Opportunity for MSOs
Maintenance and Testing in an SDN World
Beyond “DOCSIS 3.1: FDX and More
Early DOCSIS 3.1 Deployments
And several more….
We have a great line-up of speakers including:
John Chapman, Cisco fellow and CTO, Cable Access, Chief Technology and Architecture Office (CTAO)
Toerless Eckert, principal engineer
Ben Bekele, Sr. Manager, Business & Technology Architecture Manager
Amit Singh, Principal Engineer, Chief Technology & Architecture Office (CTAO)
John Holobinko, Director of Strategy, Cable Access Networks
and more.
On the demos front, Cisco will feature Infinite Video Platform, a cloud video entertainment solution that can help deliver live, linear, on-demand, and over-the-top TV services to multiple screens; cBR-8 converged broadband router, the industry’s first integrated CCAP product designed for DOCSIS 3.1; Virtualized Video Processing “V2P” solution, which enhances business agility by reducing the complexity of video workflow operations; and so much more.
Don’t miss all of our activities at the show. Come by and visit us at booth #648. Follow hashtags, #SCTE, #CableTecExpo & #IPChallenge on Twitter and tweet us @CiscoSPVideo if you have any questions or comments. See you in Philadelphia!
I know, I know – It’s a topic that’s been kicked around for years. However machine builders, OEM’s, and even end users continue to put unmanaged switches in applications where a managed switch is clearly a better choice. Helping guarantee your machine performs its best, has maximum uptime, and doesn’t pose a security risk to your customers justifies using a managed switch.
For many Machine Builders and OEMs, cost is the primary driver for their machine designs and component selection. As a result, many of these suppliers still use cheap, unmanaged switches on their equipment.
Disadvantage #1 – Open ports on unmanaged switches are a security risk
Imagine a contractor from another vendor or an unknowing employee connecting their PC to open ports on an unmanaged switch, spreading a virus, and wreaking havoc on the IACS and the network. Managed switches have port security with the ability to disable ports and prevent unauthorized access. How can you argue against this simple and effective security precaution?
Disadvantage #2 – No resiliency = higher downtime
Another important feature of a managed switch is redundancy. Redundancy provides the ability to safeguard a network in case a connection or cable fails by providing an alternate data path for traffic. Standard protocols prevent loops and establish the redundant links as a backup to keep integrated systems available. This can ultimately prevent expensive downtime, which any user can appreciate.
Managed switches give you the ability to prioritize Local Area Network (LAN) traffic to ensure that the most important information gets through, while an unmanaged switch simply allows Ethernet devices to communicate with one another, such as a PC or network printer. One function of a managed switch called “Quality of Service” allows you to prioritize your network traffic by assigning a higher priority to critical traffic. This helps ensure consistent network performance for critical control functions on your machines.
In short, this can prevent other network traffic from making your machine malfunction – which can cause downtime for users, a service call to your service department, and a bad user perception of your machine performance.
A Virtual Local Area Network or VLAN is a domain that is partitioned and isolated in a computer network. VLANs allow a switch to logically group devices together to isolate traffic between these groups even when other traffic is passing over the same physical switch.
The segmentation and isolation of network traffic helps reduce unnecessary traffic in key areas. For example, you can segment traffic between machine groups so that critical control information can flow without delay from machine to machine and not get bogged down by other traffic. This allows better network performance and in many cases provides an additional level of security.
Disadvantage #5 – Unmanaged switches have limited or no tools for monitoring network activity or performance
Managed switches use protocols such as the Simple Network Management Protocol, or SNMP for monitoring the devices on the network. SNMP queries can determine the health of the network or the status of a particular device. By displaying this data in an easily understood format, users can monitor the performance of the network and quickly detect and repair network problems, even doing so remotely.
Managed switches also allow port mirroring. This copies the switch network traffic and forwards it to a single port on the same switch for analysis. You can then use a network analyzer on a monitor port to troubleshoot network problems by examining traffic on other ports or segments. This allows you to troubleshoot problems without taking your machines out of service which maximizes uptime for your users.
The Bottom Line
For end users, having some network visibility and control can be highly valued in their plants and they are willing to pay for it. Managed switch functionality can allow Machine Builders to differentiate their machines from competitors, command a higher premium, and ultimately lower their users total cost of ownership.
Ask yourself this, “If I could avoid just one downtime incident for my users or speed the troubleshooting of a down machine, what would that be worth in dollars?”
I’d argue that the incremental cost difference of a managed switch would be far less than even a single downtime incident!
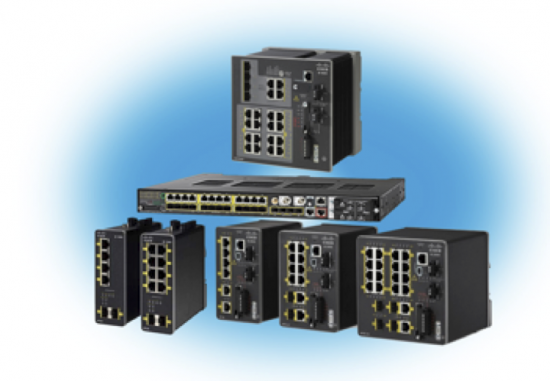
If the cost of a fully managed switch is still considered prohibitive, a “Lightly Managed” switch like the Cisco IE1000 may be a good choice. Lightly managed switches can offer a subset of fully managed switch functionality at a reasonable price. If you don’t have IT support in your organization or are not familiar with IT tools like command line interface, lightly managed switches are also easily configured and commissioned. As a result, integrating a lightly managed switch in your machine architectures can be easily accomplished.
Put managed switches on your machines… It’s a “manageable” incremental cost!
This post was authored by Veronica Valeros, Petr Somol, Martin Rehak and Martin Grill, on behalf of the whole CTA team.
Some of us still intuitively believe that our extensively safeguarded corporate networks are safe from the risks we are exposed to when connecting directly to public Internet. Yet, evidence suggests that most companies now operate with significant persistent malware present in the network. At the same time, malware has also evolved, and we have witnessed a larger proportion of infections being brief with relatively low risk. But, even the seemingly low risk infections may open a pathway or potentially escalate into full-fledged attacks with serious business impact.
Accordingly, our mindset and the framework of our reasoning about malware needs to change. Most of the adware, malicious JavaScript in the browser, toolbars and hijacking browser plugins do not care about the network they run on. As bottom-feeders of the Internet, they monetize the internet presence and user activity, but don’t care about the data on the host – until the moment they realize that they have, however accidentally, infected a high-value asset and re-sell the presence to the highest bidder for privilege escalation and targeted attacks.
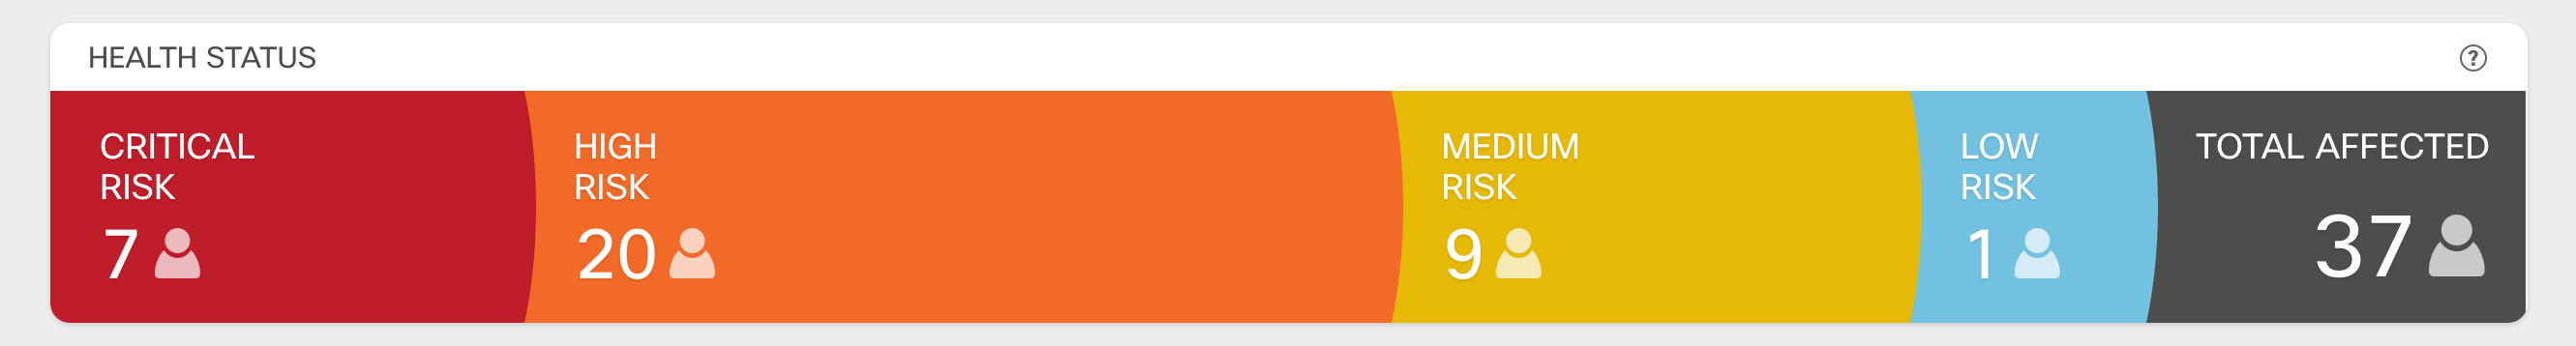
Figure 1 – Cognitive Threat Analytics Health Status Dashboard
The problem of discovering attackers present in the network has therefore significantly changed. It has become rather simple to detect something malicious in the network. Today the challenge is to find the malicious network traffic that matters. This is why we built Cognitive Threat Analytics (CTA). CTA is a cloud-based breach detection service specialised in detecting threats that have already bypassed the security perimeter. We have been working very hard on prioritization and segmentation of attacks between categories according to their estimated business impact. CTA uses state-of-the-art machine learning techniques to discover the full spectrum of attacks and to monitor potential escalations when infections become more persistent or more dangerous. Continuing our promise of promoting transparency in the advanced threat research field [1], in this post we look under the hood of CTA and explain its building blocks.
CTA Detection Chain
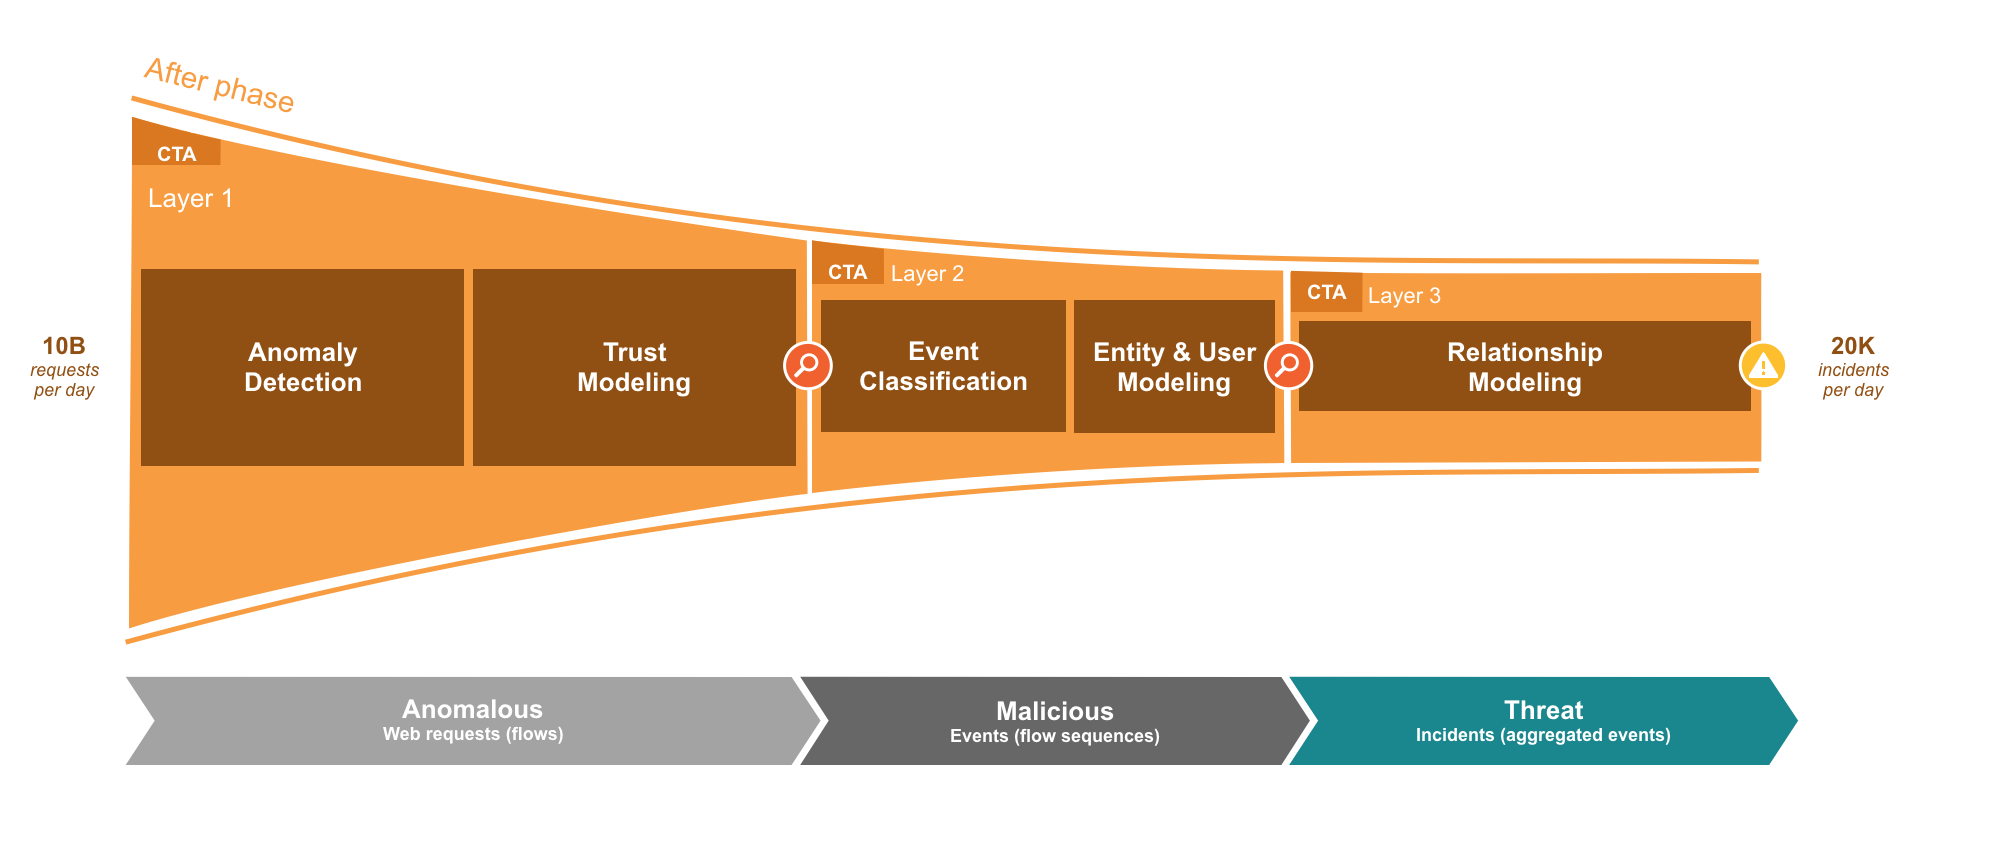
CTA consumes web access logs from web proxies, including Cisco Cloud Web Security (CWS), Cisco Web Security Appliance (WSA), and BlueCoat ProxySG. CTA processes more than 10 billion web requests daily. Through a layered approach of different machine learning techniques, CTA is able to discard 99% of the input traffic, keeping only the traffic that represents a security risk. At a high level, CTA is composed of three layers: (1) Anomaly Detection & Trust Modeling, (2) Event Classification, Entity & User Modeling, and (3) Relationship Modeling [see Figure 2]. As we will explore below, each layer is able to keep the most significant anomalous traffic and hand it over to the next layer for deeper inspection.
Figure 2 – CTA is composed of three layers. The first layer consumes large amounts of data and only keeps 1% of the most anomalous traffic. The second layer classifies the traffic in behaviors and groups anomalous behaviors by hosts. The third layer correlates known threats using our global intelligence, revealing malicious campaigns and providing information that is later presented as Confirmed Threats in the CTA portal.
Layer 1: Anomaly Detection & Trust Modeling
The first layer of CTA consumes a large amount of network telemetry data, selects the most anomalous traffic and hands it over to the second layer. This layer has two stages, Anomaly Detection and Trust Modeling. The Anomaly Detection stage is composed of more than 40 individual network anomaly detectors, each designed to detect a specific type of anomalous behavior that can be related to some malicious activity. Each detector maintains a model of a normal network behavior and assigns high anomaly score to all the network observations that deviate from the model. The individual anomaly detectors are used in groups known as ensembles. An individual ensemble may use either a static or machine learned combination of the detectors. The static combinations provide a good generalization whereas the learned combinations boost the efficacy of the system on known malicious behaviors. The Trust Modeling stage acts like a long-term memory, eliminating noise in anomaly detector verdicts caused by the normal fluctuations in network traffic. This approach greatly reduces the number of false positives introduced by the anomaly detection. In this layer CTA discards 99% of the traffic, letting only highly anomalous traffic (~1%) through to next layer for further processing [2] [3] [4].
Layer 2: Event Classification, Entity & User Modeling
The second layer of CTA aims at explaining the highly anomalous traffic detected in the first layer. This layer has two stages, Event Classification and Entity & User Modeling. The Event Classification stage is composed of more than a hundred individual classifiers. A multitude of original Machine Learning techniques is employed including the high-precision Neyman-Pearson based linear models, as well as Multiple-Instance-Learning based Support Vector Machines, Neural Networks and Random Forests [5]. Each classifier is trained to recognize specific types of anomalous and malicious traffic, from software updates to exfiltration behavior and command and control communication. Classifiers are able to highlight specific indicators of compromise in a network with consistent precision in the range 90-100%. The Entity & User Modeling stage ties anomalous traffic to events associated to single hosts. When enough events are collected for a single host, they are aggregated into incidents and an alert is generated for that host [6] [7] [8].
Layer 3: Relationship Modeling
The third layer is in charge of the Relationship Modeling of incidents. This layer uses information about the incidents generated by the previous layer and correlates that information across our global intelligence in order to find common attack patterns and malware behaviors in different organizations. Thanks to this layer, CTA is able to present additional intelligence about threat presence across fields, such as how many other organizations have seen it. This knowledge is extremely useful for organizations to evaluate if they are victims of targeted campaigns or opportunistic attacks.
CTA incidents are presented in two categories: Confirmed Threats and Detected Threats. Confirmed Threats are presented with 99-100% confidence, and are tied to specific malware types that have been identified as part of farther-reaching malicious campaign. For these threats CTA provides detailed threat-specific information to reduce the time a customer-side analyst spends investigating, and speeds the remediation efforts. Detected Threats are anomalous incidents identified as specific for an organization. Less prevalent threats including Zero-Day attacks usually fall in this category. Investigation effort should be put on analyzing Detected Threats in order not to miss hard-to-identify and newly emerging threats. [9]
CTA Provides Threat Specific Intelligence
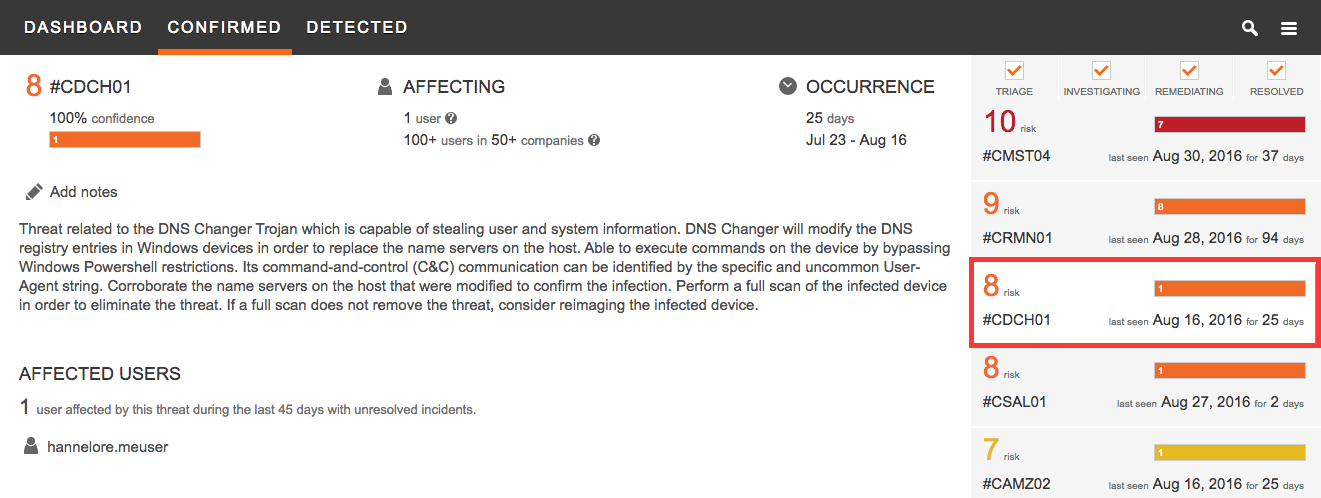
Thanks relationship modeling, CTA provides more than just incidents, it provides threat specific intelligence and uses this intelligence do derive risk scores. Every Confirmed Threat report communicates to the analyst all the information available regarding the malware infection. This allows the analyst to quickly confirm the risk assessment, estimate the damage, prioritize remediation and conduct a quick mitigation (see Figure 3).
Figure 3 – CTA Threat Specific Information on DNSChanger Malware.
Infection History and Network Traffic Indicators
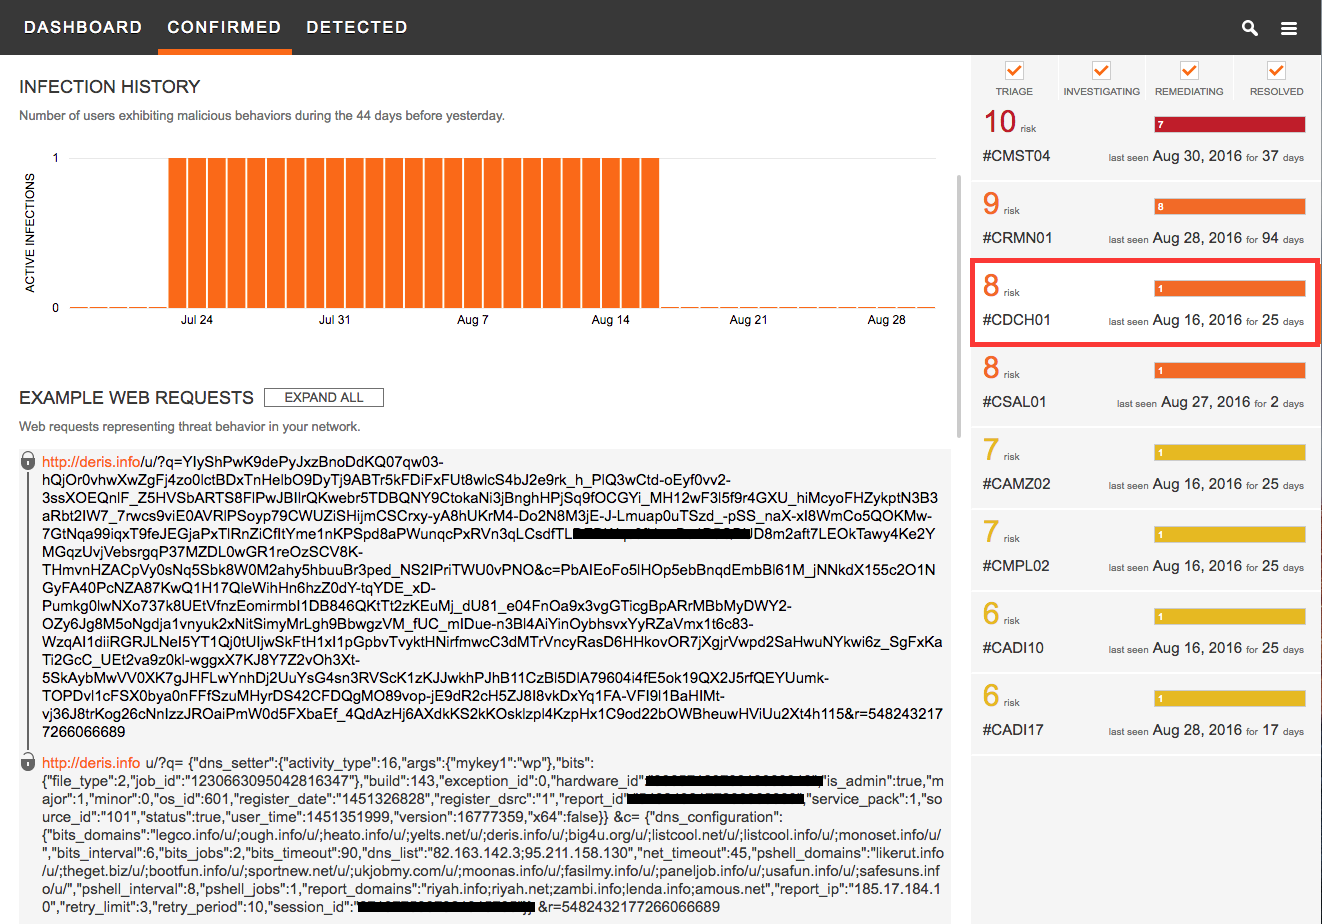
CTA provides an infection timeline for each threat infection in the organization. The information about how long a user has been infected with a specific malware is critical to estimate the potential damage the threat may have caused, to organize a containment strategy and to prioritize the mitigation [see Figure 4].
Figure 4 – CTA Infection History and Example of Network Indicators per Threat Campaign.
Network investigators may also need information about what the traffic of this particular threat like, to be able to improve their detection mechanisms and be able to stop these threats faster. For that purpose, CTA provides examples of the network traffic communication the threat is presenting on their network. Its embedded automatic decoder capability allows analysts to quickly look through encoded URLs and understand what information the threat is sending out [see Figure 4].
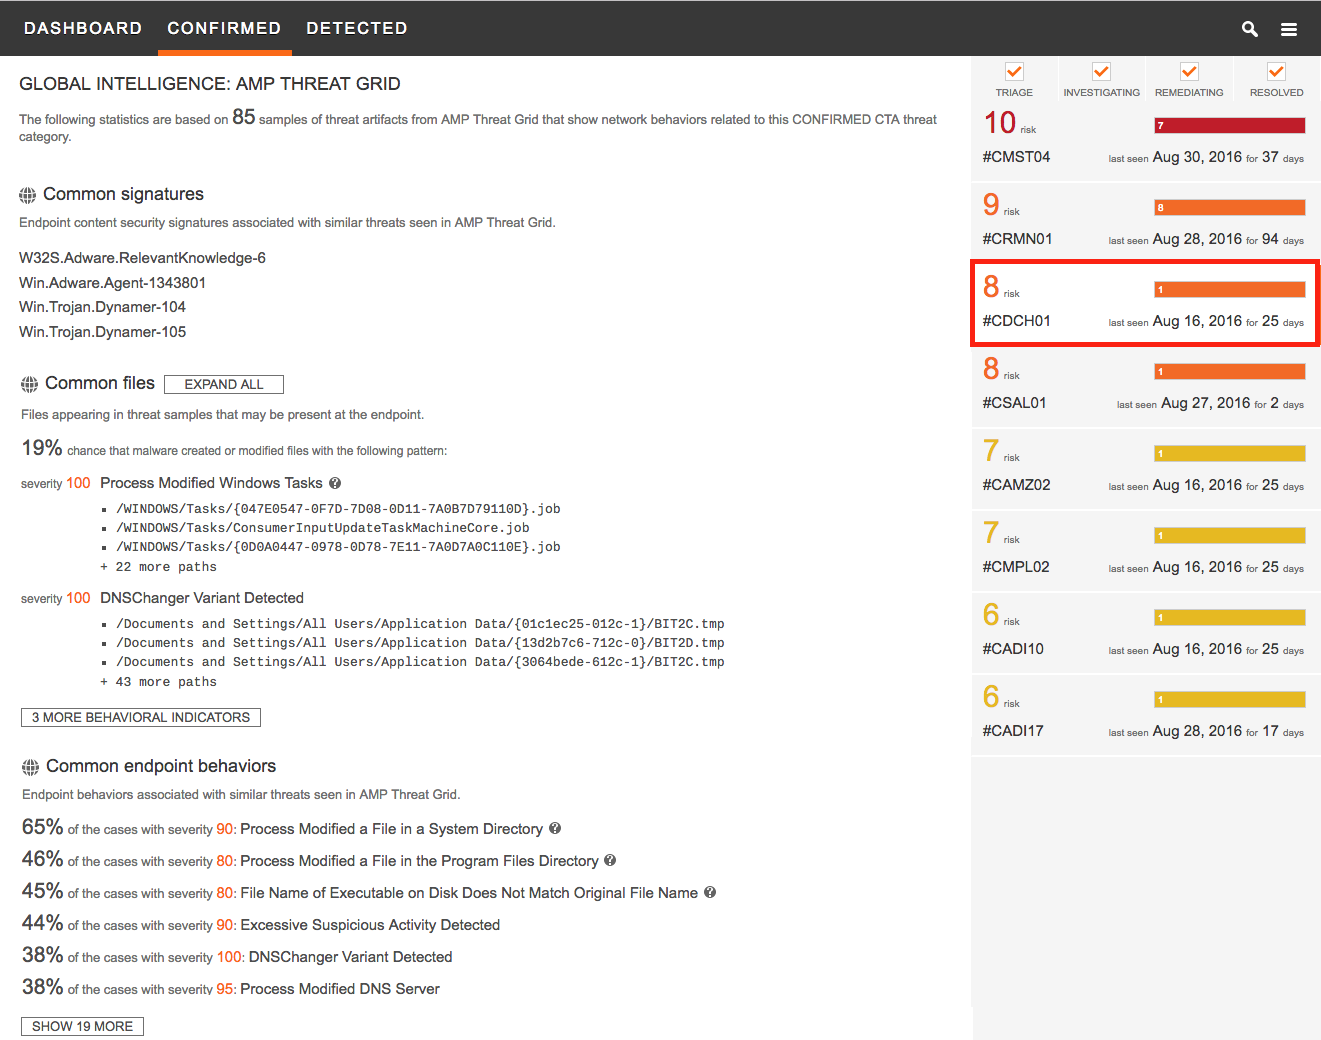
Integration with AMP Threat Grid
CTA integration with Cisco Advanced Malware Protection (AMP) Threat Grid connects the network traffic intelligence with the sandbox results, modeling relationships between different malware binaries, families and network behaviors. CTA uses this information to provide the specific files and artifacts that incident responders should look for on the infected hosts without needing direct access to the endpoint [Figure 5]. This information is used to confirm the infections in the endpoints, and to understand the technical aspects of the threat.
Figure 5 – CTA and AMP Threat Grid Integration provides specific indicators on the host level.
Your Security at a Glance
CTA output has been adapted to the world where the malware infections are a rule, rather than an exception. CTA organizes the alerts into four categories by estimating the likely business impact of each incident. The business impact is estimated by relationship modeling and learning the associations between command & control infrastructure, individual incidents and malware samples executed in AMP Threat Grid and other intelligence sources. This allows us to identify the individual botnet or malware operations, discern their versions and generations, and to infer the business models they use to achieve profit . As a result, we can predict possible escalation patterns and highlight the situations where even a trivial adware infection creates a major security issue. [10]
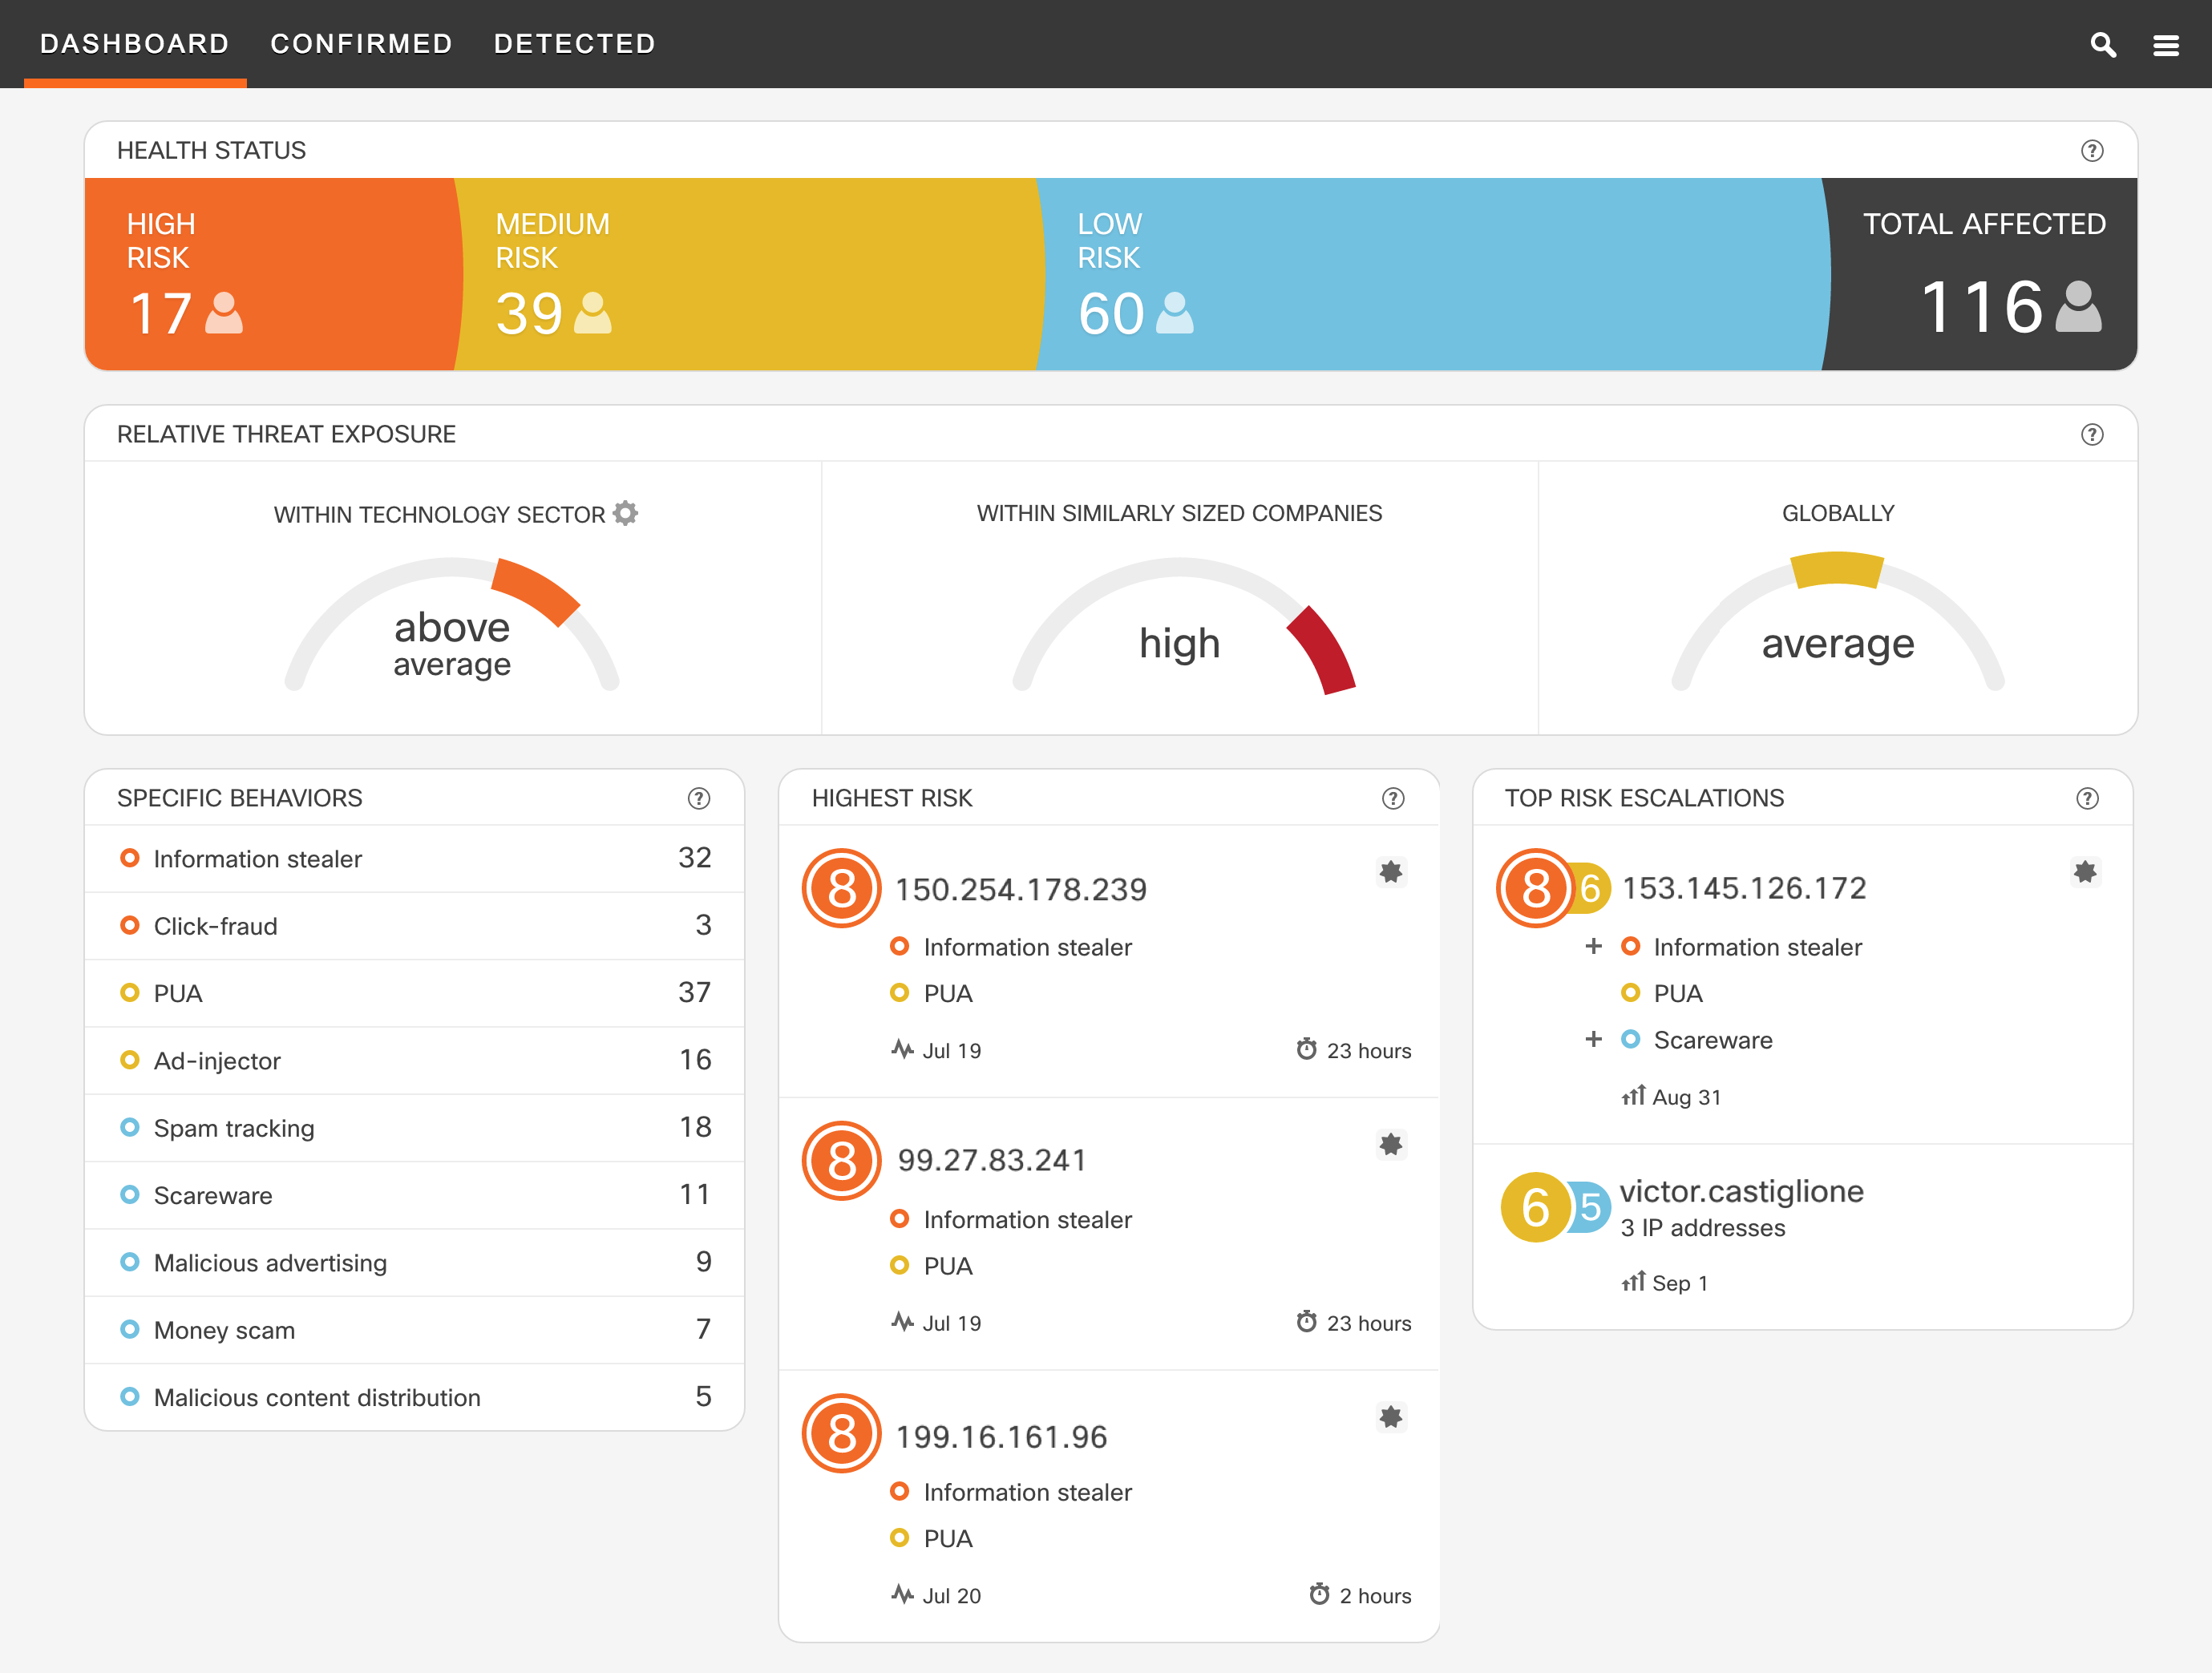
With organizations just like yours being attacked every day, it is vital to know what the state of security looks like at a given time in your organization. CTA dashboards are designed for that [see Figure 6].
Figure 6 – CTA Dashboards summarizes the state of security in your organization.
We’ve recently designed an overview dashboard, and streamlined it to provide the following critical information at a glance:
Health Status
Relative Threat Exposure
Key Information on Behaviors and Users
Each component provides the information needed to communicate the state of security to stakeholders and start organizing a remediation strategy.
The Health Status shows the total number of affected users and most importantly, how many of those users are affected by high risk threats and require immediate remediation. The Relative Threat Exposure provides information about how is the organization positioned with respect to others from a security perspective. This information provides guidance for driving organizational improvements in security and improving remediation methodologies in place. The dashboard also includes a brief summary of the specific behaviors observed in the network, the highest risk incidents that may require immediate action, and the top risk escalations. [11]
[2] Grill, M., Pevný, T., & Rehak, M. (2016). Reducing false positives of network anomaly detection by local adaptive multivariate smoothing. Journal of Computer and System Sciences. http://dx.doi.org/10.1016/j.jcss.2016.03.007
[6] Bartos, K., Softka, M., & Franc, V. (2016, August). Optimized invariant representation of network traffic for detecting unseen malware variants. In 25th USENIX Security Symposium, forthcoming.
[7] Bartos, K., & Sofka, M. (2015, September). Robust representation for domain adaptation in network security. In Joint European Conference on Machine Learning and Knowledge Discovery in Databases (pp. 116-132). Springer International Publishing. http://dx.doi.org/10.1007/978-3-319-23461-8_8
[8] Franc, V., Sofka, M., & Bartos, K. (2015, September). Learning detector of malicious network traffic from weak labels. In Joint European Conference on Machine Learning and Knowledge Discovery in Databases (pp. 85-99). Springer International Publishing. http://dx.doi.org/10.1007/978-3-319-23461-8_6
[9] Jusko, J., Stiborek, J., Kohout, J., Rehak, M., & Pevný, T. (2016). Social Threat Propagation. IEEE Intelligent Systems. Accepted for publication in 2016.
Written by Gideon Gilboa, Director of Marketing, Service Provider Video
There’s been a lot of noise recently about the impact of cloud on the pay TV business.
If you attended IBC in Amsterdam last week, you will no doubt have heard buzz words like cloud, SaaS, DevOps and virtualization from all vendors. But let’s go beyond the hype for a moment and ask ourselves a candid question:
Is ‘the cloud’, and all the technologies, consumption models and applications associated with it, really the key to future business success for video service providers?
Everyone would answer with an enthusiastic “Yes! But can they really explain how they know that?
Let me share with you how I know.
Over the last six months, we have teamed with an independent financial research firm to answer that exact question. We wanted to get an in-depth understanding of the levers that drive our customers’ balance sheets so that we can determine if “cloud video” really is the answer.
They interviewed more than 25 service providers, as well as programmers, vendors and other new entrants. Six thousand rows of Excel later, and we had in our hands the most detailed financial model I have ever seen, covering the current business and balance sheets of video service providers (SPs).
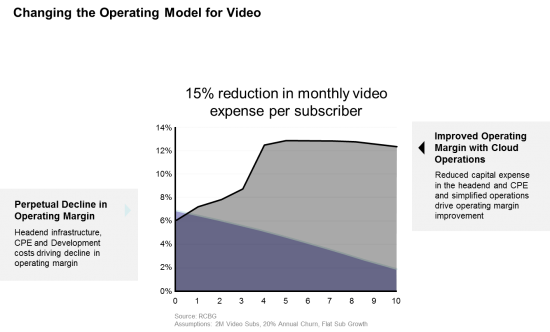
Looking at the model was, at first, a satisfying moment. But once we started running the numbers, we discovered the following painful reality: With the current mode of operation—that includes fragmented operational environments (for delivering broadcast, on-demand, TVE services), increasing costs and saturated markets—the video SPs operating margin is, and will continue to decline over the next 10 years to the single digit range.
That’s why, at IBC this year, we unveiled Infinite Video Platform – our cloud services platform that helps operators and broadcasters to process, secure, distribute and, most importantly, monetize video on any consumer device.
We literally took everything we know about this platform from current customer deployments, and we overlaid this data on our original financial model.
And here’s the big news…
There was a change in trend from a declining operating margin to an increasing operating margin. A15% reduction in per subscriber costs, per month.
So how did we do it?
We combined cloud video processing with our world class SaaS operations to reduce operating expense significantly and almost eliminated it for regional head-ends.
We significantly cut development costs by maintaining a proactive roadmap, implementing flat licensing, and continuously delivering new features with no or low impact on the live system.
We enabled more consumer devices and services with our Infinite Video Platform to significantly reduce CPE cost while opening up new revenue streams.
Finally, there was our ability to integrate Infinite Video Platform into an existing system, making it live in harmony with the legacy environment and serve both IP and broadcast devices.
That really made the difference.
So YES, deploying a cloud video services platform, such as our own Infinite Video Platform, can make video SPs more competitive than before. It helps them make their operating model for video more profitable while delivering the best video experience to consumers.
But cloud hype isn’t enough.
One needs to truly understand the service provider’s specific pain points and then design the platform around them. That’s what we do with the Infinite Video Platform.
If you want more details about our detailed research and the Infinite Video Platform, don’t hesitate to contact us.
Service providers, you have a problem. Although much of the infrastructure in your optical transport networks continues to function, major challenges within your legacy SONET/SDH network architecture have become a significant barrier to growth.
Your existing SONET/SDH networks can’t scale to meet the demands of Ethernet and IP multimedia traffic as well as bandwidth-intensive apps and services. In addition, many of your SONET/SDH networks are operating at near maximum capacity and legacy devices, including the aging cross-connects, are not only experiencing higher failure rates they are also approaching their end of life. Spares to fix them are hard to obtain and the high cost to maintain SONET/SDH networks due to space, power, and cooling costs contribute to higher opex.
It’s time to modernize your network and you need a transport network modernization strategy that lowers TCO while meeting next-generation requirements for efficiency, speed, scalability, and performance.
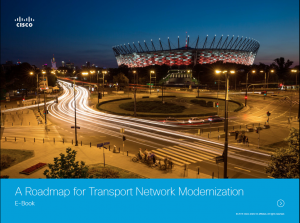
In our recently published E-Book, A Roadmap for Transport Network Modernization, we discuss the challenges service providers face with modernizing their legacy SONET/SDH networks. The E-Book is comprehensive; we cover a range of topics and we address the concerns across your organization – from the CXO to the transport network engineer to the IP network architect and finally to the OSS and NOC managers. We examine both the business and technology requirements of transport networks today and into the next decade. Although the ultimate goal in a modernization project is to transition to an all-packet network, most of you need to maintain the revenue stream provided by your existing TDM services. Therefore we present a thorough evaluation of the technology options that support both legacy TDM services together with IP services.
We conclude the E-Book with a look at the Cisco transport modernization solution. We’ll show you how our next-generation approach, using Cisco’s high-density circuit-emulation (CEM) technology, provides you with a cost-effective network modernization path, while still supporting ongoing TDM services requirements. Built on an IP/MPLS core, our next-generation transport network becomes predictable and deterministic, while still providing SONET/SDH-like features, such as OAM and manageability along with sub-50ms resiliency. Supported by industry standards, our solution is also invisible to end customers, with no new customer premise equipment required.
You get exactly what you need today to modernize, scale, trim OpEx and optimize CapEx, and future-ready your transport network. Best of all, our solution lets you evolve towards metro Ethernet, Layer 3 VPNs, and full IP transport whenever you’re ready.
Are you ready to modernize your network? Find out how with A Roadmap for Transport Network Modernization.
Penang, Malaysia. A beautiful city and an exciting opportunity for the whole Human Resources team in the Asia Pacific, Japan and China regions to come together to learn from each other, grow together and volunteer together.
And I had to miss it.
While the rest of my team was going to be bonding and participating, I was going to be sitting at home nursing wounds, literal and figurative. I had to take care of some medical issues with a pretty major back surgery, but I was gutted that I’d have to miss the offsite.
Cisco has some great benefits to help me with the medical things, but I wasn’t quite sure how to get past my fear of FOMO – or Fear of Missing Out.
What I learned is that when we talk about the power of great teams at Cisco, we’re talking about the power of our “work family.” Just like your biological family helps you get through tough times, your “work family” is there to help as well.
While the HR offsite was taking place, I followed along with their adventures in social media. As a Talent Acquisition Manager, I often use social media to connect with possible candidates. As a Cisco employee, that’s one of the ways I stay connected with my global team. In this case, it was so lovely that I could follow what was going on in Malaysia through Twitter, WhatsApp and other social channels.
But then I saw a Tweet. It had a photo. With me in it! How could that be?
My team was missing me as much as I was missing them, and they had (without my knowledge) printed out pictures of my face and they were all carrying “me” around with them and posting with “me” in photos. Suddenly, there wasn’t just one picture of me, there were loads of nice messages from the team.
I really think Cisco has been amazing on how my “work family” has supported me the past few months. It makes coming back after a break much less stressful. Cisco’s support during my time off is an example of how we care about people and it’s a great way to build employee loyalty. They gave me time to recover without me feeling any pressure but kept connected so I didn’t feel I was forgotten.
Every time I see the pictures of the offsite, and see that I was still there in spirit, it makes me smile. It’s what makes the idea of #WeAreCisco come to life in a real way.
As businesses embrace data-driven decision making, it’s no longer enough to simply collect the data. In fact, there is so much data, that instead of enabling decision making, it can sometimes do the opposite.
In a recent article, CEOs Must Up Level Their Digital-Decisions Skills, Thorton May highlights that executives need to work on improving the digital-decision making process, affirming that EVERYONE is a digital decision maker. The underlying message being that organizations must improve digital decision making of non-IT executives.
With more emphasis on evidence-based management, getting the right data to the right people at the right time is critical to empowering everyone to be a decision maker.
The two most critical elements to quality decisions are: the amount of time available to make a decision and the information available to the decision maker.
Gone are the days when there wasn’t data available to inform decision makers. Instead, organizations now have a flood of data residing in multiple systems, in global locations, locked away in spreadsheets or in people’s heads. Now the concern is whether the data sources are credible – or even current.
As a result, data integrations are getting harder, not easier to pull off. Data is increasingly distributed, both inside and outside the organization, and it’s becoming more diverse. Structured data is still important, and now less structured data is becoming more relevant.
But, as consumers, we regularly see the how major brands are mismanaging all this new data—receiving offers that are outdated or irrelevant. Or even worse, multiple versions of the same outdated or irrelevant offer.
For example, if your business operates in the consumer market, social networks have added a layer of unstructured data that offers customer preferences that can improve targeting and boost loyalty.
Agile Data Integration to the Rescue
Many organizations were lured by the promises of data integration that offered to combine data from several disparate sources, and provide a unified view of the data. But like many things in life, timing is critical. Organizations need to get the right data to the right people at the right time.
In order to do this, organizations need to evaluate several key data integration factors. Below is a short list of important questions to consider.
o Business Considerations: How quickly is data available? What kind of data governance is required? Is the environment stable? How many people want access to the data and how often do they need it?
o Data Source Considerations: What are all of the necessary data sources? Are my operational systems at capacity? What kind of data cleansing is necessary?
o Data Consumer Considerations: What format does the data need to be reported, and how much data is included in the reporting?
With more emphasis on evidence-based management, getting the right data to the right people at the right time is critical to empowering everyone to be a decision maker.
In recent years, higher education institutions have enjoyed the benefits of well-implemented technologies. From facilities management and digital signage to smart workspaces and digital learning collaboration tools, colleges and universities are becoming digital campuses that realize the ease and efficiency of digital transformation.
But, risks accompany the benefits of going digital. Ensuring that students, faculty, and institutional assets remain secure in the face of malware and other cybersecurity threats is critical. As digital campuses become the new norm, how can we move forward while ensuring information security?
That’s the topic of an upcoming #CiscoChat! Join us on September 28 at 10am PST (1pm EST) to hear from industry experts Navneet Johal (@NavneetJohal1), Research Analyst of Education Technology for Ovum, Matthew Gibbs (@matgibbs), a Solutions Architect for U.S. Public Sector at Cisco and Brian Donlan (@briandonlan), the Regional Vice President of Sales for Cisco Canada.
During the chat, speakers will cover current trends in the digital campus, connected campus infrastructures, and how Cisco is helping higher education institutions maintain security before, during, and after cyber attacks.
To participate in the chat:
Make sure you’re logged into your Twitter account.
Search for the #CiscoChat hashtag and click on the Live tab.
The chat will be moderated by the Cisco Education channel (@CiscoEDU) on Twitter. Be sure to follow the account to participate. They will begin welcoming guests at 10am PST (1pm EST) and posting questions for discussion.
For @ replies to specific participants in the discussion, please use a “.” at the beginning of the tweet, so that your question or comment will appear in your public twitter feed.
If you need multiple tweets to answer a question, please preface each tweet with “1A, 2A,” etc. in order to make it easier for others to follow along with the conversation.
Be sure to use the #CiscoChat hashtag at the end of each tweet, so that others can find your contributions to the discussion.
Don’t forget to bring your own questions to the discussion as well! See you there!

 By Daniel Etman


 Written by Gideon Gilboa, Director of Marketing, Service Provider Video
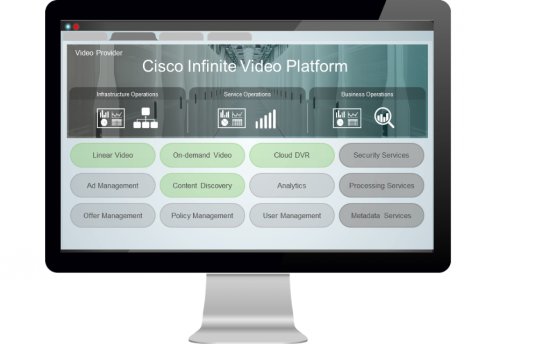 We literally took everything we know about this platform from current customer deployments, and we overlaid this data on our original financial model.
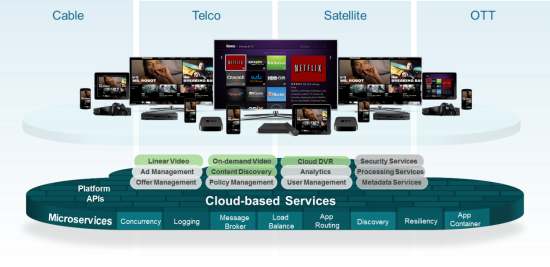
 In our recently published E-Book,