
This post was authored by Veronica Valeros, Petr Somol, Martin Rehak and Martin Grill, on behalf of the whole CTA team.
Some of us still intuitively believe that our extensively safeguarded corporate networks are safe from the risks we are exposed to when connecting directly to public Internet. Yet, evidence suggests that most companies now operate with significant persistent malware present in the network. At the same time, malware has also evolved, and we have witnessed a larger proportion of infections being brief with relatively low risk. But, even the seemingly low risk infections may open a pathway or potentially escalate into full-fledged attacks with serious business impact.
Accordingly, our mindset and the framework of our reasoning about malware needs to change. Most of the adware, malicious JavaScript in the browser, toolbars and hijacking browser plugins do not care about the network they run on. As bottom-feeders of the Internet, they monetize the internet presence and user activity, but don’t care about the data on the host – until the moment they realize that they have, however accidentally, infected a high-value asset and re-sell the presence to the highest bidder for privilege escalation and targeted attacks.
The problem of discovering attackers present in the network has therefore significantly changed. It has become rather simple to detect something malicious in the network. Today the challenge is to find the malicious network traffic that matters. This is why we built Cognitive Threat Analytics (CTA). CTA is a cloud-based breach detection service specialised in detecting threats that have already bypassed the security perimeter. We have been working very hard on prioritization and segmentation of attacks between categories according to their estimated business impact. CTA uses state-of-the-art machine learning techniques to discover the full spectrum of attacks and to monitor potential escalations when infections become more persistent or more dangerous. Continuing our promise of promoting transparency in the advanced threat research field [1], in this post we look under the hood of CTA and explain its building blocks.
CTA Detection Chain
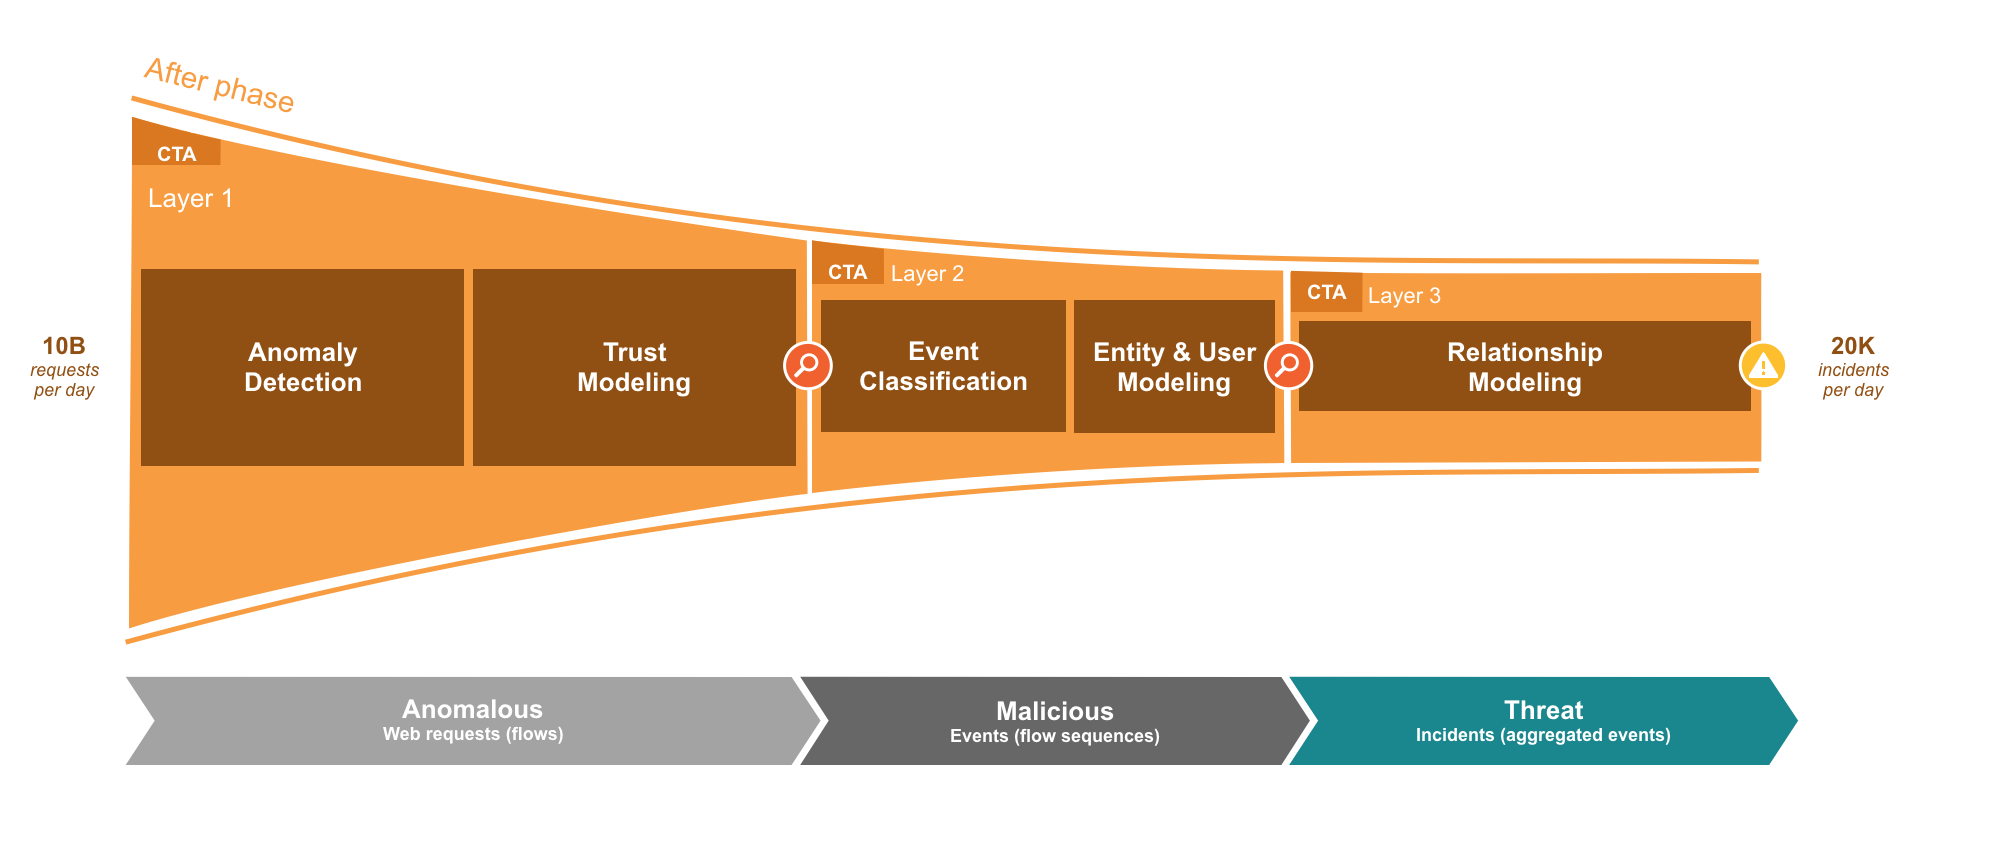
CTA consumes web access logs from web proxies, including Cisco Cloud Web Security (CWS), Cisco Web Security Appliance (WSA), and BlueCoat ProxySG. CTA processes more than 10 billion web requests daily. Through a layered approach of different machine learning techniques, CTA is able to discard 99% of the input traffic, keeping only the traffic that represents a security risk. At a high level, CTA is composed of three layers: (1) Anomaly Detection & Trust Modeling, (2) Event Classification, Entity & User Modeling, and (3) Relationship Modeling [see Figure 2]. As we will explore below, each layer is able to keep the most significant anomalous traffic and hand it over to the next layer for deeper inspection.
Layer 1: Anomaly Detection & Trust Modeling
The first layer of CTA consumes a large amount of network telemetry data, selects the most anomalous traffic and hands it over to the second layer. This layer has two stages, Anomaly Detection and Trust Modeling. The Anomaly Detection stage is composed of more than 40 individual network anomaly detectors, each designed to detect a specific type of anomalous behavior that can be related to some malicious activity. Each detector maintains a model of a normal network behavior and assigns high anomaly score to all the network observations that deviate from the model. The individual anomaly detectors are used in groups known as ensembles. An individual ensemble may use either a static or machine learned combination of the detectors. The static combinations provide a good generalization whereas the learned combinations boost the efficacy of the system on known malicious behaviors. The Trust Modeling stage acts like a long-term memory, eliminating noise in anomaly detector verdicts caused by the normal fluctuations in network traffic. This approach greatly reduces the number of false positives introduced by the anomaly detection. In this layer CTA discards 99% of the traffic, letting only highly anomalous traffic (~1%) through to next layer for further processing [2] [3] [4].
Layer 2: Event Classification, Entity & User Modeling
The second layer of CTA aims at explaining the highly anomalous traffic detected in the first layer. This layer has two stages, Event Classification and Entity & User Modeling. The Event Classification stage is composed of more than a hundred individual classifiers. A multitude of original Machine Learning techniques is employed including the high-precision Neyman-Pearson based linear models, as well as Multiple-Instance-Learning based Support Vector Machines, Neural Networks and Random Forests [5]. Each classifier is trained to recognize specific types of anomalous and malicious traffic, from software updates to exfiltration behavior and command and control communication. Classifiers are able to highlight specific indicators of compromise in a network with consistent precision in the range 90-100%. The Entity & User Modeling stage ties anomalous traffic to events associated to single hosts. When enough events are collected for a single host, they are aggregated into incidents and an alert is generated for that host [6] [7] [8].
Layer 3: Relationship Modeling
The third layer is in charge of the Relationship Modeling of incidents. This layer uses information about the incidents generated by the previous layer and correlates that information across our global intelligence in order to find common attack patterns and malware behaviors in different organizations. Thanks to this layer, CTA is able to present additional intelligence about threat presence across fields, such as how many other organizations have seen it. This knowledge is extremely useful for organizations to evaluate if they are victims of targeted campaigns or opportunistic attacks.
CTA incidents are presented in two categories: Confirmed Threats and Detected Threats. Confirmed Threats are presented with 99-100% confidence, and are tied to specific malware types that have been identified as part of farther-reaching malicious campaign. For these threats CTA provides detailed threat-specific information to reduce the time a customer-side analyst spends investigating, and speeds the remediation efforts. Detected Threats are anomalous incidents identified as specific for an organization. Less prevalent threats including Zero-Day attacks usually fall in this category. Investigation effort should be put on analyzing Detected Threats in order not to miss hard-to-identify and newly emerging threats. [9]
CTA Provides Threat Specific Intelligence
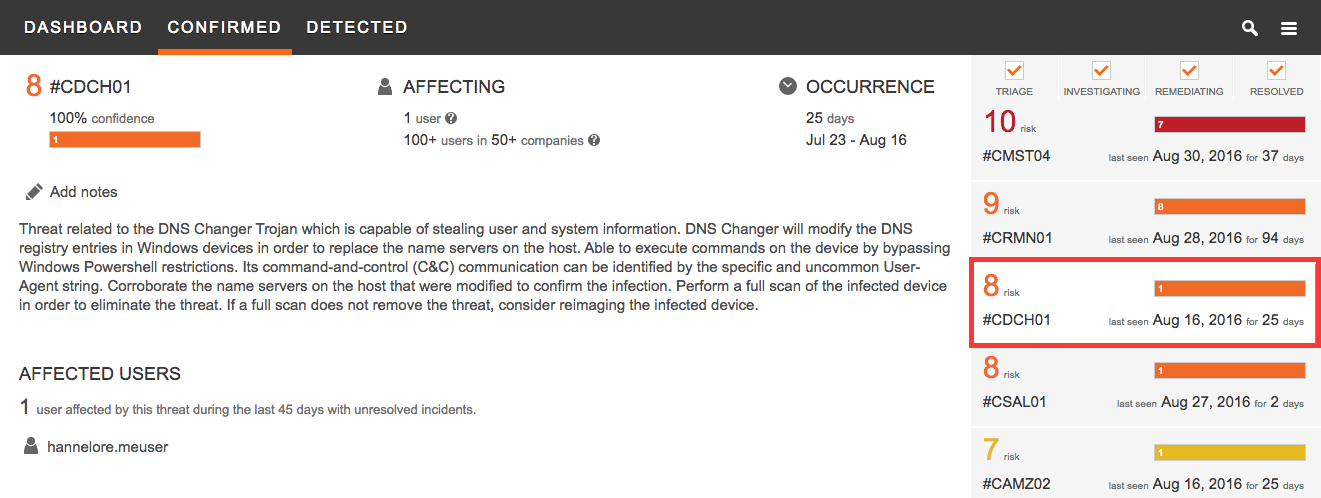
Thanks relationship modeling, CTA provides more than just incidents, it provides threat specific intelligence and uses this intelligence do derive risk scores. Every Confirmed Threat report communicates to the analyst all the information available regarding the malware infection. This allows the analyst to quickly confirm the risk assessment, estimate the damage, prioritize remediation and conduct a quick mitigation (see Figure 3).
Infection History and Network Traffic Indicators
CTA provides an infection timeline for each threat infection in the organization. The information about how long a user has been infected with a specific malware is critical to estimate the potential damage the threat may have caused, to organize a containment strategy and to prioritize the mitigation [see Figure 4].
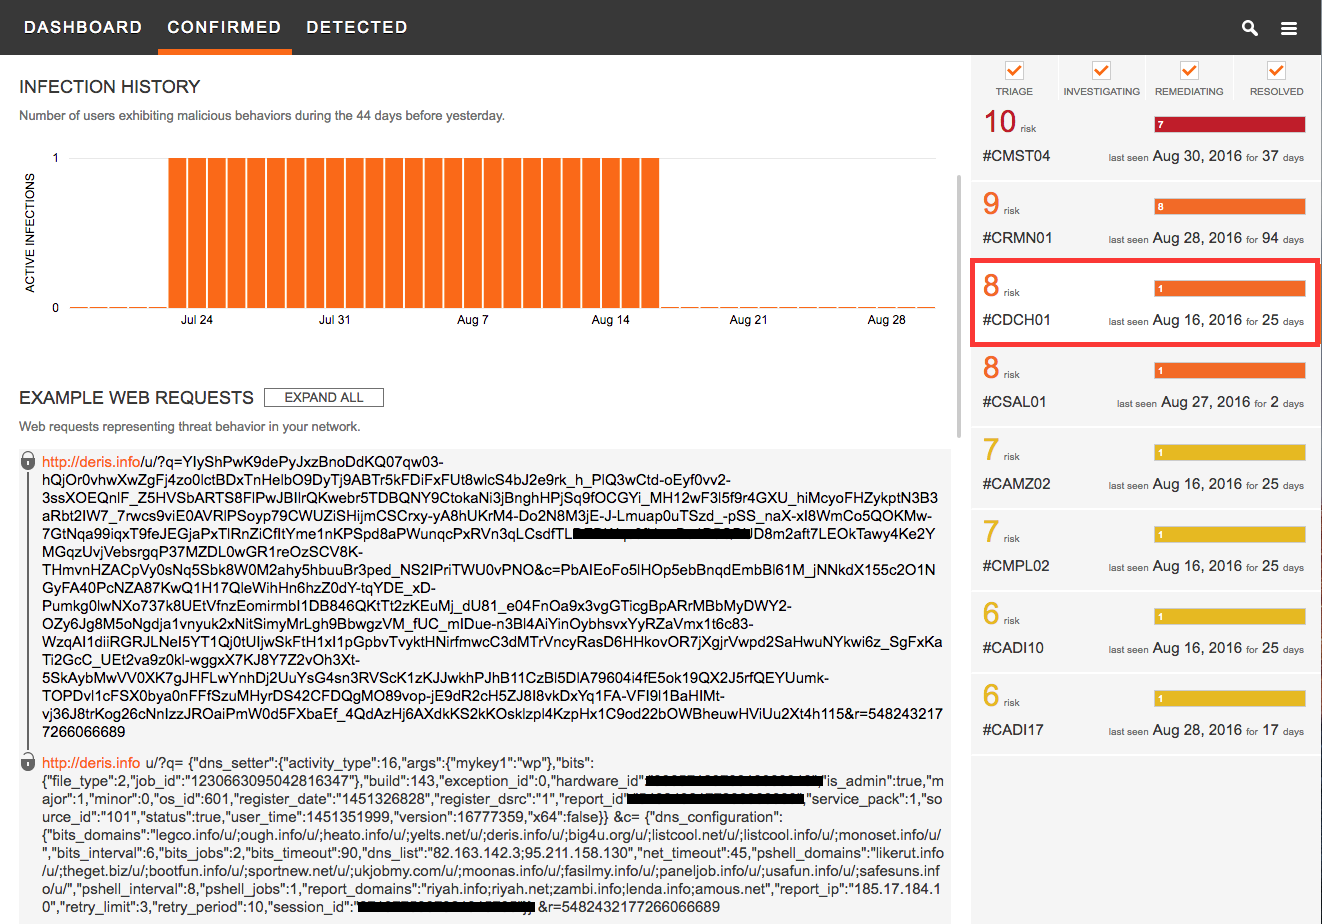
Network investigators may also need information about what the traffic of this particular threat like, to be able to improve their detection mechanisms and be able to stop these threats faster. For that purpose, CTA provides examples of the network traffic communication the threat is presenting on their network. Its embedded automatic decoder capability allows analysts to quickly look through encoded URLs and understand what information the threat is sending out [see Figure 4].
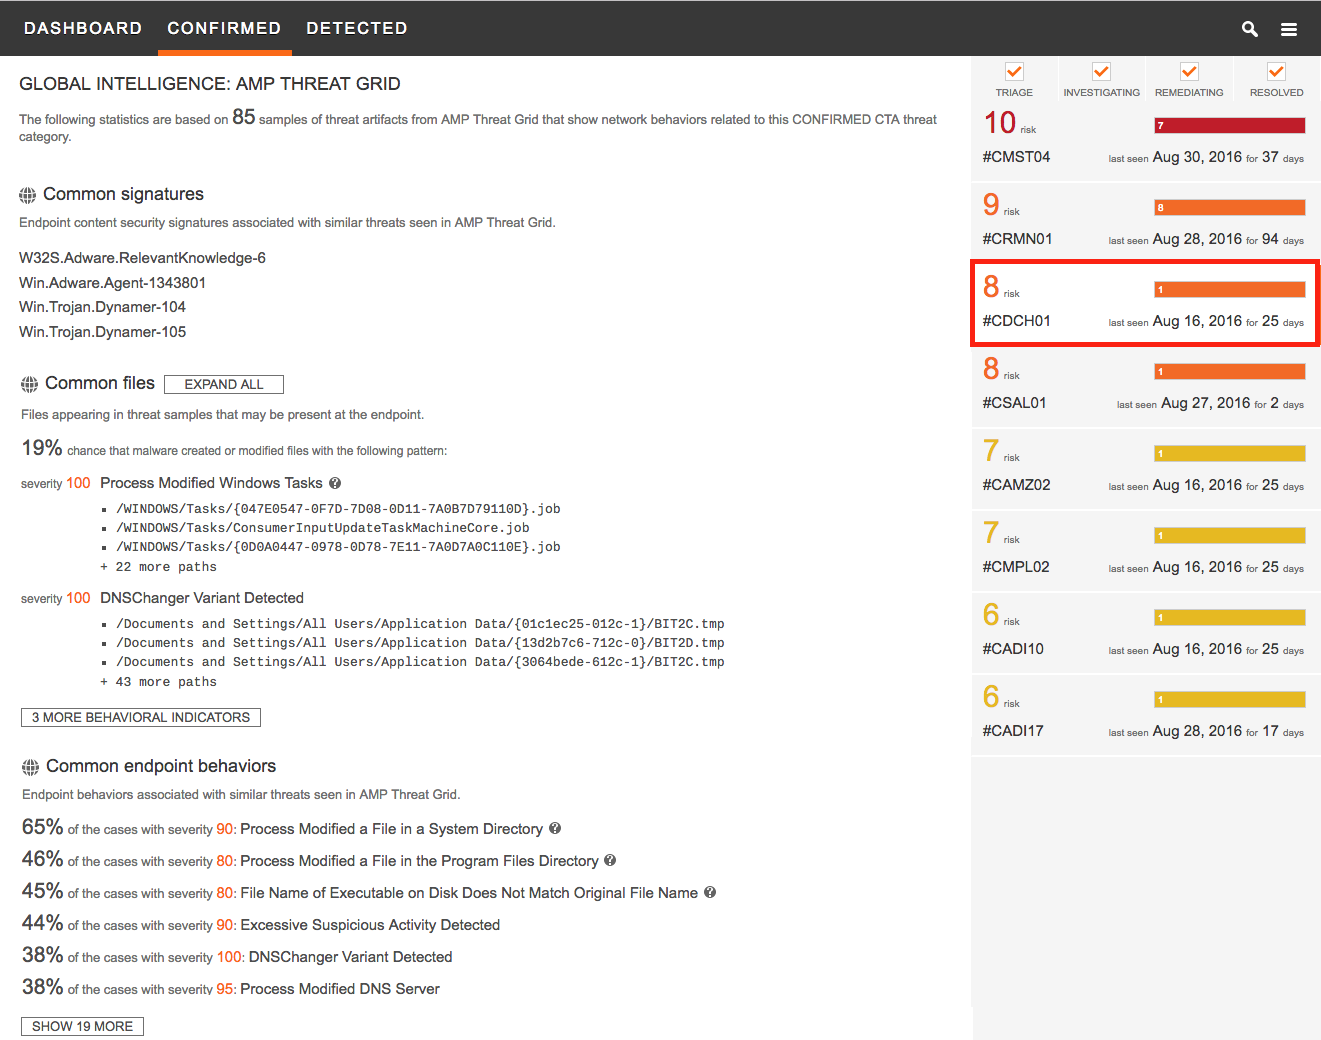
Integration with AMP Threat Grid
CTA integration with Cisco Advanced Malware Protection (AMP) Threat Grid connects the network traffic intelligence with the sandbox results, modeling relationships between different malware binaries, families and network behaviors. CTA uses this information to provide the specific files and artifacts that incident responders should look for on the infected hosts without needing direct access to the endpoint [Figure 5]. This information is used to confirm the infections in the endpoints, and to understand the technical aspects of the threat.
Your Security at a Glance
CTA output has been adapted to the world where the malware infections are a rule, rather than an exception. CTA organizes the alerts into four categories by estimating the likely business impact of each incident. The business impact is estimated by relationship modeling and learning the associations between command & control infrastructure, individual incidents and malware samples executed in AMP Threat Grid and other intelligence sources. This allows us to identify the individual botnet or malware operations, discern their versions and generations, and to infer the business models they use to achieve profit . As a result, we can predict possible escalation patterns and highlight the situations where even a trivial adware infection creates a major security issue. [10]
With organizations just like yours being attacked every day, it is vital to know what the state of security looks like at a given time in your organization. CTA dashboards are designed for that [see Figure 6].
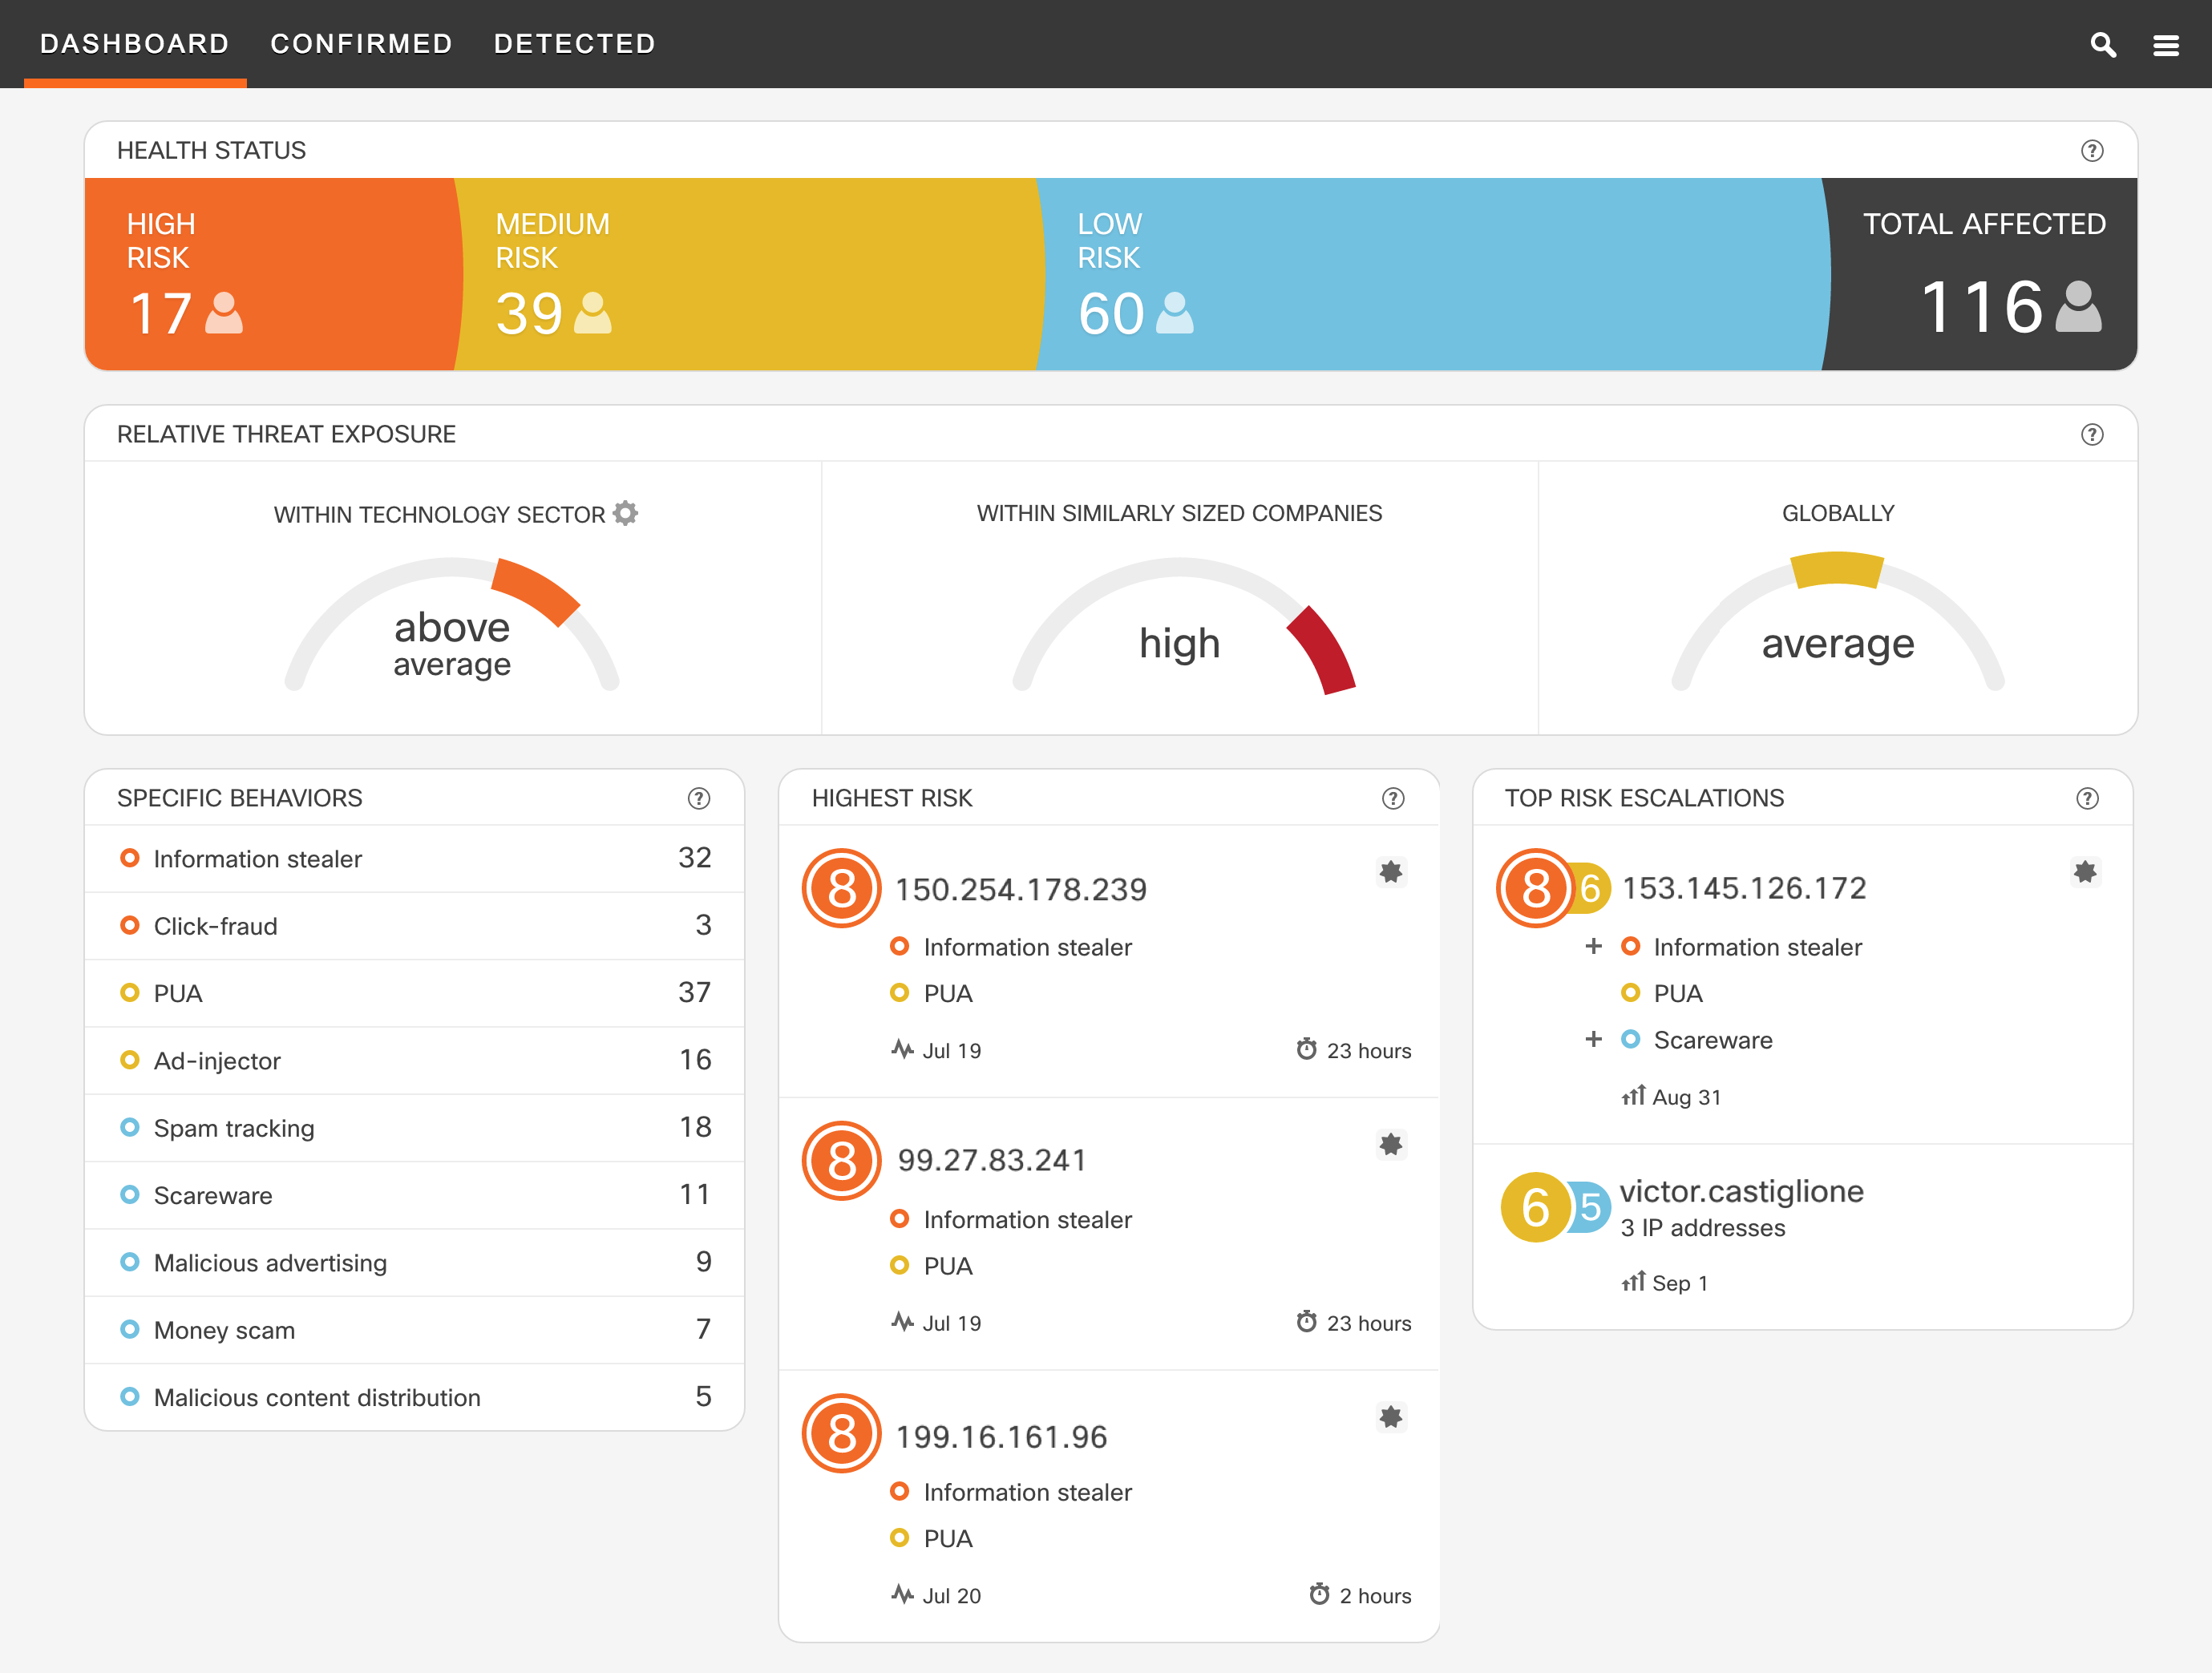
We’ve recently designed an overview dashboard, and streamlined it to provide the following critical information at a glance:
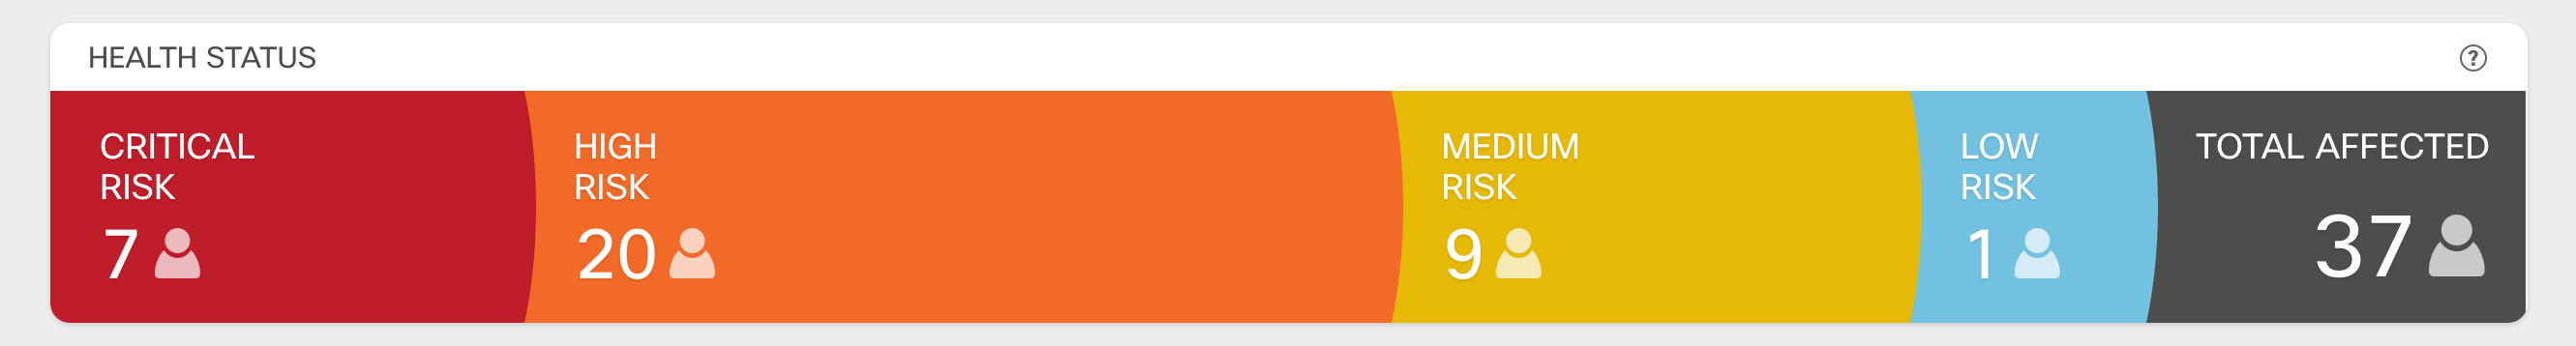
- Health Status
- Relative Threat Exposure
- Key Information on Behaviors and Users
Each component provides the information needed to communicate the state of security to stakeholders and start organizing a remediation strategy.
The Health Status shows the total number of affected users and most importantly, how many of those users are affected by high risk threats and require immediate remediation. The Relative Threat Exposure provides information about how is the organization positioned with respect to others from a security perspective. This information provides guidance for driving organizational improvements in security and improving remediation methodologies in place. The dashboard also includes a brief summary of the specific behaviors observed in the network, the highest risk incidents that may require immediate action, and the top risk escalations. [11]
Integration with AMP for Endpoints
As recently announced, Cisco Advanced Malware Protection (AMP) for Endpoints is now fully integrated with CTA, with a 30% average increase reported on threats discovery. Read more here: http://www.cisco.com/go/ampendpoint-cta
Where to go next
To learn more about CTA and request an evaluation, visit: https://cognitive.cisco.com/
Read more about CTA threat detection in action:
- DNSChanger Outbreak Linked to Adware Install Base
- Angler for Beginners in 34 Seconds
- Malware stealing gigabytes of your data as seen by Cognitive Threat Analytics
- Bad Browser Plug-ins Gone Wild: Malvertising, Data Exfiltration, and Malware, Oh my!
Watch more about CTA as part of Cisco Security solutions:
- Cognitive Threat Analytics on Web Security – YouTube
- Cisco AMP for Endpoints Integration with Cognitive Threat Analytics Overview – YouTube
- Cisco Web Security: More Than a Proxy – YouTube
References
[1] Rehak, M. (2015, September 11). Cognitive Threat Analytics – Transparency in Advanced Threat Research [web blog post]. Retrieved from http://blogs.cisco.com/security/cognitive-threat-analytics-transparency-in-advanced-threat-research
[2] Grill, M., Pevný, T., & Rehak, M. (2016). Reducing false positives of network anomaly detection by local adaptive multivariate smoothing. Journal of Computer and System Sciences. http://dx.doi.org/10.1016/j.jcss.2016.03.007
[3] Grill, M., & Pevný, T. (2016). Learning combination of anomaly detectors for security domain. Computer Networks. http://dx.doi.org/10.1016/j.comnet.2016.05.021
[4] Garcia, S., Grill, M., Stiborek, J., & Zunino, A. (2014). An empirical comparison of botnet detection methods. computers & security, 45, 100-123. http://dx.doi.org/10.1016/j.cose.2014.05.011
[5] Bartos, K., Franc, V., Sofka, M. (2015, September 3). Cognitive Research: Learning Detectors of Malicious Network Traffic [web blog post]. Retrieved from http://blogs.cisco.com/security/talos/machine-learning-detectors
[6] Bartos, K., Softka, M., & Franc, V. (2016, August). Optimized invariant representation of network traffic for detecting unseen malware variants. In 25th USENIX Security Symposium, forthcoming.
[7] Bartos, K., & Sofka, M. (2015, September). Robust representation for domain adaptation in network security. In Joint European Conference on Machine Learning and Knowledge Discovery in Databases (pp. 116-132). Springer International Publishing. http://dx.doi.org/10.1007/978-3-319-23461-8_8
[8] Franc, V., Sofka, M., & Bartos, K. (2015, September). Learning detector of malicious network traffic from weak labels. In Joint European Conference on Machine Learning and Knowledge Discovery in Databases (pp. 85-99). Springer International Publishing. http://dx.doi.org/10.1007/978-3-319-23461-8_6
[9] Jusko, J., Stiborek, J., Kohout, J., Rehak, M., & Pevný, T. (2016). Social Threat Propagation. IEEE Intelligent Systems. Accepted for publication in 2016.
[10] Valeros, V., Gibb, R., Hulse, E., & Rehak, M. (2016). DNSChanger Outbreak Linked to Adware Install Base [web blog post]. Retrieved from: http://blogs.cisco.com/security/dnschanger-outbreak-linked-to-adware-install-base
[11] Svoboda, M. (2016, July 29). Introducing executive dashboards in CTA [web blog post]. Retrieved from http://blogs.cisco.com/security/introducing-executive-dashboards-in-cta


great article
Excellent post!, I’ll share it through my twitter account. Thank you for sharing it.