Qbot, AKA Qakbot, has been around for since at least 2008, but it recently experienced a large surge in development and deployments. Qbot primarily targets sensitive information like banking credentials. Here we are unveiling recent changes to the malware that haven’t been made public yet.
Qbot’s primary means of infection is as a payload in browser exploit kits. Website administrators often use FTP to access their servers, so Qbot attempts to steal FTP credentials to add these servers to its malware hosting infrastructure. Qbot can also spread across a network using SMB, which makes it very difficult to remove from an unprotected network.
Germany’s Hannover Messe is the world’s foremost trade fair for industrial technology and it is taking place right now through April 29. Only here will you find the leading key technologies and core areas of industry all under one roof. This includes everything from industrial automation and supply, IT, production technologies and services; to energy and mobility technologies. The opening keynote was delivered by President Obama, alongside German Chancellor Merkel.
I am excited to be attending such an incredible event and honored to have been invited to participate in a panel discussion on IoT. The session was titled, “IoT as the Driver for Industrial Transformation.” My portion of the discussion focused on IoT and the opportunity for transformation of digital industries. And, as you might imagine, the opportunity for digital manufacturing is huge. Here are just a few recent examples from Cisco’s private sector use cases:
savings of as much as $7 million per plant, per year, are possible;
configuration can be up to 20x faster;
inventory can be reduced by 50%; and
OEE can be up to 10% higher.
The transformation to fully digitized manufacturing is substantially easier for customers now that Cisco’s network architecture supports the PROFINET standard. Read more about this exciting announcement here. This is a big step on our journey towards the Industry 4.0 Initiative and in helping customers achieve the business benefits of fully digitized manufacturing.
“Cisco Energy Management Suite is a key project in reducing energy costs across our 700-plus buildings, aiding our evolution into a smart city and making savings for reinvestment.”
Andrew Mouat, Principle Officer Carbon Management, Glasgow City Council
Glasgow, Scotland, leads the way in shaping a welcoming, safer and greener city of the future. Better management of IT energy use is key.
Glasgow is set to officially become a ‘Future City.’ The council has a reputation for getting results, including the best ever Commonwealth Games. Sustainability is central to that aspiration; increased IT energy efficiency was sought.
The Energy IT app from the Energy Solutions Group (ESG) was chosen to monitor the council’s IT power usage in real time. It reported carbon and cost savings weekly. Devices that fell below agreed efficiency levels would be instantly flagged. Identifying usage patterns helped refine IT policies.
Unobtrusive energy management: The Energy IT app is based on the Cisco Energy Management Suite. The software was installed in just hours; users were completely unaffected.
All-round advice all-inclusive: The ESG service includes advice on developing the business case, drawing on its extensive building management expertise.
Expert support at all levels: Access, which provides specialist IT and property services to Glasgow City Council, offers first line technical support, with remote assistance from ESG.
Results
Cisco Energy Management Suite has gone live on 19,000 devices in the council’s 239 schools. Soon it will manage another 18,000 devices in the corporate network.A pilot ran on 9,200 devices in 29 secondary schools. In six months, IT energy use dropped nine percent. That’s a one percent fall in the council’s IT energy use, with positive ROI in five months and first-year savings of £330,000.
Learn More
Learn more about Cisco Data & Analytics at the Smart Cities Innovation Summit in Austin. Join our breakout session on Tuesday, June 14, at 11:30 am to hear more about our work with the City of Paris.
OpenStack works here. I intend to make you think about a double meaning: OpenStack is both people and platform. We work here, and the platform works great here at Cisco.
At the OpenStack Summit in Austin this week, I see a compelling need for OpenStack and the many private clouds springing to life. I want to build bridges to enable application workloads on OpenStack infrastructure, platforms, even when it requires microservices and containers.
As a long-time OpenStack advocate, I want to take a pivot in my career path, and Cisco lets me do that. I create the connections between developers, their workloads, their needs, and OpenStack clouds with an eye towards the rise of containers. Cisco enhances the experience through both DevNet and Cisco Metapod outreach and community efforts with a trusted set of OpenStack leaders. I’m only in my first week here, and I keep finding fellow community members, such as Josh Kleinpeter who first went to lunch with Jonathan Bryce and me in 2011 to ask about the reality and promise of OpenStack for AT&T, who this week won the Superuser award. And Rainya Mosher, who glued together one of the first public cloud operations group running OpenStack. Plus Niki Acosta whose bright mind and enthusiasm for the cloud is contagious. We were able to record a podcast this week for ospod, have a listen!
Cisco DevNet is the Developer Program for Cisco. Metapod is the Cisco OpenStack cloud offering. By bringing me on board, I want to enhance that experience with Cisco APIs and developer tools. Let’s bring it all together — managing Cisco networks, connecting the Internet of Things, and envisioning the data centers of the future. Plus we can bring more understanding of the OpenStack Networking APIs and software-defined networking by continuing my work in upstream.
At Rackspace I was accountable for developer support through email, tickets, StackOverflow, community forum posts, and Github or JIRA issues tracking. We consolidated these various channels to listen where the devs are. To hear more about what I’ve learned from listening to application developers in the OpenStack community, see my talk from the Paris OpenStack Summit.
This week I’m attending the OpenStack Summit here in my hometown, Austin, Texas. Last week I attended the first Cisco DevNet Women in Technology event. I love being a part of these events.
I aspire to lead by example and influence and inspire others to solve technical problems. I put customers first and leverage the power of community for the best outcomes for application developers and their needs. I’m also simply happy to be here. Please, reach out on Twitter (@annegentle) or in the OpenStack upstream community to let me know what is important to you.
The Common Vulnerability Scoring System (CVSS), which is used by many in the industry as a standard way to assess and score security vulnerabilities, is evolving to a new version known as CVSSv3. These changes addressed some of the challenges that existed in CVSSv2; CVSSv3 analyzes the scope of a vulnerability and identifies the privileges an attacker needs to exploit it. The enhancements to CVSS will allow vendors, such as Cisco, to better analyze security vulnerability impact. The changes will also more clearly define the urgency of responding to the vulnerability for our customers.
Cisco will begin to adopt CVSSv3 for assessing security vulnerabilities in the fourth quarter of calendar year 2016 (Q4CY16).
Background
CVSS is the industry-open standard designed to convey the common attributes of vulnerabilities in computer hardware and software systems. Cisco uses it to provide a score for each vulnerability in security advisories. CVSS was developed as a cooperative effort between the National Infrastructure Advisory Council and a number of security industry vendors and research organizations, including Cisco. The Forum of Incident Response and Security Teams (FIRST) has been designated as the custodian of CVSS to promote its adoption globally. This new version was under development for 3 years, and Cisco was a contributor to the standard.
Effects of Introducing CVSSv3
The following study reviews the difference in scores when a vulnerability is assessed using CVSSv2 vs. CVSSv3. The stakeholders at FIRST have done a great job in this new version of the standard addressing some of the challenges faced with its predecessor (CVSSv2).
As more organizations begin to adopt this new standard in their processes for evaluating vulnerabilities, there will be some visible changes in disclosure trends overall. The most notable is an increase in the total number of higher-rated vulnerabilities. This increase occurs because the metrics changes in the new system. As the threat landscape evolves, there are more cases where an increased sense of urgency is needed in customers’ responses.
Study Details
This study analyzed the difference between CVSS version 2 and version 3 scores. This study uses CVSSv2 and CVSSv3 scores provided by the National Vulnerability Database (NVD). A total of 745 vulnerabilities were analyzed, and each vulnerability is identified by a Common Vulnerabilities and Exposures (CVE) identifier. All the vulnerabilities were disclosed in 2016.
The goal was to identify the percentage of vulnerabilities that had a score increase or decrease, based on the two versions of the protocol (CVSSv2 vs. CVSSv3).
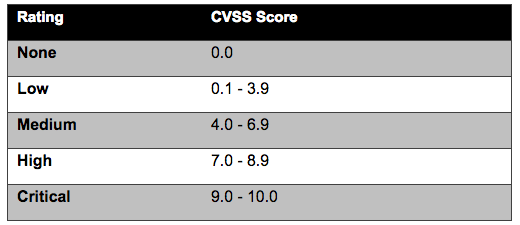
CVSSv3 Qualitative Severity Rating Scale and the Cisco Security Impact Rating
Table 1. SIR and CVSSv3 Qualitative Severity Rating Scale
Note: Cisco reserves the right to deviate from this simple mapping on an exception basis in the event that there are additional factors not properly captured in the CVSS score.
Results
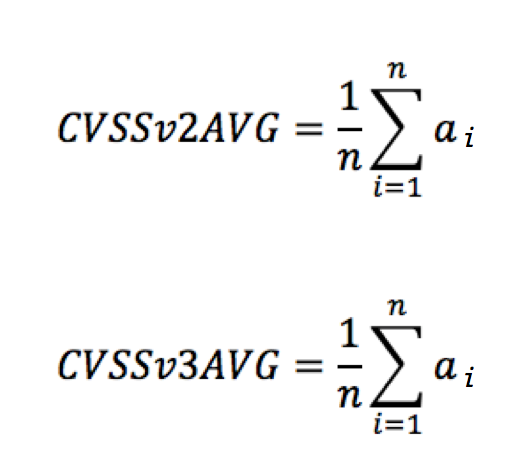
The CVSSv2 and CVSSv3 scores were analyzed for 745 vulnerabilities. These vulnerabilities were disclosed from January 2016 through April 2016. The scores used were provided by the National Institute of Standards and Technology (NIST) in NVD. The average CVSSv2 and CVSSv3 base scores of all vulnerabilities were calculated and compared, as shown below:
n = 745 vulnerabilities (CVEs) ai = either CVSSv2 or CVSSv3 base scores
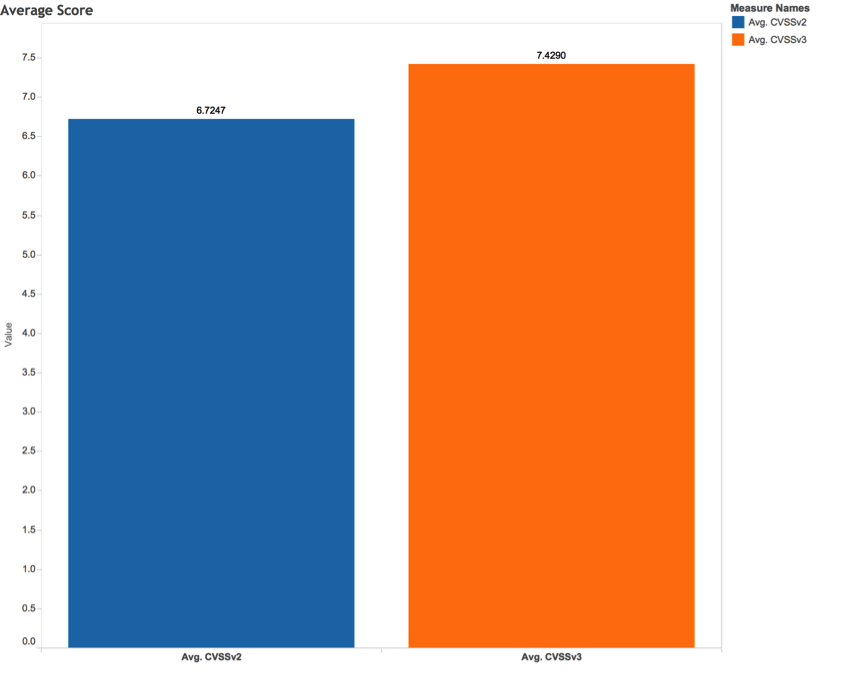
The CVSSv2 average score (CVSSv2AVG) was 6.7 and the CVSSv3 average score (CVSSv3AVG) was 7.4, as illustrated in Figure 1.
Figure 1. Average CVSSv2 and CVSSv3 Scores
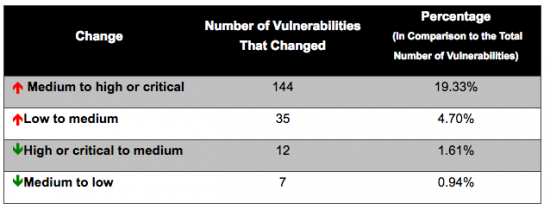
Table 2 shows the number of vulnerabilities that changed. When CVSSv3 was used, the rating for the CVSS base score changed for many vulnerabilities as follows:
Medium to high or critical
Low to medium
High or critical to medium
Medium to low
Table 2. Number of Vulnerabilities with Severity Scale Changes
Score Increase from Medium to High or Critical
There were 144 vulnerabilities for which ratings increased from medium to high or critical. That represents 19.33 percent of all studied vulnerabilities, and 38 percent of the 380 medium-scaled vulnerabilities (under CVSSv2 scores). The average base score of these vulnerabilities was 6.1 with CVSSv2, with an increase to an average base score of 8.2 when the vulnerabilities were scored with CVSSv3, as shown in Figure 2:
Figure 2. Average Score of Vulnerabilities That Increased from Medium to High or Critical
Score Increase from Low to Medium
There were 35 vulnerabilities for which ratings increased from low to medium. That represents only 4.7 percent of all studied vulnerabilities, and 88 percent of the 40 low-scaled vulnerabilities (under CVSSv2 scores). The average base score of these vulnerabilities was 3.0 with CVSSv2, with an increase to an average base score of 5.5 when the vulnerabilities were scored with CVSSv3, as shown in Figure 3:
Figure 3. Average Score of Vulnerabilities That Increased from Low to Medium
Score Decrease from High or Critical to Medium
There were 12 vulnerabilities for which ratings decreased from high or critical to medium. That represents only 1.61 percent of all studied vulnerabilities, and 4 percent of the 325 high-scaled or critical-scaled vulnerabilities (under CVSSv2). The average base score of these vulnerabilities was 7.2 with CVSSv2, with a decrease to an average base score of 6.2 when the vulnerabilities were scored with CVSSv3, as shown in Figure 4:
Figure 4. Average Score of Vulnerabilities That Decreased from High or Critical to Medium
Score Decrease from Medium to Low
There were 7 vulnerabilities for which scores decreased from medium to low. That represents only 0.94 percent of all studied vulnerabilities, and 2 percent of the 380 medium-scaled vulnerabilities (under CVSSv2 scores). The average base score of these vulnerabilities was 4.3 with CVSSv2, with a decrease to an average base score of 3.6 when the vulnerabilities were scored with CVSSv3, as shown in Figure 5:
Figure 5. Average Score of Vulnerabilities That Decreased from Medium to Low
Types of Vulnerabilities
The types of vulnerabilities that had score increases or decreases were also interesting. In this study, I analyzed the Common Weakness Enumeration (CWE) identifiers assigned by NIST for each vulnerability. CWE is a standard maintained by MITRE that describes the software weaknesses of security vulnerabilities.
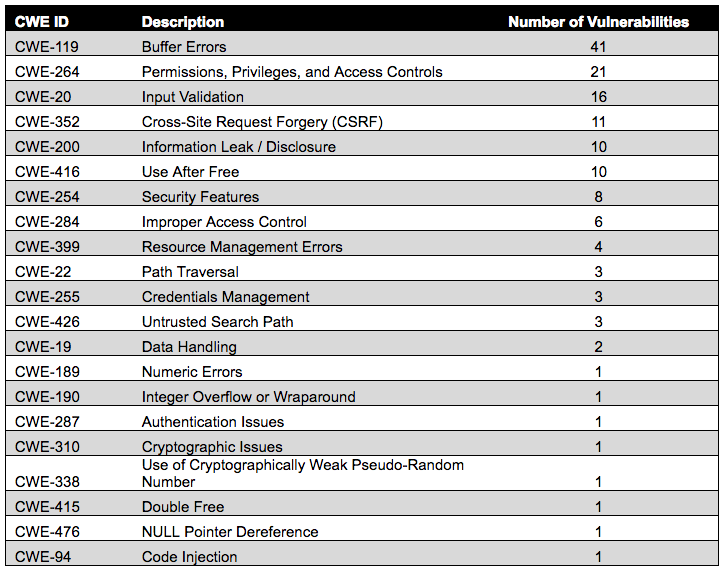
CWE IDs for Vulnerabilities That Changed from Medium to High or Critical
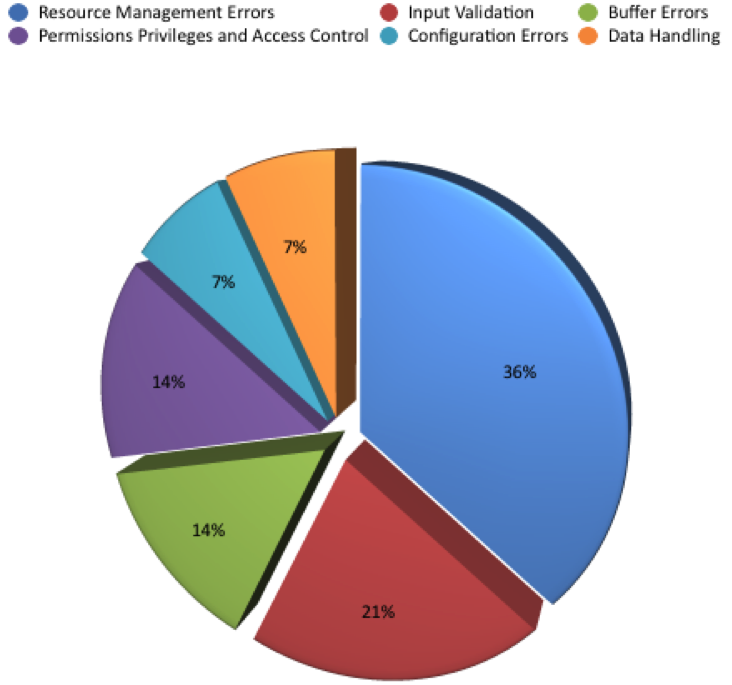
The most common weaknesses (CWE IDs) for the 144 vulnerabilities that changed from medium to high or critical were buffererrors and permissions, privileges, and access controls. Table 3 provides the details of the distribution of CWE types and the number of vulnerabilities with these weaknesses:
Table 3. Most Common CWE IDs for Vulnerabilities That Changed from Medium to High or Critical
Figure 6 illustrates the distribution of CWE IDs for vulnerabilities that changed from medium to high or critical:
Figure 6. Distribution of CWE IDs for Vulnerabilities That Changed from Medium to High or Critical
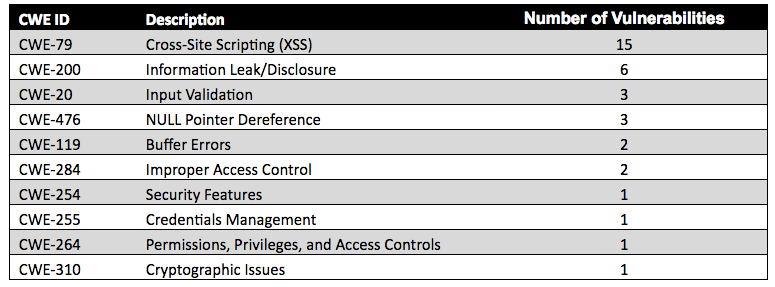
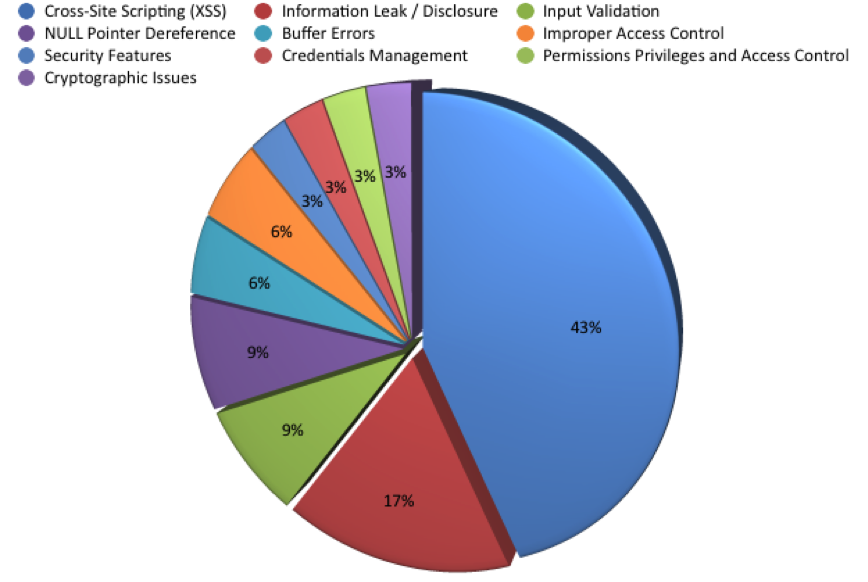
CWE IDs for Vulnerabilities That Changed from Low to Medium
The most common weaknesses (CWE IDs) for the 35 vulnerabilities that changed from low to medium were cross-site scripting (XSS) and information leak/disclosure. Table 4 provides the details of the distribution of CWE types and the number of vulnerabilities with these weaknesses:
Table 4. Most Common CWE IDs for Vulnerabilities That Changed from Low to Medium
Figure 7 illustrates the distribution of CWE IDs for vulnerabilities that changed from low to medium:
Figure 7. Distribution of CWE IDs for Vulnerabilities That Changed from Low to Medium
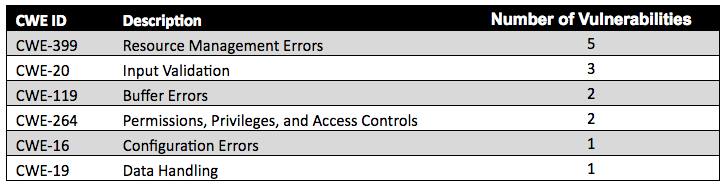
CWE IDs for Vulnerabilities That Changed from High or Critical to Medium
The most common weaknesses (CWE IDs) for the 12 vulnerabilities that changed from high or critical to medium were resource management errors and input validation. Table 5 provides the details of the distribution of CWE types and the number of vulnerabilities with these weaknesses:
Table 5. Most Common CWE IDs for Vulnerabilities That Changed from High or Critical to Medium
Figure 8 illustrates the distribution of CWE IDs for vulnerabilities that changed from high or critical to medium:
Figure 8. Distribution of CWE IDs for Vulnerabilities That Changed from Low to Medium
CWE IDs for Vulnerabilities That Changed from Medium to Low
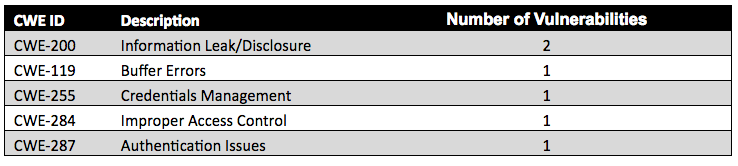
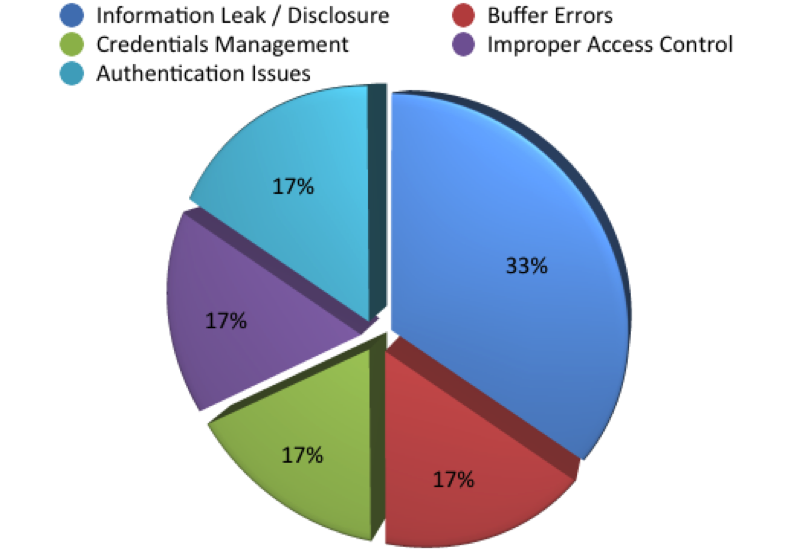
The most common weakness (CWE ID) for the seven vulnerabilities that changed from medium to low was information leak/disclosure. Table 6 provides the details of the distribution of CWE types and the number of vulnerabilities with these weaknesses:
Table 6. Most Common CWE IDs for Vulnerabilities That Changed from Medium to Low
Figure 9 illustrates the distribution of CWE IDs for vulnerabilities that changed from medium to low:
Figure 9. Distribution of CWE IDs for Vulnerabilities That Changed from Medium to Low
Raw Data
I have uploaded all the raw data used in this study to GitHub at the following link/repository:
The CVSS enhancements mean that we will see more vulnerabilities being rated as high or critical throughout the security industry. You may ask yourself, was the industry analyzing and scoring the risk of vulnerabilities incorrectly or are we inflating the scores now? The answer lies in the fact that threats to security are evolving and advancing all the time. Threat types that were once a potential inconvenience could now have a greater impact on an organization. Our assessments of such threats and the appropriate level of response also needed to evolve.
The stakeholders at FIRST have done a great job in this new CVSS version to address some of the challenges we faced with its predecessor (CVSSv2). The new enhancements allow incident response, IT security, and cyber security teams to analyze the impact of security vulnerabilities to determine the urgency of response.
Cisco PSIRT will continue to adapt to enable our customers to assess and mitigate any risks in their networks quickly. Our mission is to do the right thing quickly, and to keep our customers protected.
If you follow along with WeAreCisco in social media, you’ll find a lot of great employee photos. The recent #LoveWhereYouWork contest was proof of that.
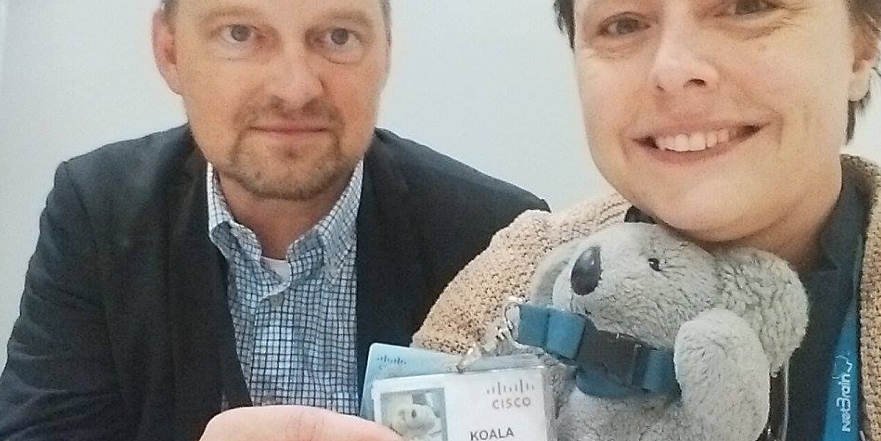
But you might have seen a few of one Cisco badge-wearer that looks a little different. He’s shorter. Much furrier. Doesn’t talk much. He doesn’t have a smartphone, but he’s had selfies taken with former CEO and now Executive Chairman John Chambers, CEO Chuck Robbins, and a host of other employees from all levels in the Cisco organization.
Koala at the IT All Hands Meeting
He’s Koala. He’s my travel companion. And he’s maybe more popular than me. (Editor’s note, Nicole is an Ada Award Digital Woman of the Year Finalist, and an amazing woman in technology, she’s pretty popular around here.)
Koala wasn’t always my travel companion, but here’s how he came to be an unofficial Cisco mascot.
Beijing to San Diego. That’s a lot of miles to rack up when your husband and you are on two different continents. Actually, we were still dating at the time, which just adds long-distance relationship stress.
Being the great partner he is, he knew I loved furry animals. So he gave me two stuffed bears, one was green and one was yellow. So they became known as Green and Yellow. They were my first stuffed travel buddies.
I took Green with me to Beijing, and one evening after coming back to my room I was talking to my husband’s voicemail telling how my day went. I suddenly noticed Green was gone. Still talking into the voicemail (so my husband would get the full effect) I kept saying, in my really sad voice, “Green? Where are you Green? I can’t find Green!”
Next morning when my kind husband was listening to my voicemail he was smiling at my silliness but really felt sorry over my heartbreak of losing the stuffed animal.
Since this was the year of the Sydney Olympics, on his way to Amsterdam from the San Diego airport he bought a new furry animal. A Koala. Which we named, surprisingly, “Koala.” This is how he came into my life.
Shortly after getting my new travel buddy, I had a dinner conversation about how whilst travelling people would be more intersted seeing a Koala in the photo than a real person. This is how Koala’s fame started (but it hasn’t gone to his head.) I made Koala a Facebook page to share his travel adventures with the world.
My Koala bucket list of pictures included having a photo of Koala and then-CEO John Chambers together. However, in order to make that happen, my colleague said Koala would need have an employer badge.
Koala got his Cisco badge!
Once that happened, Koala met his first Cisco VIP, and has since had a few photos with John, and has added other VIPs – like CEO Chuck Robbins.
Koala and CEO Chuck Robbins.
Koala and then-CEO, now Executive Chairman John Chambers.
Koala attends events with me as well. He recently went “home” to CiscoLIVE Melbourne, where the other stuffed koalas were jealous of his passport stamps. Before that, he went with me to CiscoLIVE Berlin. He’s been to other smaller events, he appeared in a video with me for the Anita Borg Institute, and gets the VIP treatment at every office we visit.
Koala at GSX with Executive Chairman John Chambers and Hillary Clinton.
These are a few of his (and my) favorite photos, but you can follow along in social media on Twitter and Facebook. And all the cool koalas are on Instagram, too.
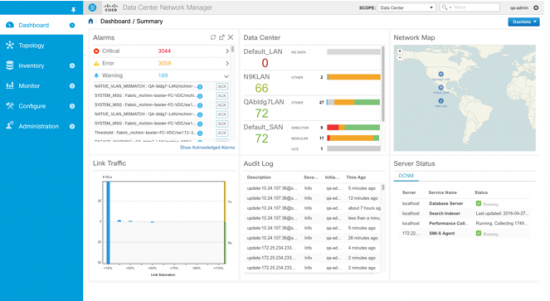
As customers move to architect their data centers to support cloud model to enable them to respond quickly to business needs, software management and orchestration plays a key role in making that happen. Simply put you need software that easily integrates with existing infrastructure and provides ease of fabric automation and flexibility, visibility, troubleshooting and operation.
DCNM Dashboard with Customizable Dashlets
Cisco Data Center Network Management (DCNM) has evolved over the years to support such function and need for Nexus switches. The power of the NX-OS with DCNM can accelerate IT efficiencies operational model.
Let’s look at the newly released DCNM version 10 with the built-in data base and high availability:
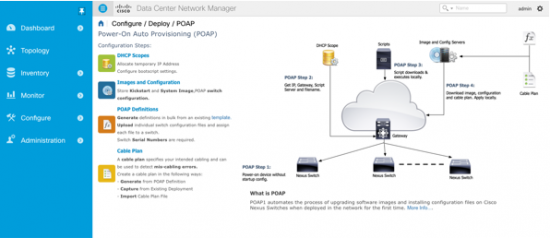
Fabric automation – DCNM allows customers in Day 0 operation to make big fabric deployments easy, leading to lowered Opex. With Power-On Auto Provisioning (POAP), validated templates and definable fabrics, DCNM lets customers normalize fabric images, devices, provisioning methods, and Fabric underlay settings for reliable, consistent fabric behavior.
Last week, 18 students and 5 educators from Lycée privé ET UFA Robert Schuman school in France visited the Cisco campus in San Jose to learn about how we’re pioneering new technologies in education and to consider a career at Cisco.
The students, who are currently preparing for a vocational degree to become IT technicians specialized in networking, were intrigued by Cisco and the methods in which we’re allowing students to #LearnWithoutLimits.
During the event, students were able to speak with Renee Patton (US Public Sector Director of Education) and Jeanne Beliveau-Dunn (Vice President and General Manager of Cisco Services). Watch the short clip below for a look at Thursday’s event.

 Germany’s Hannover Messe is the world’s foremost trade fair for industrial technology and it is taking place right now through April 29. Only here will you find the leading key
 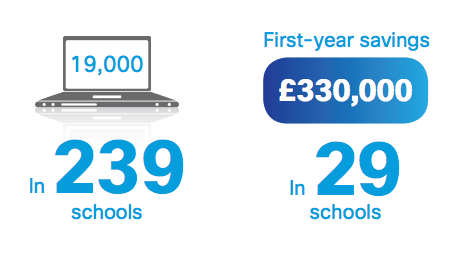 A pilot ran on 9,200 devices in 29 secondary schools. In six months, IT energy use dropped nine percent. That’s a one percent fall in the council’s IT energy use, with positive ROI in five months and first-year savings of £330,000.