
The Common Vulnerability Scoring System (CVSS), which is used by many in the industry as a standard way to assess and score security vulnerabilities, is evolving to a new version known as CVSSv3. These changes addressed some of the challenges that existed in CVSSv2; CVSSv3 analyzes the scope of a vulnerability and identifies the privileges an attacker needs to exploit it. The enhancements to CVSS will allow vendors, such as Cisco, to better analyze security vulnerability impact. The changes will also more clearly define the urgency of responding to the vulnerability for our customers.
Cisco will begin to adopt CVSSv3 for assessing security vulnerabilities in the fourth quarter of calendar year 2016 (Q4CY16).
Background
CVSS is the industry-open standard designed to convey the common attributes of vulnerabilities in computer hardware and software systems. Cisco uses it to provide a score for each vulnerability in security advisories. CVSS was developed as a cooperative effort between the National Infrastructure Advisory Council and a number of security industry vendors and research organizations, including Cisco. The Forum of Incident Response and Security Teams (FIRST) has been designated as the custodian of CVSS to promote its adoption globally. This new version was under development for 3 years, and Cisco was a contributor to the standard.
Effects of Introducing CVSSv3
The following study reviews the difference in scores when a vulnerability is assessed using CVSSv2 vs. CVSSv3. The stakeholders at FIRST have done a great job in this new version of the standard addressing some of the challenges faced with its predecessor (CVSSv2).
As more organizations begin to adopt this new standard in their processes for evaluating vulnerabilities, there will be some visible changes in disclosure trends overall. The most notable is an increase in the total number of higher-rated vulnerabilities. This increase occurs because the metrics changes in the new system. As the threat landscape evolves, there are more cases where an increased sense of urgency is needed in customers’ responses.
Study Details
This study analyzed the difference between CVSS version 2 and version 3 scores. This study uses CVSSv2 and CVSSv3 scores provided by the National Vulnerability Database (NVD). A total of 745 vulnerabilities were analyzed, and each vulnerability is identified by a Common Vulnerabilities and Exposures (CVE) identifier. All the vulnerabilities were disclosed in 2016.
The goal was to identify the percentage of vulnerabilities that had a score increase or decrease, based on the two versions of the protocol (CVSSv2 vs. CVSSv3).
CVSSv3 Qualitative Severity Rating Scale and the Cisco Security Impact Rating
Cisco adopted a Security Impact Rating (SIR) in 2015, which uses basically the same scale as the new CVSSv3 qualitative severity rating scale. This scale is described in Table 1:
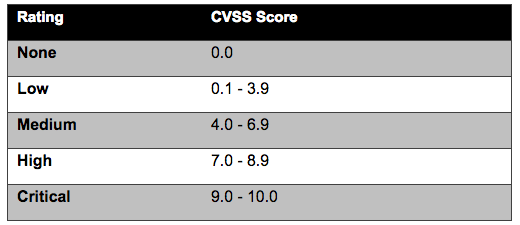
Note: Cisco reserves the right to deviate from this simple mapping on an exception basis in the event that there are additional factors not properly captured in the CVSS score.
Results
The CVSSv2 and CVSSv3 scores were analyzed for 745 vulnerabilities. These vulnerabilities were disclosed from January 2016 through April 2016. The scores used were provided by the National Institute of Standards and Technology (NIST) in NVD. The average CVSSv2 and CVSSv3 base scores of all vulnerabilities were calculated and compared, as shown below:
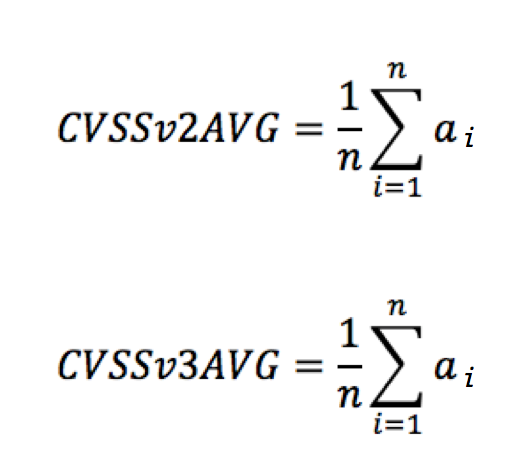
n = 745 vulnerabilities (CVEs)
ai = either CVSSv2 or CVSSv3 base scores
The CVSSv2 average score (CVSSv2AVG) was 6.7 and the CVSSv3 average score (CVSSv3AVG) was 7.4, as illustrated in Figure 1.
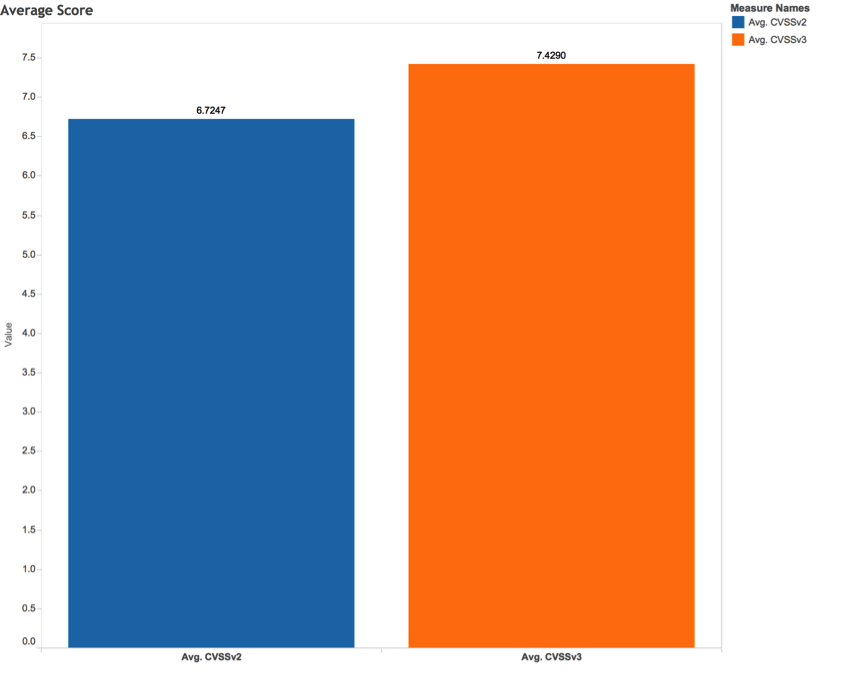
Table 2 shows the number of vulnerabilities that changed. When CVSSv3 was used, the rating for the CVSS base score changed for many vulnerabilities as follows:
- Medium to high or critical
- Low to medium
- High or critical to medium
- Medium to low
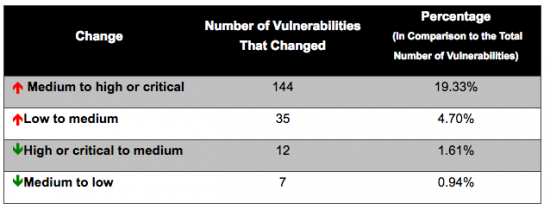
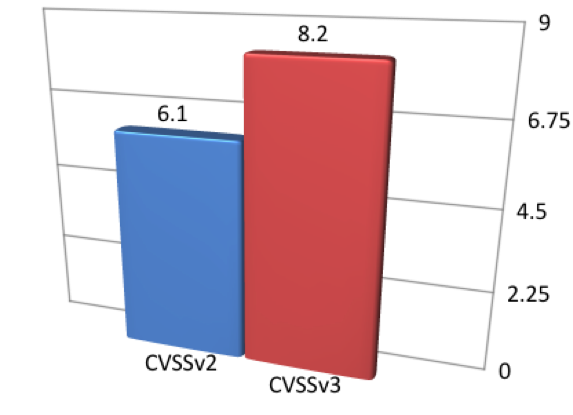
Score Increase from Medium to High or Critical
There were 144 vulnerabilities for which ratings increased from medium to high or critical. That represents 19.33 percent of all studied vulnerabilities, and 38 percent of the 380 medium-scaled vulnerabilities (under CVSSv2 scores). The average base score of these vulnerabilities was 6.1 with CVSSv2, with an increase to an average base score of 8.2 when the vulnerabilities were scored with CVSSv3, as shown in Figure 2:
Score Increase from Low to Medium
There were 35 vulnerabilities for which ratings increased from low to medium. That represents only 4.7 percent of all studied vulnerabilities, and 88 percent of the 40 low-scaled vulnerabilities (under CVSSv2 scores). The average base score of these vulnerabilities was 3.0 with CVSSv2, with an increase to an average base score of 5.5 when the vulnerabilities were scored with CVSSv3, as shown in Figure 3:

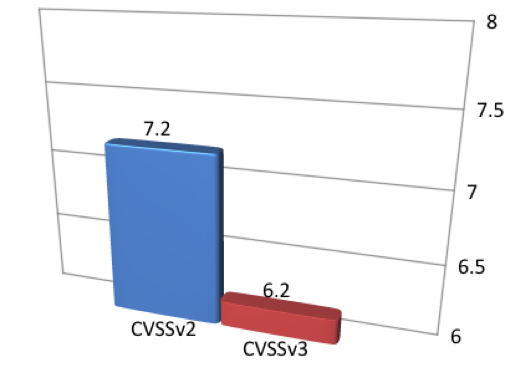
Score Decrease from High or Critical to Medium
There were 12 vulnerabilities for which ratings decreased from high or critical to medium. That represents only 1.61 percent of all studied vulnerabilities, and 4 percent of the 325 high-scaled or critical-scaled vulnerabilities (under CVSSv2). The average base score of these vulnerabilities was 7.2 with CVSSv2, with a decrease to an average base score of 6.2 when the vulnerabilities were scored with CVSSv3, as shown in Figure 4:
Score Decrease from Medium to Low
There were 7 vulnerabilities for which scores decreased from medium to low. That represents only 0.94 percent of all studied vulnerabilities, and 2 percent of the 380 medium-scaled vulnerabilities (under CVSSv2 scores). The average base score of these vulnerabilities was 4.3 with CVSSv2, with a decrease to an average base score of 3.6 when the vulnerabilities were scored with CVSSv3, as shown in Figure 5:

Types of Vulnerabilities
The types of vulnerabilities that had score increases or decreases were also interesting. In this study, I analyzed the Common Weakness Enumeration (CWE) identifiers assigned by NIST for each vulnerability. CWE is a standard maintained by MITRE that describes the software weaknesses of security vulnerabilities.
CWE IDs for Vulnerabilities That Changed from Medium to High or Critical
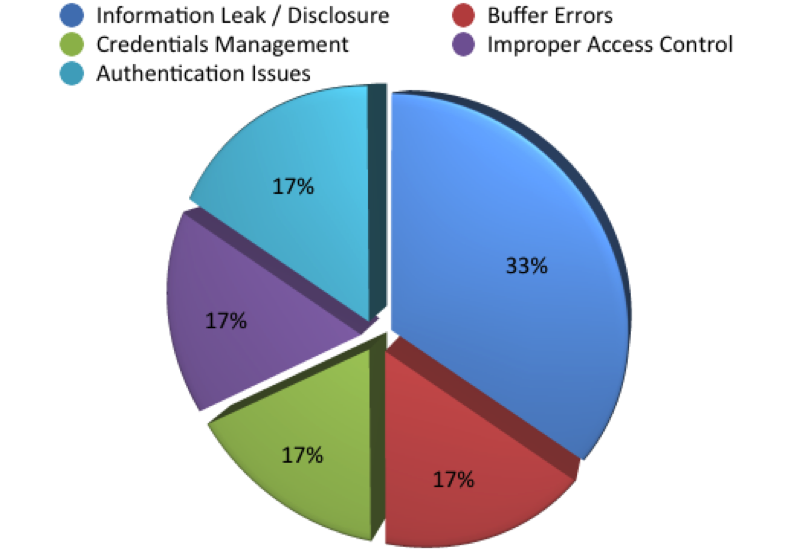
The most common weaknesses (CWE IDs) for the 144 vulnerabilities that changed from medium to high or critical were buffer errors and permissions, privileges, and access controls. Table 3 provides the details of the distribution of CWE types and the number of vulnerabilities with these weaknesses:
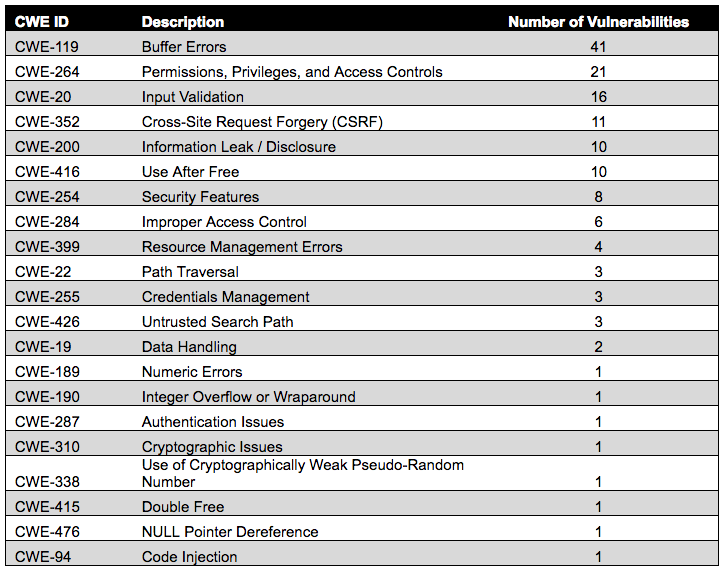
Figure 6 illustrates the distribution of CWE IDs for vulnerabilities that changed from medium to high or critical:

CWE IDs for Vulnerabilities That Changed from Low to Medium
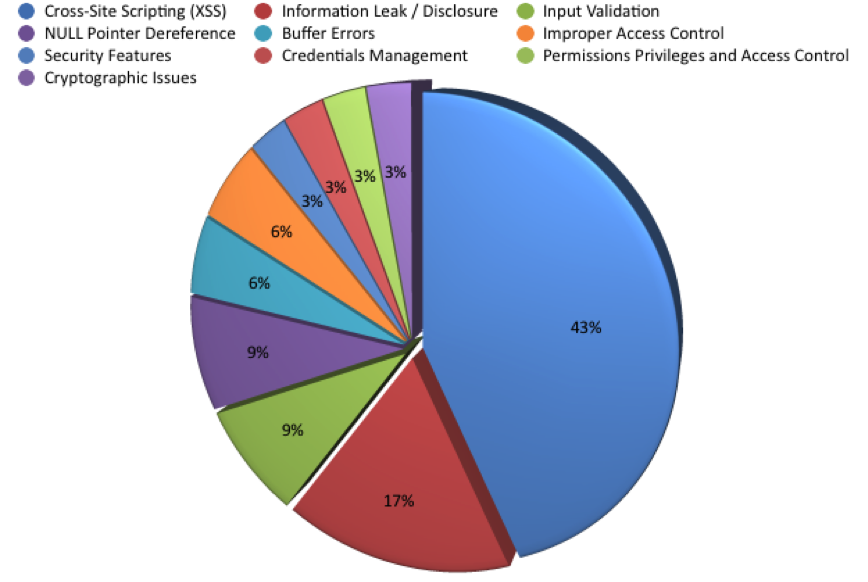
The most common weaknesses (CWE IDs) for the 35 vulnerabilities that changed from low to medium were cross-site scripting (XSS) and information leak/disclosure. Table 4 provides the details of the distribution of CWE types and the number of vulnerabilities with these weaknesses:
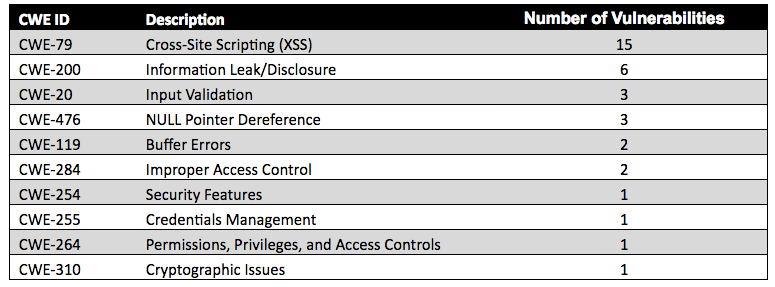
Figure 7 illustrates the distribution of CWE IDs for vulnerabilities that changed from low to medium:
CWE IDs for Vulnerabilities That Changed from High or Critical to Medium
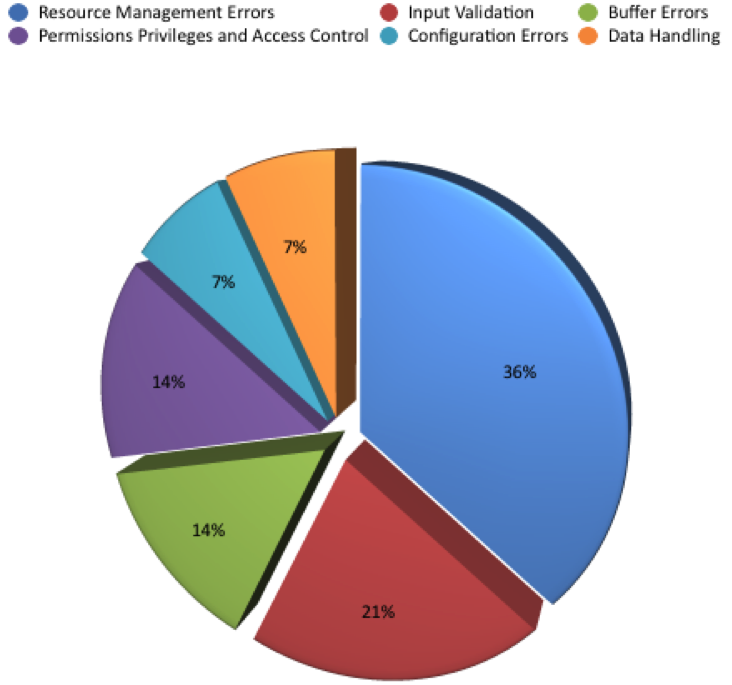
The most common weaknesses (CWE IDs) for the 12 vulnerabilities that changed from high or critical to medium were resource management errors and input validation. Table 5 provides the details of the distribution of CWE types and the number of vulnerabilities with these weaknesses:
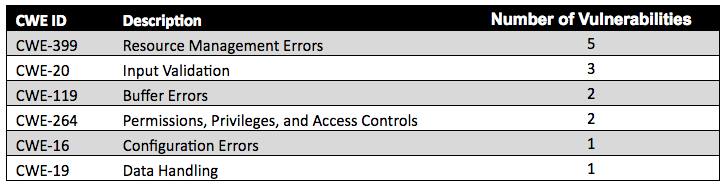
Figure 8 illustrates the distribution of CWE IDs for vulnerabilities that changed from high or critical to medium:
CWE IDs for Vulnerabilities That Changed from Medium to Low
The most common weakness (CWE ID) for the seven vulnerabilities that changed from medium to low was information leak/disclosure. Table 6 provides the details of the distribution of CWE types and the number of vulnerabilities with these weaknesses:
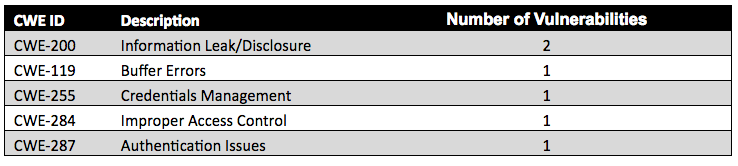
Figure 9 illustrates the distribution of CWE IDs for vulnerabilities that changed from medium to low:
Raw Data
I have uploaded all the raw data used in this study to GitHub at the following link/repository:
https://github.com/santosomar/CVSSv2VsCVSSv3
Conclusion
The CVSS enhancements mean that we will see more vulnerabilities being rated as high or critical throughout the security industry. You may ask yourself, was the industry analyzing and scoring the risk of vulnerabilities incorrectly or are we inflating the scores now? The answer lies in the fact that threats to security are evolving and advancing all the time. Threat types that were once a potential inconvenience could now have a greater impact on an organization. Our assessments of such threats and the appropriate level of response also needed to evolve.
The stakeholders at FIRST have done a great job in this new CVSS version to address some of the challenges we faced with its predecessor (CVSSv2). The new enhancements allow incident response, IT security, and cyber security teams to analyze the impact of security vulnerabilities to determine the urgency of response.
Cisco PSIRT will continue to adapt to enable our customers to assess and mitigate any risks in their networks quickly. Our mission is to do the right thing quickly, and to keep our customers protected.


Thanks Omar
this article is really useful when reading about FirePOWER Access control policy default actions.
Great Job, well done Omar !
Nice analysis, but I have an issue with the raw data, especially the change in meaning of the Access Vector.
In CVSS v3, a “Network” access vector is reserved for “network stack bound vulnerabilities”, and not anymore for malicious files or website based exploits. See for example https://www.first.org/cvss/examples#i16
Unfortunately, it seems that NVD is still using “Network” when it should actually use “Local”, inflating the score artificially. If it would follow the definition exactly, it actually leads to a decrease in score…
Would you have time to review your statistics and correct that bias? How does NVD stand about this definition/interpretation issue?
Thank you Stéphane! You highlight one of the reasons why I picked vendor-neutral data (NVD data in this case). A further story may be to do an analysis of how the industry (including vendors like Cisco) score the same vulnerabilities using CVSSv3, once it is more widely adopted.