
New learning labs and sandbox
As our journey through network automation grows, so does the need for our network tools. Network Engineers have always been considered the absolute escalation point for any performance difficulties and problems, irrespective whether the root cause is really the network, server, or application. Network Engineers are expected to have the knowledge and tools to isolate and identify the issue, collaborating with other teams such as SRE / AppDev to bring it to resolution and often present this in an RCA (root cause analysis).
One of these great tools which can really help is telemetry. In software, telemetry is used to gather data on the use and performance of applications and application components, e.g. how often certain features are used, measurements of start-up time and processing time, hardware, application crashes, and general usage statistics and/or user behavior.
In our network, the demands for data on network state — whether to detect hot spots in the network, or aid decision making on workload placement — requires data at a cadence that traditional methods just can not deliver. SNMP, CLI, and Syslog have limitations that restrict automation and scale. SNMP polling can often be in the order of 5-10 minutes, CLIs are unstructured and prone to change, which can often break scripts.
The traditional use of the pull model – where the client requests data from the network – does not scale when what you want is near real-time data. Moreover, in some use cases, there is the need to be notified only when some data changes, like interfaces status, protocol neighbors change etc.
Real-time access to operational statistics
Model-driven telemetry is a new approach for network monitoring in which data is streamed from network devices continuously using a push model and provides near real-time access to operational statistics. Applications can subscribe to specific data items they need, by using standard-based YANG data models over NETCONF-YANG. Cisco IOS XE streaming telemetry allows to push data off of the device to an external collector at a much higher frequency, more efficiently, as well as data on-change streaming.
We want more data, when do we want it? Now!
Listening to our community they asked for more model-driven telemetry content, as chance would have this I was working with Jeremy Cohoe (he wrote this awesome blog Getting Started With Model-Driven Telemetry). His blog formed the boilerplate for how the new learning lab and the new sandbox was built.
In the new Learning Lab Module, there are four new labs:
1. Introduction to Telemetry on IOS XE
Here you can learn about Telemetry Options, Publications Types, Data Encoding and TIG Software Stack. The TIG software stack refers to the three open-source software components that enable receiving, storing, and visualization the telemetry data.
- Telegraf (Collection) with the cisco_telemetry_mdt plugin that decodes the gRPC data to text
- InfluxDB (Storage): an open-source time-series database optimized for fast, high-availability storage and retrieval of time series data in fields such as operations monitoring, application metrics, Internet of Things sensor data, and real-time analytics. It provides a SQL-like language with built-in time functions for querying a data structure composed of measurements, series, and points
- Grafana (GUI visualization): an open-source platform to build monitoring and analytics dash
The YANG data models are found within the IOS XE operating system and can be exported easily from the NETCONF interface with tooling like YANG Explorer. Yang Explorer is an open-source web application which provides a web-based user interface to
- Browse yang data models
- Create netconf rpc payload
- Execute netconf RPCs
- Save RPCs to collections
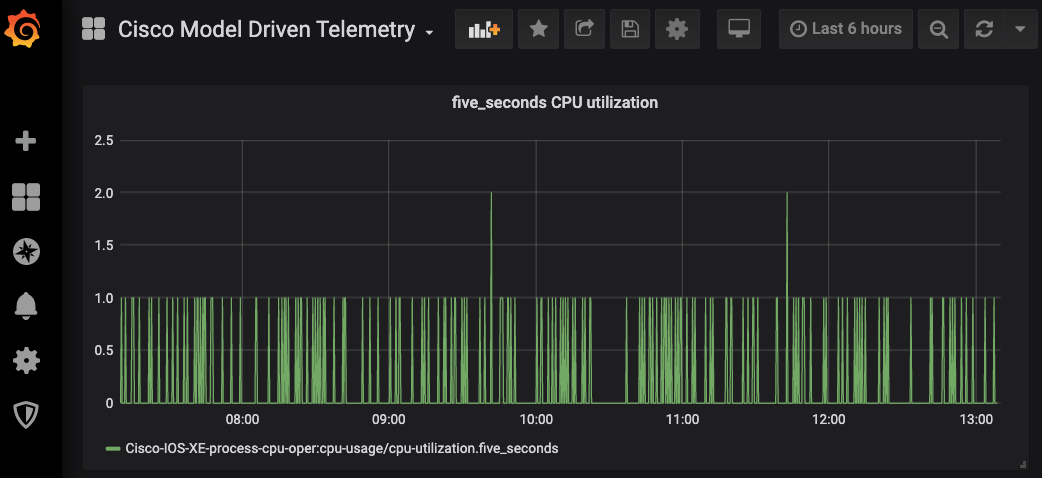
4. Building Grafana with increase Telemetry
We look how to verify and validate the existing configuration within Grafana, as well as how to add an additional telemetry subscription on IOS XE The reason for using Grafana is that it is an open-source metric analytics & visualization suite. It is most commonly used for visualizing time series data for infrastructure and application analytics but many use it in other domains including industrial sensors, home automation, weather, and process control. Here, Grafana is the visualization engine that is used to display the telemetry data. It calls into InfluxDB to access the data that is stored there, which is the same data that Telegraf received from IOS XE.
Experiment with Model-Driven Telemetry in the DevNet Sandbox
Try this for yourself ! Wherever you are on your network programmability journey, the new IOS XE Model Driven Telemetry learning lab is ready. In it, you’ll find all kinds of helpful information.
Before you begin, reserve an instance of the new Model-Driven Telemetry Sandbox. This sandbox is a development area for developers to experiment with Model Driven Telemetry on IOS XE, IOS XR, and NX-OS, and create their own consumers and transformers for their databases. With the telemetry sandbox you’ll be able to use the learning labs against live infrastructure to have a true hands-on experience with the technology.
Get your free DevNet account for access to developer resources, learning labs, and sandbox.
We’d love to hear what you think. Ask a question or leave a comment below.
And stay connected with Cisco DevNet on social!
Twitter @CiscoDevNet | Facebook | LinkedIn
Visit the new Developer Video Channel


