
PART 1: Introduction to Time Series
At Cisco, our partners and clients want ways to track and monitor their Cisco routers, switches, and other such devices. An important avenue of my work as part of the Customer Experience Data Incubation Team is to help track device utilization over time. One such way to think about how device utilization changes over time is to frame it as a time series. In this blog post, I will give a full break down of time series and ARIMA, why it is important, what it is, and how to use it – with a Cisco use case as well! This blog post will give a picture of some of the work the Data Incubation Team has done as part of the Customer Experience portfolio.
The blog is divided into 3 parts. Part 1 is an introduction to time series. Part 2 details a popular time series model called ARIMA. Finally, part 3 goes through the ins-and-outs of a Cisco use case involving memory allocation on devices. In the final blog, I detail how we thought about the problem from a data science perspective, going back to essential topics we covered in parts 1 and 2.
I. What is a Time Series?
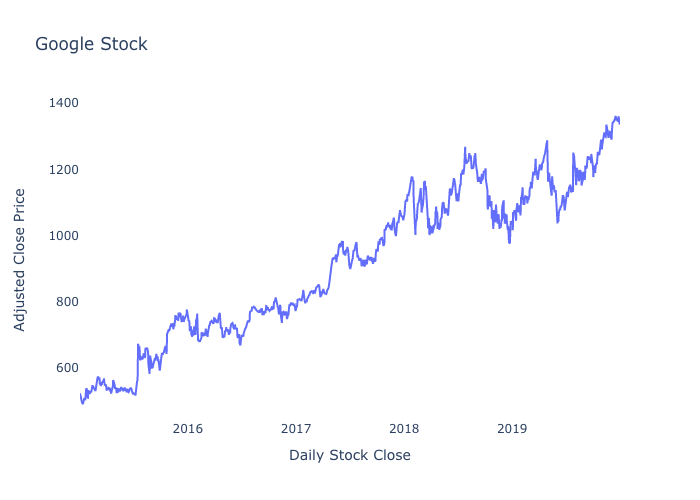
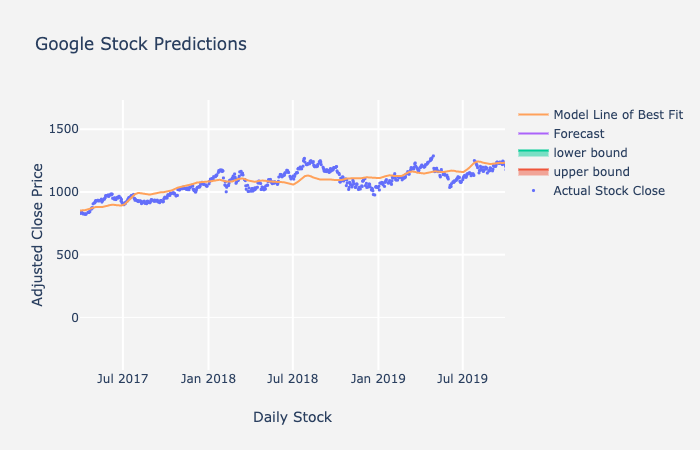
So, what is a time series? It’s actually a very simple concept. A time series is simply a set of values of the same entity observed over time, typically in equally spaced intervals. It can be monthly, yearly, weekly, daily, hourly, and by the minute. A few of examples of a time series include weekly gas prices, yearly temperature change, hourly passenger count on the subway, and any stock market app you look at. Below is an example of a time series using Google’s Stock. I will use this example for the majority of the blog.
II. Why Do We Care About Time Series?
So why is understanding time series data important? If you want to predict something in the future or understand trends over time, you will want to use time series analysis. For example, maybe you want to track sales and predict sales in the future. Maybe you want to breakdown your sales over time to see if there is a trend or cycle associated with it. Any sort of data tracked over time can be used for time series analysis! Below is another example of time series, which tracks the hourly bicycle count.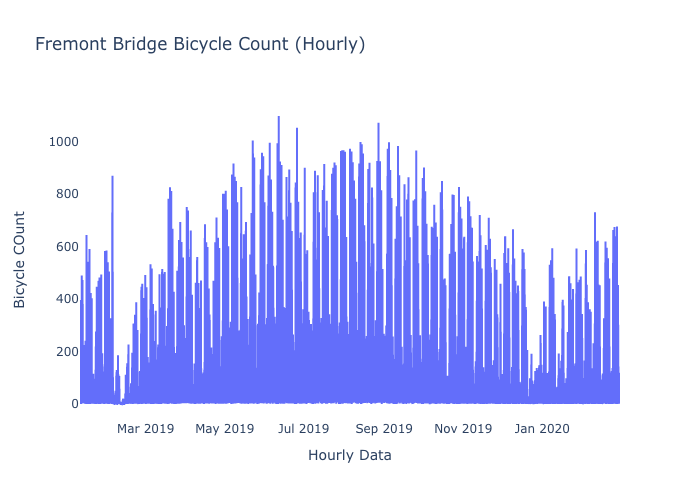
III. Components of a Time Series
Now that you know what and why of time series, let’s break down its components. This will be important when we start talking about ARIMA in the next post.
Let’s say you have your observed values, D. These observed values, D, can actually be broken down into 2 main components: Systematic components and Random components. Systematic components are data that can be forecasted, while random components are data that cannot be forecasted. I will break down both the systematic components and random components in a series of definitions below.
- Systematic Components, S – Data that can be forecasted. Systematic components can be further broken down into 3 parts.
- Level, L – It is the intercept of the straight-line approximation of the current observed values D, like a regression line or line of best fit. Level is generally used as initial input to forecast models.
-
- Trend, T – It is the slope of the rate of growth or decline of your observed values, D. This slope or rate will decline, incline, or be constant throughout the time series.
-
- Seasonality, S or Cycles – They are the predictable seasonal or non-seasonal fluctuations in your observed values, D. In other words, your data has seasonality if the data has variations that occur in regular intervals (weekly, monthly, etc.) throughout a year. For example, Nintendo Switch console prices and games lower every 3 months, then come back up after a week. This is considered a seasonal component.
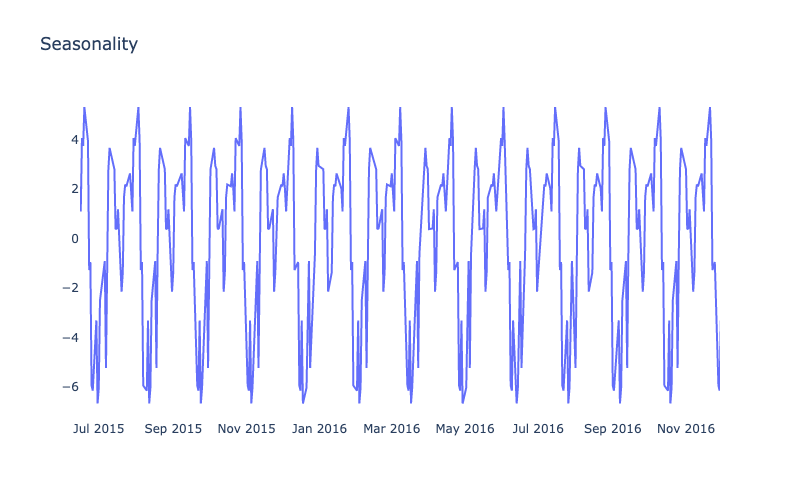
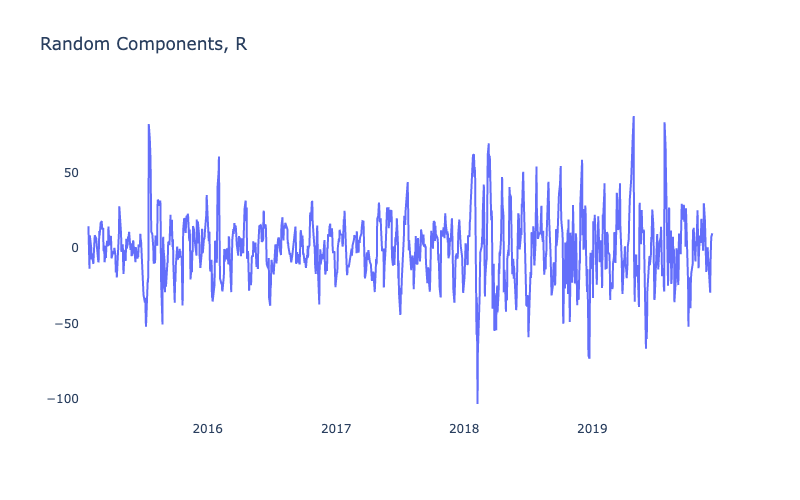
- Random Components, R – This might be anomalous behavior, irregularities in the data, and unexplained variation. These are all things that typically cannot be controlled, and they are inevitable in almost every dataset.
IV. Main Goals when Given Time Series
Now that you know what a time series is and the components, you may be wondering what you can do with it. When given a time series, you either want to decompose the components of your time series data or forecast and make predictions based on your data. Let’s talk about both techniques below.
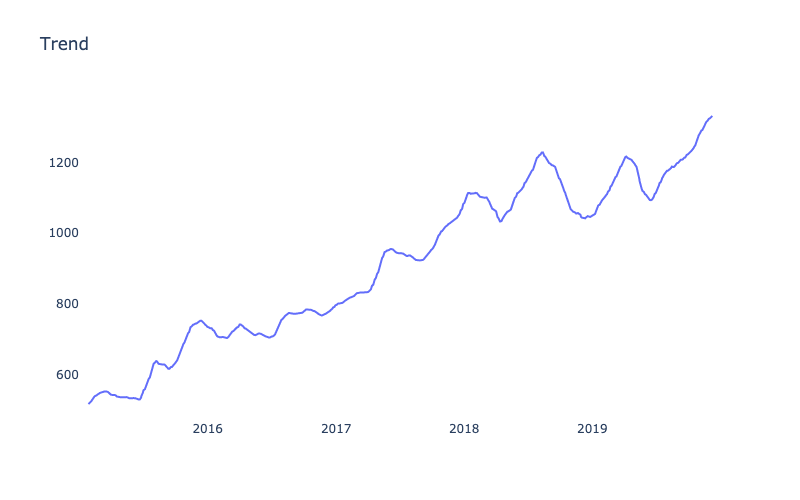
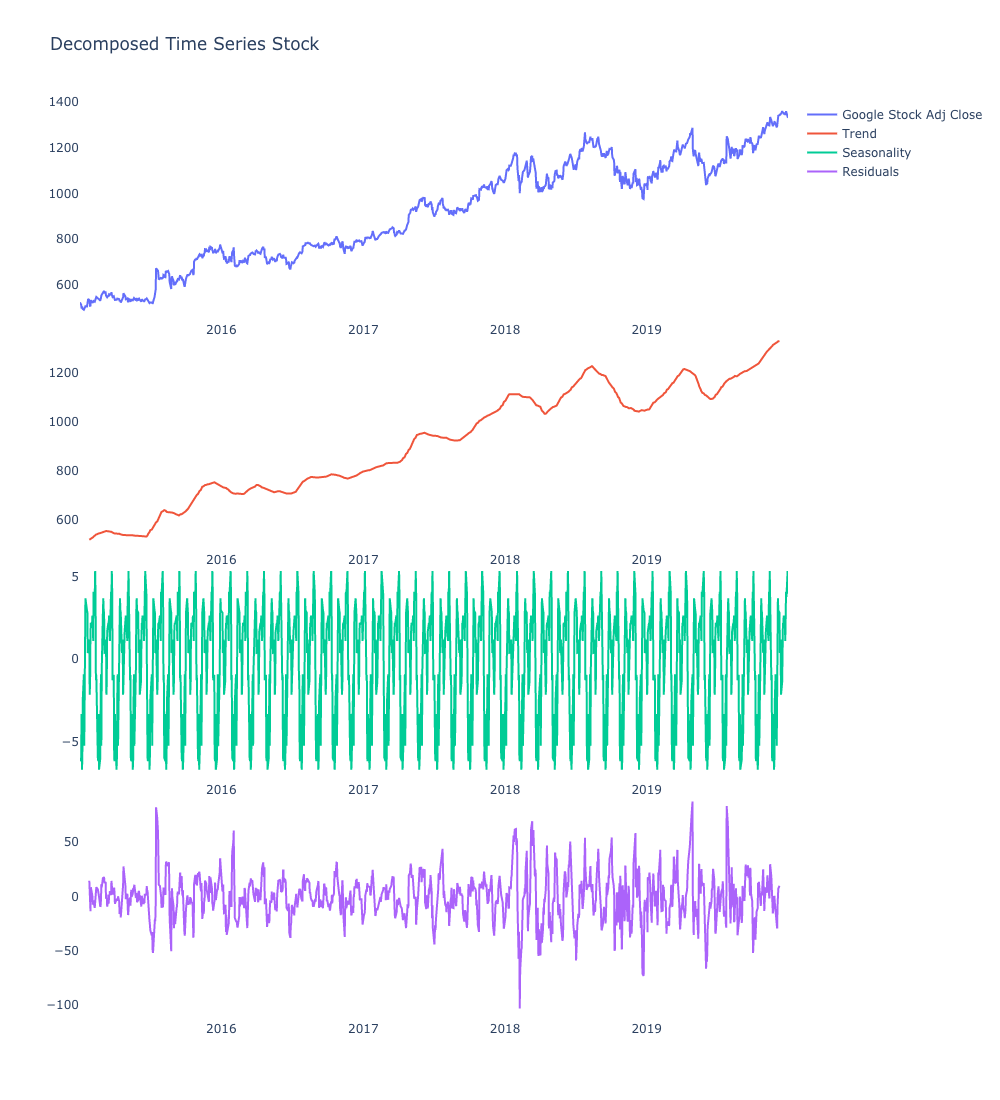
- Decomposition: This is the breakdown of data into sub-components, including trend, seasonality, and randomness and can be done to look at important parts of the time series. Maybe sales on your services have a seasonal or cyclical component to them and you want to use that to improve sales at a certain part of the season. That is where decomposing a time series can be helpful. You can visualize and identify specific factors and trends in your data that impact its growth or decline. Below is a breakdown of the components of Google’s stock.
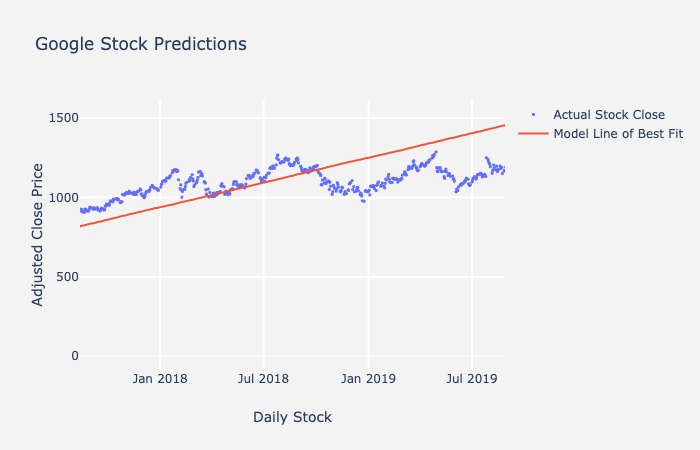
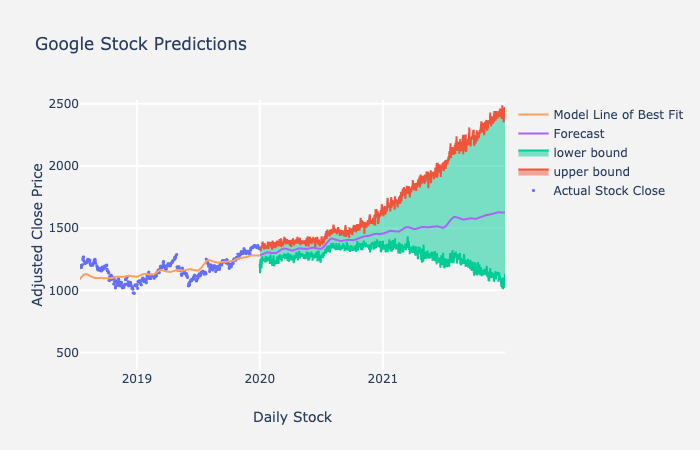
- Forecasting: Another goal of time series is forecasting the future. For example, you may want to predict when some hardware or device might crash in the future based on their historical data. This can help companies make proactive or preventative measures to fix the problem before it happens instead of reacting to the problem as it happens. As a result, this can save time and money for companies and clients. Below is an example of the forecast of Google stocks given its current seasonality, cycles, and trends.
V. Forecasting Rules of Thumb
Now that you understand some of the cool things you can do with time series, I will now go over rules that are critical to know if you want to do forecasts on your data.
Rule #1 – Always plot your data before, during, and after forecasting!
You always want to check how the data is distributed over time or how the model is forecasting by plotting the data. The process is quick and gives an idea on how to approach the problem or make adjustments to the model.
Rule #2 – You can only forecast the systematic components of the observed data – Level, Trend, Seasonality
You may not predict the future very well if you do not see any of those systematic components of trend, seasonality or cycles after decomposing your time series. There may be a promising project you work on that might have uneven and irregular data. For example, maybe the stock price swings if someone sends out an innocuous tweet. You can see the how that tweet impacted your time series by looking at the residuals or the random components. This type of swing may be something you will likely not be able to predict.
Rule #3 – The random components, R, cannot be predicted
As mentioned before, random components are sudden changes occurring in a time series which are unlikely to be repeated. They are components of a time series which cannot be explained by trends, seasonal or cyclic movements and they are usually not repeated. For example, during times of the coronavirus, stock prices were very volatile and while there was a general downward trend, much of the day-to-day activity was random. If your data only have random components, it will be harder for you to make an intelligent time series forecast.
VI. General Forecasting Techniques – Univariate Time Series
Now that you understand some important concepts for forecasting, I will outline two different forecasting techniques used as industry practice today, starting from simple regressions to smoothing.
- Regressions find a straight line that best fits the data. This is also known as static forecasting.
- EX: Least Squares (using linear regression)
- Smoothing determines the value for an observation as a combination of surrounding observations. This is also known as adaptive forecasting. ARIMA utilizes smoothing methods. Smoothing has additional tools that a simple regression does not have and makes modeling more robust. Smoothing techniques are more commonly used today, but regressions are often useful to get a general idea of how your data is moving.
- EX: moving average, exponential smoothing models, ARIMA models
I hope you enjoyed part 1 detailing what a time series is. In part 2 of this blog series, I will talk about ARIMA, an important smoothing model that is used extensively in time series forecasting and is considered common practice in industry.
Do you have any experience with time series analysis? Let me know in the comments!


Very informative article. Well done, Bradley and MD. thanks.