

Pratyusha Duvvuri is a Technical Lead on Cisco’s AI Engineering team, designing tokenomics and observability architectures that help enterprise teams scale AI usage with clarity and accountability.
In the previous blog, we showed how tokenomics became essential to managing AI spend at scale. Here’s how we operationalized it by building for the humans who actually use it.
The challenges of AI spend visibility
As AI adoption accelerated across Cisco, our spend visibility became critical. We needed a clearer view of where spend was going and who was driving AI adoption with finance control, budget accountability, and fewer surprises as usage grew. Across the company, usage was expanding — from developers using AI coding assistants to thousands of employees interacting with internal platforms, multi-provider API gateways, and on-premises GPU clusters. Costs were growing across multiple environments, and while we could see budgets being consumed quickly, we could not see the full story behind that spend. This is why tokenomics is a key priority for us at Cisco, and why being customer zero for Splunk Agent Observability is so impactful.
To operationalize tokenomics, we needed to address some fundamental challenges. Each provider had its own dashboard showing only one slice of our usage. We could not reliably connect cost changes to the people, teams, or business groups driving them — making it difficult to explain a spike, plan the next budget, or understand adoption growth. The real challenge was attribution: tracing every dollar to the right person, team, and business function.
- Providers also report differently. Some of our providers use direct cost and token counts; others use credits, seats, or allowances. Additionally, cost and adoption often came from separate APIs with different reporting windows, which caused the total in a provider dashboard to temporarily differ from the total available through its API while data is being reconciled.
- Cisco gives us a demanding customer-zero environment with a global workforce of roughly 90,000 employees and thousands of engineers using AI coding tools across five providers. That scale brings deeper management and finance hierarchies, more identity variation, and reporting questions that may not appear in a controlled pilot.
- Fragmented and diverse data sources from varied functions and roles. Tokenomics isn’t a single role’s responsibility; it is a true joint effort involving several personas. The problem wasn’t just fragmentation; it was that diverse data sources needed to be not only centralized, but delivered in ways that were usable for each unique function and role. For example, the insights needed for a Finance Analyst managing a cost center are very different to an Engineering Leader driving AI adoption.
Three roles essential to tokenomics
To build a solution that adequately serves the humans using it, we needed to start with the basics: Who needs to see this data, and why do they need to see it?
We identified three primary personas, each with distinct needs and requirements:
- Employees need to know how much they personally are using across providers, which tools and models they rely on, and how that usage is changing. Personal visibility helps employees plan their own usage and learn from their habits.
- Managers need to have a view that can answer team-centric questions: Is the entire team adopting AI, or only a few people? Which providers are driving cost, and is that usage delivering measurable productivity value? Does someone need additional access, or does part of the team need more guidance on how to get started? Importantly, is token spend translating into business impact?
- Finance needs a different lens entirely as their organizational structures rarely match the reporting lines used by engineering managers. To bridge that gap, finance needs a dedicated view to see which parts of the business are driving AI spend, how costs map to existing budgets, and the attribution required to evaluate AI investments and explain unexpected fluctuations.
These distinct personas and their requirements shaped how we built the solution.
Building for real users, in real time
When building the solution, we didn’t start with months of requirements gathering or a controlled lab pilot. We pressure-tested working software with Cisco IT and finance in two-week increments. Their feedback helped us learn what each persona needed and shaped both the experience and the technology behind it.
That iterative, feedback-centric approach let us test whether the product held up under real enterprise constraints. Those lessons shaped the milestones below.
Milestone one: Unifying provider data
Our first milestone was focused on creating a consolidated view across five providers, allowing a user to move between cost and adoption, follow cost trends over a selected period, compare providers and models, and investigate the users behind a change. This gave us a centralized way to answer: What are we spending, and are people using the tools available to them?
Bringing five providers into one view was only the beginning. Each provider defines usage differently. For example, one may report tokens and direct cost, another credits or seats, and another may separate activity from billing altogether. Their reporting windows do not always align, and totals can continue changing as providers reconcile their own data. So, a number can be accurate inside one provider’s dashboard and still be misleading when placed next to another provider’s number.
We needed a shared view that made comparison possible without stripping away the differences that explain what the numbers mean. Cost and adoption remain separate because provider activity does not always create an incremental charge. We also publish a reporting period only after the expected provider responses and feeds have arrived, and the result passes completeness checks. The dashboard keeps serving the last complete period. A delayed response or partial provider sync should not look like a real drop in usage.
Milestone two: Connecting usage to people and organizational hierarchies
Provider data describes accounts. Cisco operates through people, teams, reporting relationships, and access boundaries. Those worlds do not line up neatly. One employee may appear under several provider identities, while another account may not match the workforce directory at all. Teams reorganize, people change managers, and the organization continues moving while usage accumulates.
This enables four key capabilities:
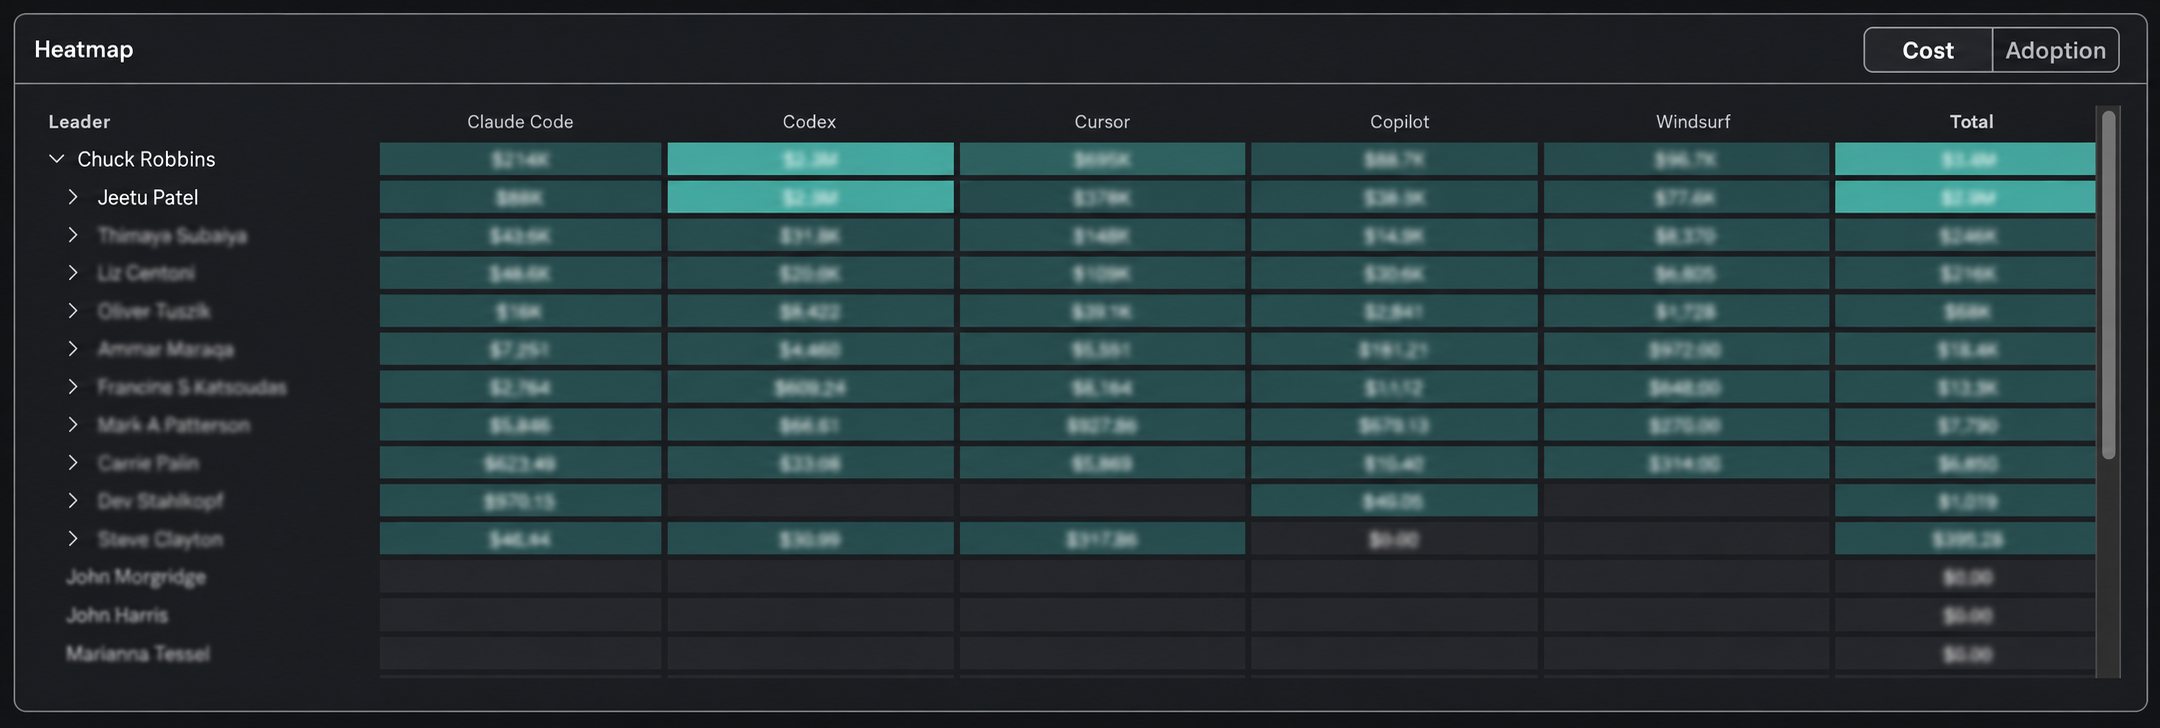
- Team-level visibility: A manager can see the entire permitted team in one view, including direct and indirect reports while preserving subtotals for each branch. Within the Splunk Agent Observability heatmap, authorized leaders can compare cost or adoption across providers and drill down to see where a change originated.

The team rollup supports navigation through the reporting hierarchy while keeping provider comparisons in view. Sensitive values and names are lightly blurred. - Identity resolution: An identity resolution layer reconciles known provider accounts to a single employee record, preventing several accounts from inflating adoption. The query layer uses that identity map to assemble management rollups within the viewer’s authorized scope. If an account cannot be matched, its usage remains visible as unattributed. That keeps the enterprise total honest while making the attribution gap explicit.
- Access controls: Personal, team, and organization-wide views carry different access boundaries. A manager sees only the permitted reporting branch, while organization-wide access requires separate authorization. The interface reflects that scope, and the service enforces it for every request.
- Change management: A reporting view must remain internally consistent while the directory changes beneath it. We treat each directory update as a complete snapshot. A replacement is validated before it becomes active, and the previous valid snapshot continues serving if the replacement cannot be used. For the first release, historical usage follows the current hierarchy. In response to customer requests, we are exploring effective-dated hierarchy tracking so usage can be viewed against the organization as it existed when the activity occurred.
Milestone three: Building the finance view
Finance introduces another form of complexity. The management hierarchy answers who reports to whom. The finance hierarchy answers where the budget belongs. Those structures may overlap, but they are not interchangeable, and they can change on different schedules.
The same AI activity therefore needs two valid organizational interpretations: one for leaders understanding their teams and another for finance understanding ownership of spend. We use department information to connect those views while preserving them as separate structures. Cisco IT and finance are using this internally as we prepare for General Availability.
What makes this work difficult is the combination: inconsistent provider accounting, identities that do not map cleanly to people, organizational structures that keep changing, different access boundaries, and a finance model that does not follow the management tree.
Cisco gives us the scale and real production conditions to confront those problems together in Splunk Agent Observability.
Visibility is about empowerment, not policing
At enterprise scale, managing AI spend is not an accounting problem—it’s an empowerment problem. Raw token counts tell you what an API charged; they don’t tell you if your AI strategy is actually creating value. If tracking feels like surveillance, adoption stalls. If costs remain invisible, budgets break.
The breakthrough comes when cost data is delivered in the context of how people actually work. By mapping fragmented provider metrics directly to real organizational hierarchies, we are turning an unmanageable stream of usage data into actionable clarity across all three personas:
- For engineers: Transparent personal visibility that builds model literacy and smarter tool selection, allowing developers to experiment freely without fear of mystery bills.
- For managers: Clear team-level attribution that separates intentional productivity gains from idle drift, giving engineering leaders the empirical data to advocate for bigger AI budgets.
- For finance: Direct, continuous alignment between dynamic technical usage and hard budget lines, replacing end-of-quarter invoice shock with predictable attribution.
Inside Cisco, our Customer Zero experience is proving that you don’t have to choose between financial discipline and developer velocity. When you replace blunt usage caps with trusted, human-centered attribution, AI ceases to be a volatile expense—it becomes an accountable, scalable engine for innovation.
As we expand our deployment across more models and workflows, we will continue sharing what we learn from production.
Resources