Security teams have spent years living with dashboards built for the people who installed the network. Tunnels, connectors, throughput, policy sync status — useful signals if your job is keeping infrastructure alive. Less useful when a CISO asks why a user was exfiltrating data at 2 a.m. or which GenAI tools are touching your IP.
SASE platforms solved the enforcement problem. Traffic flows through a single control plane. Policies span internet and private access. The architecture is right. The operational experience has not kept pace.
The Missing Surface: Security Context
Ask a SOC analyst what they need from a security platform and you get consistent answers. Start with a user, see everything about them. Lead with threats, not tunnel counts. Make the dashboard clickable — every number should open an investigation, not just display a statistic.
What they describe is not a new product. It is a different frame on the one they already use.
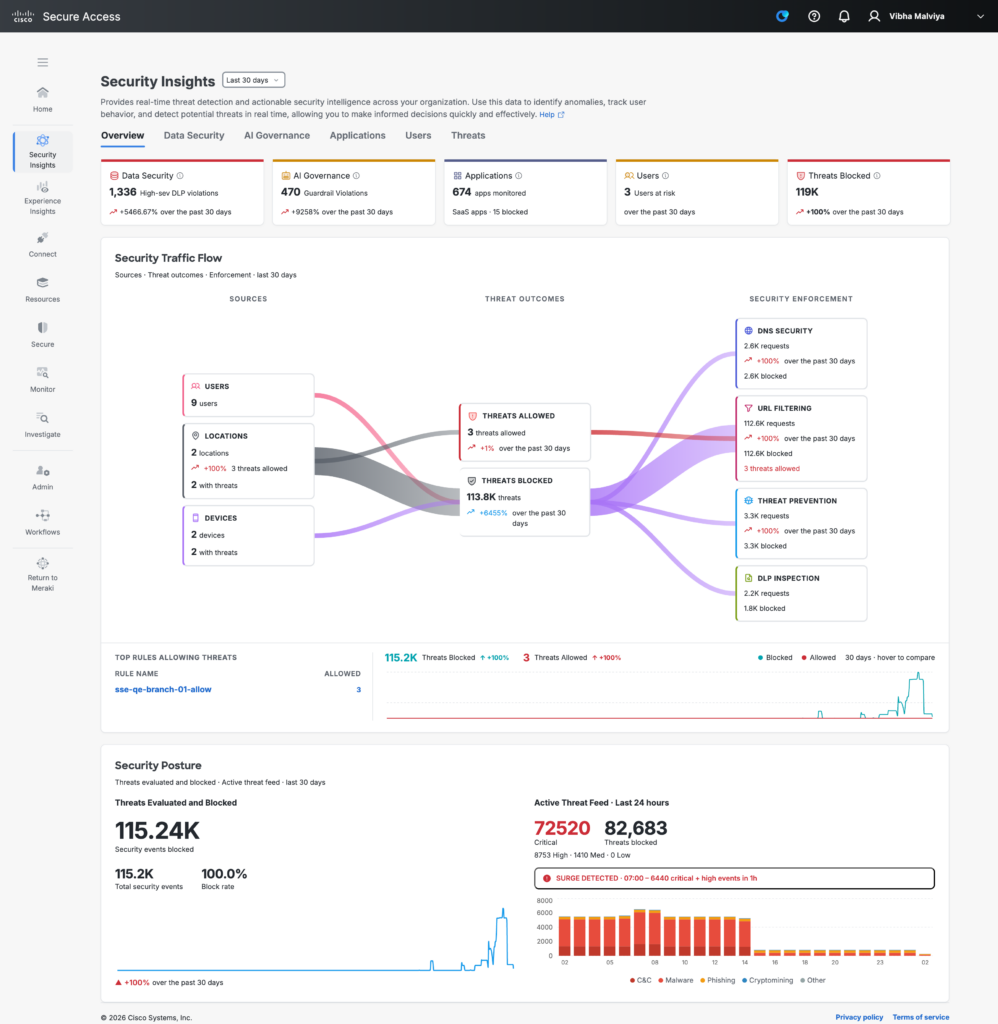
Cisco Secure Access now includes Security Insights: a security analytics dashboard that surfaces where risk is concentrated, helps teams identify emerging threats and policy gaps, and gives security leadership the trend data to report on posture and measure the impact of initiatives over time.
Threat Overview: The SOC Landing Page
A security admin starts their shift. Before navigating anywhere, they need one answer: is something dangerous happening right now?
The Threat Overview is designed to answer that quickly. Status cards surface the key metrics at a glance — the macro layer that signals whether something demands immediate attention.
Below the status cards, a Sankey chart maps traffic flows across security controls — and this is where the dashboard earns its keep.
The obvious read is which threats are being blocked. The more important read is what is getting through. The Sankey makes allowed threats visible at a glance — traffic that is reaching destinations it should not, because a policy has not yet been written to stop it. An analyst watching that chart can see the gap before it becomes an incident and adapt policy directly in response.
The Sankey also shows what is not there. Controls that are not deployed, or not inspecting certain traffic categories, appear as gaps in the flow. Security teams can see which protective measures are in place and which are not — without pulling a configuration report or running a separate audit. That kind of coverage visibility used to require a dedicated tool. Here it is a single chart on the landing page.
Aggregated Signals That Tell You Where to Look
Security Insights does not try to replace an investigation workflow. It tells you where to start one.
Every section surfaces ranked, aggregated analytics oriented around the questions security teams actually ask. Who are the riskiest users right now? Which users have the most DLP violations? Which resources are accumulating the most threat events? Which GenAI applications are active in the organization and which are producing guardrail violations?
These are not individual user profiles. They are the ranked signals that direct attention — the top of a list that tells an analyst which thread to pull. A security team looking at top DLP violators by channel can see immediately whether the problem is concentrated in email, web traffic, SaaS APIs, or endpoint activity. That narrows a day’s worth of investigation into a starting point.
The same pattern holds across every view. Top malware detections by family. Top intrusion attempts by signature. Top risky destinations by access volume. Top rules blocked by policy. The aggregation is the insight — not raw log volume, but ranked, weighted signals that reflect where risk is actually concentrated in the environment.
AI Visibility Without a Separate Product
GenAI adoption in enterprise environments has outpaced governance everywhere. Tools are being used before policies exist. Sensitive data is entering prompts without classification.
Secure Access addresses this through the AI view, which tracks GenAI application usage and guardrail violations alongside the rest of security operations. The key widgets show which GenAI applications are active, how usage trends, and where guardrail violations are accumulating — broken down by violation type and policy rule.
This is part of the CASB capability that Cisco includes in the platform. Understanding SaaS risk, governing AI tools, and inspecting data flows into GenAI applications are not add-on licenses. They are part of the security story, visible in the same place where the analyst reviews threats and posture.
One Platform, One Investigation Workflow
Security Insights brings together signals that have historically lived in separate products or separate tabs: UEBA trust levels, DLP violations, posture check results, CASB app risk, Talos-backed threat data, and policy enforcement outcomes. The value is not any one of these signals in isolation. It is the ability to move between them without switching tools — and to see, in one place, both what your controls are catching and what they are not.
Security Insights gives analysts the signals to start an investigation, security managers the view to close policy gaps, and leadership the trends to report on posture over time — all from within a single SASE platform.
To see Security Insights, request a demo at cisco.com/go/secure-access.
We’d love to hear what you think! Ask a question and stay connected with Cisco Security on social media.
Cisco Security Social Media