At Cisco Live EMEA 2026, the Security Operations Center (SOC) operated under a simple mission: Protect / Detect. Educate. Innovate.
To support this mission, we eliminated one of the most persistent challenges in tiered SOC environments, friction during escalations between investigation platforms.
Tier 1 and Tier 2 analysts operated in Cisco XDR, while Tier 3 analysts conducted advanced investigations in Splunk Enterprise Security (ES). Historically, escalations required manual pivoting, context reconstruction, and platform switching, introducing inefficiencies. To solve this, we engineered a bidirectional integration between Cisco XDR and Splunk ES that:
- Automatically detects escalation status changes in XDR
- Transforms incidents into fully structured ES investigations
- Includes observables, AI summaries, and analyst notes
- Generates native ES alerts with threat topology context
- Synchronizes case closure back into XDR
- Notifies stakeholders via Webex for shared visibility
- Links ES investigation in the XDR Incident Worklog
The result was a seamless, automation-driven escalation workflow that preserved investigation context, reduced analyst friction, and unified the SOC across platforms, without requiring Tier 3 analysts to leave Splunk. Also, leveling up the skills of the escalating Tier 1 /2 analysts, by sharing the Tier 3 notes and case link in the XDR Incident and Webex notification.
Introduction
One of our core objectives was: Safeguard the Cisco Live network from threats and malicious actors, both internal and external, while enabling seamless collaboration across analyst tiers.
To understand the broader SOC architecture and tooling deployed at the event, check out the blog “Cisco Live Amsterdam 2026: XDR + Splunk ES” by Jessica Oppenheimer & Ivan Berlinson, which outlines the full design and operational model.
This post focuses on how we bridged Cisco XDR and Splunk Enterprise Security to streamline escalations, eliminate friction, and create a true bidirectional workflow between platforms.
The Escalation Gap and Challenges
Our SOC followed a traditional tiering structure:
- Tier 1 / Tier 2 analysts
- Triage and investigate incidents in Cisco XDR
- Perform enrichment, correlation, and early containment steps if necessary
- Escalate complex cases
- Tier 3 analysts
- Handle advanced investigations
- Perform deeper pivoting and correlation
- Operate primarily in Splunk Enterprise Security
As stated in Jessica and Ivan blog, a major goal for EMEA 2026 and our SOC was breaking down the silos between “triage / investigating” and “threat hunting / incident response”. One of the main challenges we’ve had was escalation efficiency and how to bridge the gap.
Before this integration there were two major obstacles for information sharing, when a Tier 1/2 analyst determined an incident required Tier 3 expertise.
Obstacle 1: Manual Pivoting
The Tier 3 analyst would often do the following:
- Open the incident in Cisco XDR
- Extract observables manually
- Search those observables in Splunk
- Read through the XDR worklog notes
- Reconstruct investigation context
This process introduced a couple of issues:
- Platform switching
- Manual copy/paste effort
- Context fragmentation
- Risk of missed intelligence
- Slower response time
In a live SOC environment, those inefficiencies could compound quickly.
Obstacle 2: Cisco Security Cloud App for Splunk
The Cisco Security Cloud App allows ingestion of XDR incident into Splunk and the ability to promote them into a notable event. While useful, we encountered practical limitations:
- No granular selection mechanism (promotion primarily score-driven)
- Observables are embedded inside a large description field, which requires extra parsing to extract meaningful entities.
In short, while some of the context is there, it’s not actionable or suitable for our use case.
The Objective of this Integration
If a Tier 1/2 analyst decides an incident should be escalated from Cisco XDR, the Tier 3 should immediately see a fully structured investigation in ES, with complete context, without needing to open XDR.
And because one of the SOC’s core missions was Innovate, we built it.
From Escalation Signal to Investigation
We started by defining a simple convention for escalation. When Tier 1 and Tier 2 analysts required Tier 3 involvement, the analyst would change the incident status in Cisco XDR to “Open: Reported”. That status change became the trigger for us on the Splunk side.
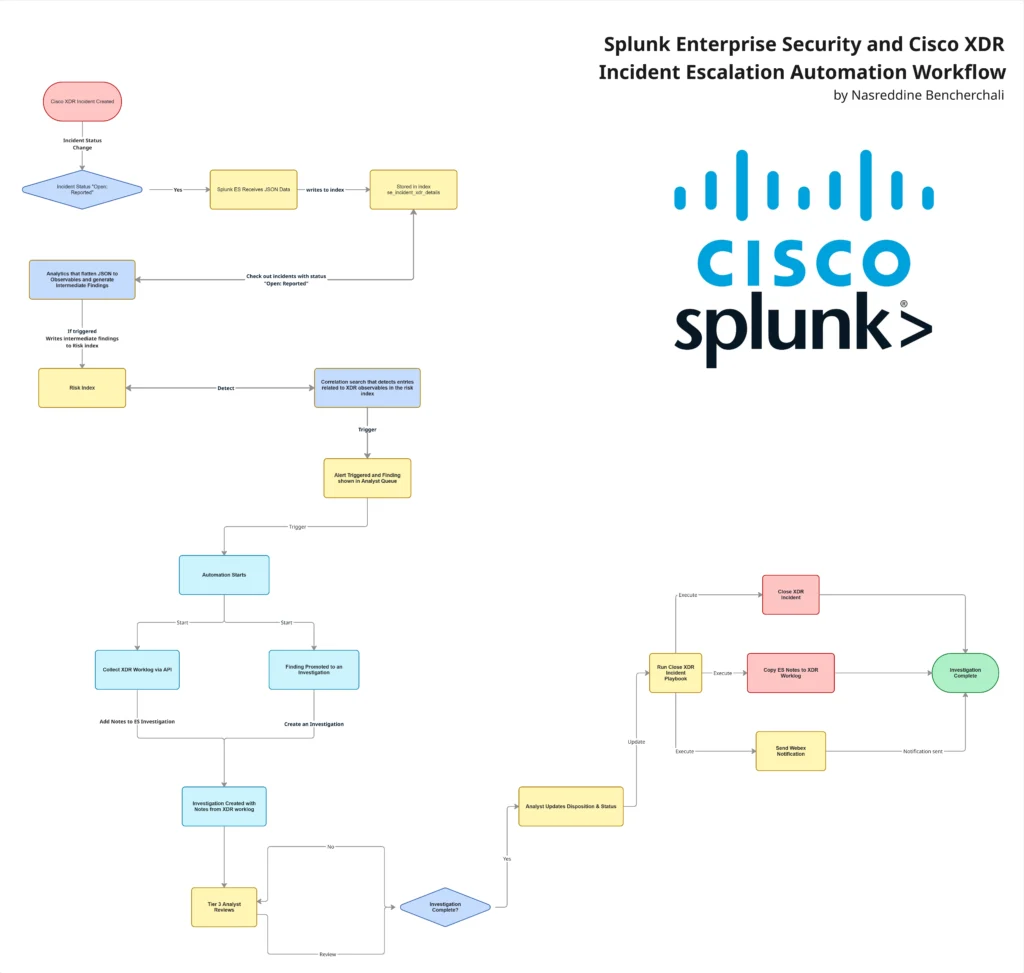
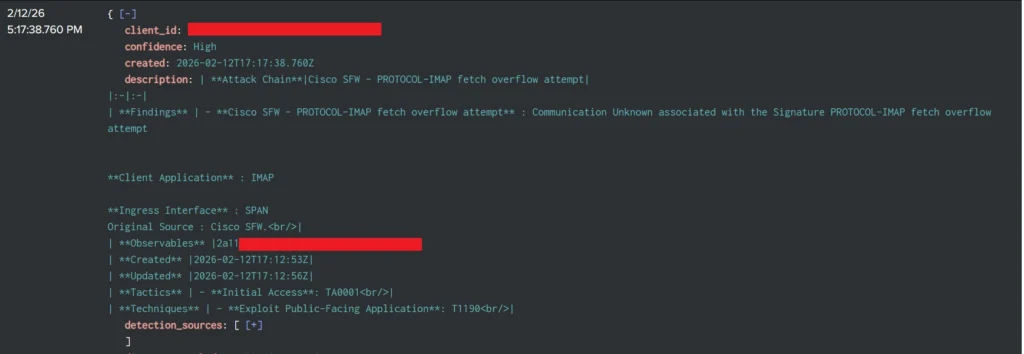
Behind the scenes, we built an automation workflow in Cisco XDR that sends XDR incident summaries to an HTTP Event Collector (HEC) via the API endpoint “/v2/incident/{incident-id}/summary”
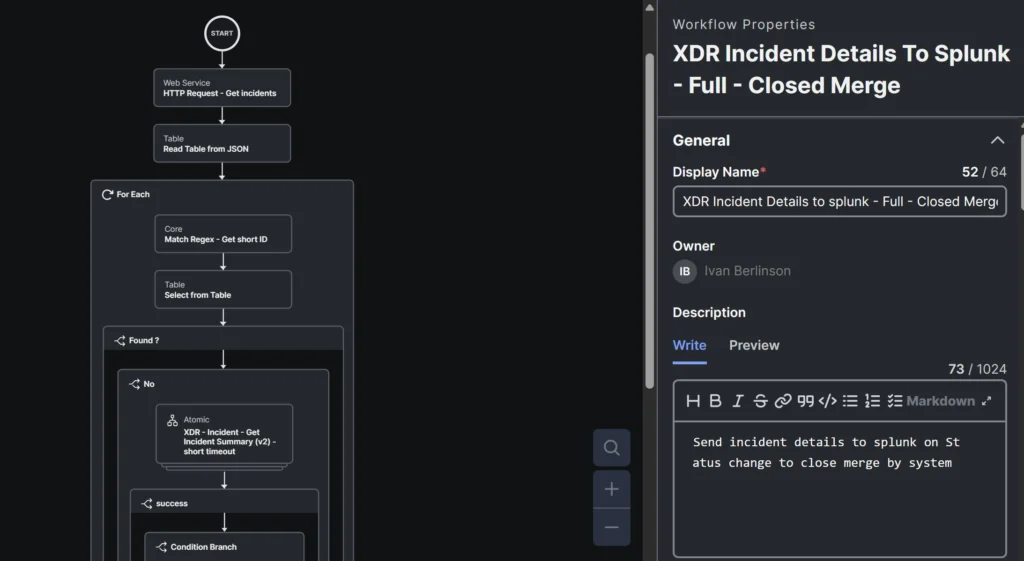
This API endpoint provides the full incident summary, consolidated into a single structured response, which includes observables, indicators, and details among other things. The workflow polls regularly and react to status changes, ensuring that when an incident is moved to “Open: Reported”, its complete context is sent to Splunk.
Once in Splunk, the goal is not just to “create an alert” but to transform the XDR incident into a native ES investigation. To achieve this, we built two analytics that work together.
Observables Extraction
The first analytic type looks for escalated incidents (“Open: Reported”) and focuses on observables and indicators. It flattens the data, groups it by incident ID, and generates a Splunk ES Intermediate Finding / Risk for each observable.
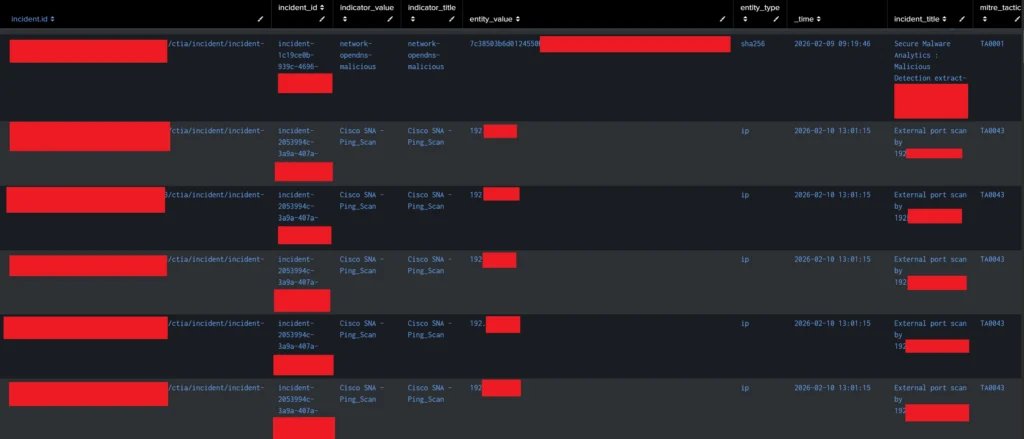
The above example illustrates what flattened observables looked like. At this step we also define “Threat Object” which are just the observables in this case. This will allow us to populate the “Threat Topology” view later in ES Mission Control.
Alert Generation
The second analytic is a correlation search that looks for entries from the previous search in the risk index. Once found, a finding is generated where the risk entity is the “incident_id”.
This allows us to have a single alert per incident, where the observables act as intermediate findings and are automatically associated with it.
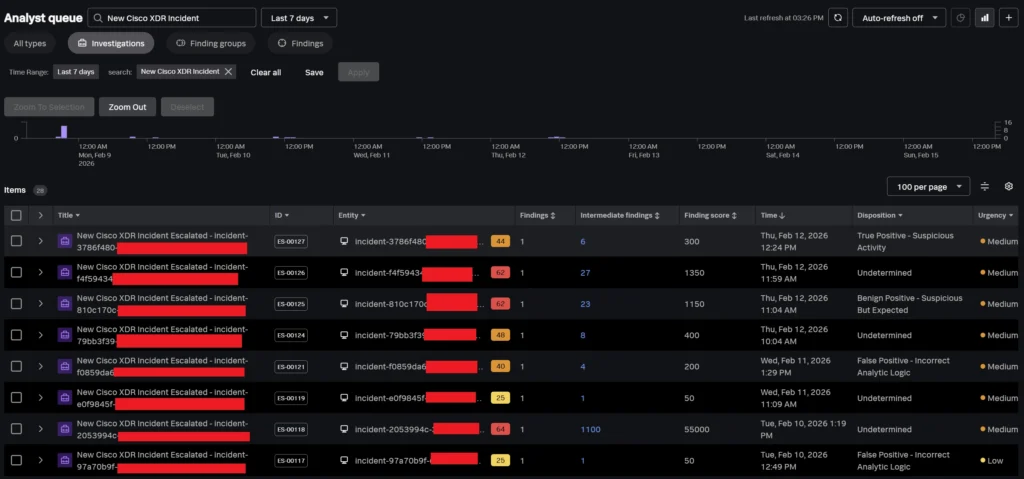
At this point, we have successfully reflected the XDR escalation as a formal ES alert. But technically, this isn’t a new alert, but a continuation of an ongoing case. So, we must move it to an Investigation.
Who Doesn’t Love a Bit of Automation
While what we achieved was already a great step, we wanted to take it a bit further. For this, we leveraged Splunk SOAR and we built a new playbook that does two main things:
- Promote the finding into a dedicated “ES Investigation”
- Copy the Cisco XDR incident worklog (with all analysts’ notes and AI-generated incident summary) to the ES Investigation notes view
For this, we leveraged both the ES and Cisco XDR APIs and associated these playbooks with the finding analytic via the “Automation Rule” view in SOAR. Below is what this looks like in practice.
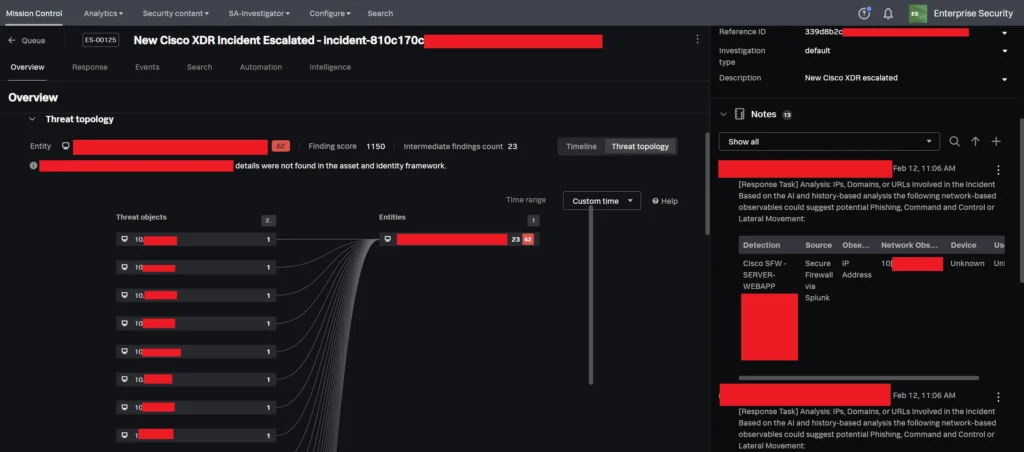
Now when a Tier 3 analyst opens the case in Enterprise Security, they have:
- All observables as Threat Objects that they can pivot on and apply threat intel
- The AI summary from XDR
- Analyst reasoning in the form of Notes
Closing the Loop
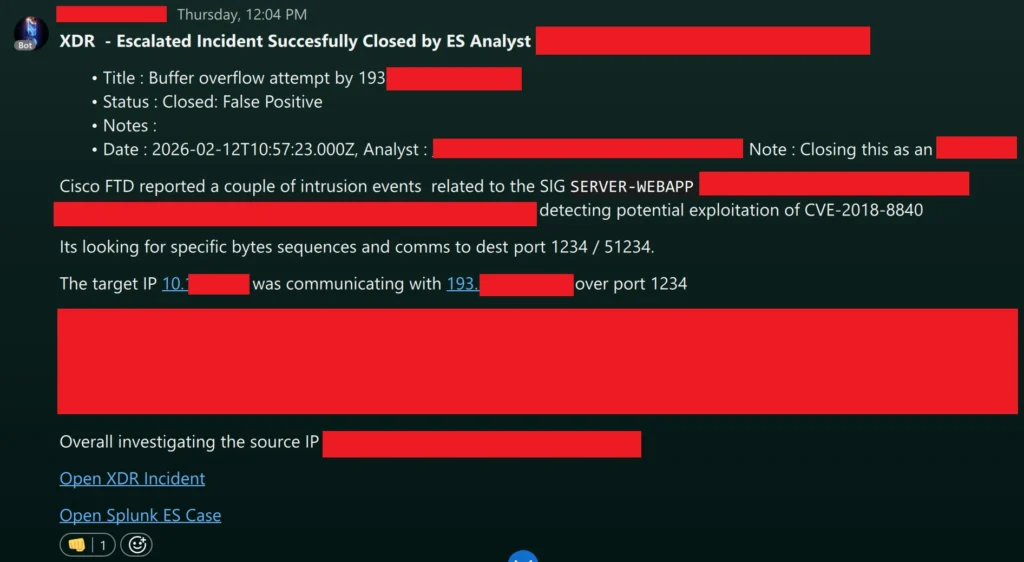
To close the loop, we’ve implemented a last Splunk SOAR playbook that can be run on demand by the Tier 3 analyst once the investigation is complete. When the analyst updates the status and disposition in Splunk, the playbook leverages the XDR API to send details to the corresponding incident in Cisco XDR. This creates bi-directional synchronization between platforms. On the XDR side, we’ve built an automation workflow for closed escalated incidents that also generates a Webex notification containing information about said incident and links to both XDR and ES so that reinforces collaboration and shared learning across tiers.
Conclusion
By bridging Cisco XDR and Splunk Enterprise Security, our aim was to eliminate manual context transfer, reduce platform switching, and create a true continuation of investigation model across analyst tiers.
Hopefully by reading this far, you got out with an understanding of how automation, and thoughtful workflow design, can break down operational silos and improve both analyst experience and response efficiency.
Check out the other blogs from our SOC team in Amsterdam 2026.
We’d love to hear what you think! Ask a question and stay connected with Cisco Security on social media.
Cisco Security Social Media