The Internet of Everything will have far-reaching effects in a multitude of industries over the next few years. There will be an estimated 50 billion devices and objects connected to the internet by 2020. The movement toward an increasingly connected world is already transforming operations in the retail, finance and healthcare industries. The government is also seeking ways to harness the potential benefits of IoE, and one sector that anticipates gaining significant operational benefits from IoE is defense.
My colleague Cindy DeCarlo gave an excellent overview of how IoE is facilitating the vision of net-centric warfare. Mike Hodge further highlighted this transformation, emphasizing the benefits IoE can bring specifically to new smart and connected bases around the world. Today, I want to dig a little deeper and call attention to one branch of the military that is taking advantage of IoE to operate more efficiently and increase operational success in multiple areas: the Navy.
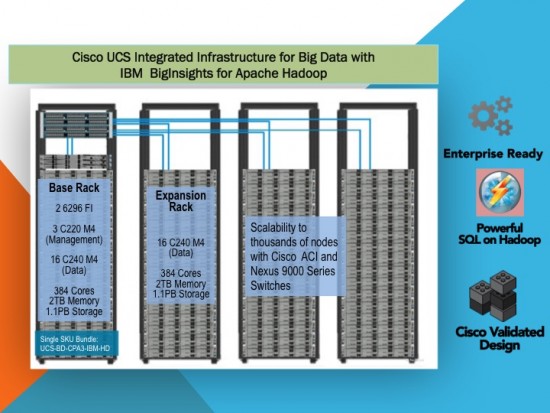
In December 2014, we announced VersaStack, an integrated infrastructure reference solution for enterprise applications that combines technologies from Cisco and IBM. Further extending this partnership, today we are announcing support for IBM BigInsights for Apache Hadoop on our Cisco UCS Integrated infrastructure for Big Data – an industry-leading platform widely adapted for enterprise big data application deployments. The joint solution encompasses disruptive innovations in Cisco UCS and the robust and industry-compatible Apache Hadoop distribution from IBM. This solution can be installed as a standalone Hadoop cluster with powerful analytical tools or can be integrated into existing VersaStack deployments that will benefit from a common fabric and unified management capabilities to deliver the deepest possible insight into your data to help you gain a sustainable competitive advantage.
We are also announcing the availability of Cisco Validated Design (CVD) that provides step by step design guidelines comprehensively tested and documented to help ensure faster, more reliable and predictable deployments at lower total cost of ownership.
Highlights:
Combines innovations from Cisco UCS such as programable infrastructure with best of open source software with enterprise-grade capabilities in IBM BigInsights for Apache Hadoop
Designed and optimized for common use cases, pre-tested, pre-validated and fully documented by Cisco and IBM engineers to ensure dependable deployments that can scale from small to very large as workload demands
Provides enterprises with extensive platform management and data visualization capabilities and integration of big data with other information solutions to help enhance data manipulation and management tasks
Brings the power of SQL to Hadoop at the performance and scale ever than before accelerating data science and analytics leveraging SQL – arguably the most beautiful programming language – and integration with business applications to access data stored in HDFS and HBase with JDBC and ODBC
Deep technical expertise, global resources, and world-class support and services from Cisco, IBM and partners
This solution is built on Cisco UCS infrastructure using Cisco UCS 6200 Series Fabric Interconnects and Cisco UCS C-Series Rack Servers optimized for IBM BigInsights for Apache Hadoop with scalability to thousands of nodes with Cisco Nexus 9000 Series Switches:
Infonetics Research recently released a study that claims businesses (just in North America alone) lose as much as $100 million a year due to network downtime. Let us dissect that into numbers you and I can relate to.
On average, businesses suffer from 14 (CA Technologies) to 87 hours (Gartner) of downtime per year.
A conservative estimate pegs the hourly cost of network downtime at $42,000 (Gartner).
The cost of unplanned downtime per minute is between $5,600 and $11,000 (Ponemon Institute).
MTTR (mean time to resolution) per outage, on average, is 200 minutes (ITT Process Institute).
For a quick/rough calculation of your own potential revenue lost, use this equation provided by North American International Systems (NASI).
LOST REVENUE = (GR/TH) x I x H
Where:
GR = gross yearly revenue
TH = total yearly business hours
I = percentage impact
H = number of hours of outage
Service costs are rarely zero.
Most businesses associate network downtime with major events or security breaches, but such isn’t always the case. Their own employees could induce it too. For many, that was the case every September. This blog is not about a challenge, but a growth hacking opportunity (transformed from an IT challenge). Continue reading “iOS 9 – A Growth Hacking Opportunity Awaits”
Yesterday, Chuck Robbins tweeted that we hit our 1000th customer – Danske Bank, the largest financial institution in Denmark.
Our fast momentum and success with the Nexus 9000 (N9K) and ACI is largely due to our continued focus on customer needs – both now and well into the future. And our broad ecosystem of industry leaders has been and is committed to deliver integrated solutions for our mutual customers.
Just a little over three years ago, the team behind the N9K and ACI – Insieme Networks – began by listening to a variety of customers on what their business requirements were at the time and into the foreseeable future. What we learned is that modern enterprises were looking for an application-centric approach using open standards to deliver today’s business services.
Five years ago when it was created, the UN Commission for Digital Development stated that “the digital divide continues to be a development divide that must quickly be bridged.” Since then, huge progress has been made in closing the digital divides in the adoption of information and communication technologies (ICTs), particularly telephones and the Internet. A new potential digital divide may be emerging, however, in the adoption of machine-to-machine (M2M) deployment and services, a key element in the Internet of Things and the Internet of Everything.
The latest data from the Broadband Commission’s 2015 State of Broadband report launched this week, shows the gap in the adoption of telephones falling rapidly, particularly as mobile telephones spread across the world. In 2005, mobile penetration in the developed world was over three times higher than in developing countries (82% versus 23%). By 2015, this gap has closed significantly with mobile penetration at 121% in developed countries and 92% in developing countries. While larger gaps remain in broadband Internet (mobile and fixed) subscriptions, higher growth rates for both technologies in developing countries point to the same conclusion: overall, developing countries are catching up with developed countries in a range of ICTs.
According to Cisco’s 2015 Visual Networking Index (VNI), we now stand at a clear digital tipping point – by 2019, the number of people connecting to Internet will be 3.9 billion, reaching over 51% of the global population. As over one billion additional people connect to the Internet over the next five years, over 10.2 billion new devices (smartphones, tablets, sensors, etc.) will come online at the same time, growing from 14.2 billion in 2014 to 24.4 billion in 2019; and 10.5 billion of these will be M2M.
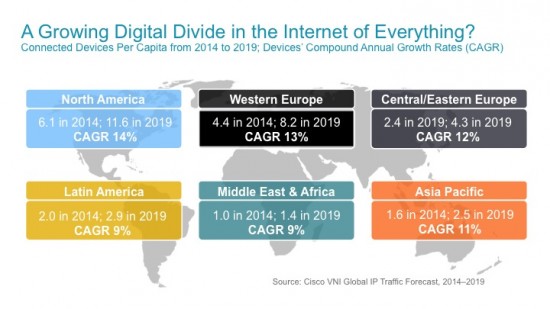
This ‘good news’ story, however, masks an emerging digital divide in this next phase of the Internet, which will be characterized by a growing number of connected devices of all kinds. In North America, there were 6.1 networked devices per capita in 2014 with a forecast of 11.6 devices per capita by 2019 (a CAGR of 14% in total devices). In Western Europe, the number will be 8.2 devices per capita by 2019, up from 4.4 devices per capita in 2014 (13% CAGR). However, in Latin America, there were only 2.0 connected devices per capita in 2014, with an expected rise to 2.9 by 2019 (9% CAGR), and in the Middle East/Africa region, growth is expected to be similarly slow growing from only 1.0 connected device per capita in 2014 to 1.4 by 2019 (9% CAGR as well).
The contrast across regions in M2M devices is even more stark. While globally, over 43% of all devices in 2019 will be M2M, advanced regions of the world are ahead of the curve. In the UK, M2M devices will account for 48% of all devices by 2019. In Australia the share will be 54%; the US it will be 58%; Japan 68% and in Korea, 72%. By comparison, in most developing countries the number of M2M devices are still at a nascent level: In India, only 13% of all devices by 2019 will be M2M, across Africa and Middle East, the share will be only 17%, in South Africa it will 22%; Brazil and Mexico will be 32%.
Why does this matter? While developing countries are catching up in basic ICT penetration, this growing gap in connected devices and M2M connections may point to big differences in how societies are utilizing, and benefitting from, the Internet and the next generation of the digital transition. For example, network effects and externalities that multiply the impacts of ICTs require minimum adoption thresholds before those impacts begin to materialize, and the greater the intensity of ICT use, the greater the impacts on economic growth (even beyond saturation levels of penetration).
It is important to recognize the global success in advancing the adoption of ICTs, particularly telephones and the Internet, around the world. Private sector telecom investment supported by smart government policies fostered infrastructure development to the extent that now over 90% of the world’s population is covered by mobile telephone signals.
We must continue the push for greater access and adoption of ICTs among lower-income groups to further accelerate income gains at the base of the economic pyramid. Policy action should focus on preventing and bridging this emerging digital divide in M2M and connected devices, achieved through partnership and private sector investment, enabled by conducive business environments and crafted by pro-innovation and pro-investment government policies. As the 2015 State of Broadband report highlights, more needs to be done to accelerate the adoption of ICTs and total connected devices and close the gaps between developed and developing countries, as well as high-income and low-income populations.
You’ve heard us talk about the move from the Information Age to the digital age and how the rapid change associated with this movement will transform the way business is done at a global scale.
The primary driver for this revolution will be The Internet of Everything (IoE)—the next big phase of the Internet. Poised to generate over $19 trillion in value at stake for businesses and countries over the next decade, IoE encompasses shifts in computing such as big data, cloud, BYOD and mobility, and a new breed of software applications that will increasingly strain enterprise and service provider networks alike.
To become industry disruptors and take full advantage of the Internet of Everything, organizations will need to rethink how they do business. They will need to reimagine the role technology plays in their business and make it a strategic asset.
In my role as President of Cisco Capital, the captive finance business within Cisco, I speak with customers and partners globally of all sizes, across different markets and that have different business needs. In almost every conversation, a common challenge arises – how do they to do more with less and keep pace with technology innovation? It’s a good question, and one that doesn’t have a one-size-fits all answer.
The release of CMX 10.2 is just around the corner and brings with it the new Path Analysis Widget. Path Analysis provides a new way of investigating your data. Not only can you view the amount of visitors to an area, now you can see how they got there and where they went afterwards. To help introduce you, we’ve put together some simple but beneficial use cases outlining its utility and power.
Path Analysis Use Case – Quantifying Instant Customer Attraction
Certain areas within a location, such as casinos, will hold an expected or sometimes unexpected instant attraction (visitation from when people enter the location) to visitors. This can be deliberate or natural depending on the circumstances and nature of the location. For example a casino desires to maximize the time visitors spend in the gambling section of their location and so the layout of the building as well as signage, advertising etc. will aim to increase the instant attraction. From when people enter the reception of the Casino it hopes that they will immediately visit the Gambling Area. Using CMX Analytics Path Analysis we can easily quantify the instant allure of an area from when people enter the building. Continue reading “CMX 10.2 Analytics – The Path Analysis Widget”
Several recent cyber attacks have served as great reminders that we need to continue to re-assess how we are protecting our networks and ensure that we make no assumptions of any device being secure in the network.
One example of this is “SYNFul Knock,” a type of persistent malware that allows an attacker to gain control of an affected Cisco device and compromise its integrity with a modified Cisco IOS software image. The attack did not leverage any product vulnerabilities, and was shown to require valid administrative credentials or physical access to the victim’s device. Cisco customers can find more information and resources about SYNful Knock in the SYNful Knock Event Response Page. One can easily say, “Hey, they would need console access and valid credentials in order to successfully upload new firmware.” In the old days we had a saying, “He who owns the console, owns the system.” That used to be true when the consoles were not connected to terminal servers, essentially giving anyone physical access over the network. One thing that can be certain is that for someone to upload firmware into a router, they definitely had a reliable “Point of Persistence.”
Another recent high profile attack, although there have not been any confirmed detailed reports on how the attack occurred, included indications that the attackers may have achieved firm “Point of Persistence” in the network by compromising a printer. When I say persistence in this case, I mean by order of magnitude in duration as indicated by the plethora of information that was leaked. I am intentionally leaving out links and references here and I encourage interested readers to do their research to confirm the “loosely regarded” information. What we do know is that as an industry is that we have known about the risk of printers being compromised in our networks. I just don’t think anybody viewed the risk of printers being used as a pivot point for cyber attackers at the time.
As a member of the Clinton Global Initiative (CGI), Cisco is committed to creating and implementing innovative solutions to the world’s most pressing challenges. In partnership with other global leaders, we’re tackling new issues every year, from closing the IT skills gap to creating new economic opportunities for individuals worldwide.
This year, nonprofit leaders, influential CEOs, and diplomats will come together at the CGI Annual Meeting under the theme of “The Future of Impact,” where they’ll collaborate to turn inspiring ideas into real-world results.
Together, CGI members have made more than 3,200 Commitments to Action, which have improved the lives of over 430 million people in more than 180 countries. Through countless public-private partnerships, we are preparing people around the world with the skills, technologies, and resources they’ll need to thrive in a connected world.
Through both our CGI commitments and our own Corporate Social Responsibility (CSR) program, we’ve learned what works to speed the pace of social change in communities worldwide:


 Written by Ian Mc Garry, CMX Software Engineer