 Written by Ian Mc Garry, CMX Software Engineer
The release of CMX 10.2 is just around the corner and brings with it the new Path Analysis Widget. Path Analysis provides a new way of investigating your data. Not only can you view the amount of visitors to an area, now you can see how they got there and where they went afterwards. To help introduce you, we’ve put together some simple but beneficial use cases outlining its utility and power.
Path Analysis Use Case – Quantifying Instant Customer Attraction
Certain areas within a location, such as casinos, will hold an expected or sometimes unexpected instant attraction (visitation from when people enter the location) to visitors. This can be deliberate or natural depending on the circumstances and nature of the location. For example a casino desires to maximize the time visitors spend in the gambling section of their location and so the layout of the building as well as signage, advertising etc. will aim to increase the instant attraction. From when people enter the reception of the Casino it hopes that they will immediately visit the Gambling Area. Using CMX Analytics Path Analysis we can easily quantify the instant allure of an area from when people enter the building.
We set up a simple Path Analysis widget that looks at the data for the casino zones last week. Setting the Reception as the focus allows us to view the paths taken from it to other zones within the Casino.

From this chart we can see that 32% of visitors who enter the Reception then go straight to the Card Tables. Path Analysis shows immediate visitation and so we can say that 32% of visitors were immediately attracted to the Card Tables upon entering the Reception area. This may be lower than what was expected and so appropriate measures, such as more advertising, can be undertaken and then measured for their success. If the casino measures this value for 4 weeks and each week the value fluctuates between 30-34% they can say that the immediate visitation is on average 32%. They can then go on to place advertising and quantify its effectiveness – by measuring while the advertising is in place. If the visitation goes up to 42% on average we can show that the advertising provided a 10% improvement on visitation.
Path Analysis Use Case – Identifying Visitor Ports of Entry
Some locations within a building, such as an airport, may have multiple ports of entry or access routes. For the owners of the building, identifying which entry the visitor utilizes may provide value. For example in an airport nearly all visitors will end up at Flight Gates. The airport desires to maximize the visitation to the duty free shopping area before reaching the gates. To achieve this they may restructure the airport layout, improve signage or even run offers. Using CMX Analytics Path Analysis widget we can easily identify the visitation to the Duty Free area immediately before visiting the gates.
We set up a simple Path Analysis widget that looks at the data for the airports zones last week. Setting the Flight Gates as the focus allows us to view the paths taken to reach the Flight Gates.
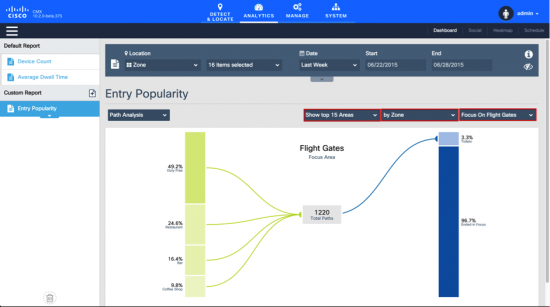
From this we can see that a lot of people do in fact go to the flight gates after having just been in the Duty Free. This may be due to the composition of the airport, offers being run, signage running through duty free or any number of other reasons but now changes we make to the allure of duty free can be positively/negatively measured using CMX Analytics.
Path Analysis is another powerful widget that is newly introduced with CMX 10.2. These simple use cases can show you how to get started. We look forward to hearing how you put this new widget to use in your location!