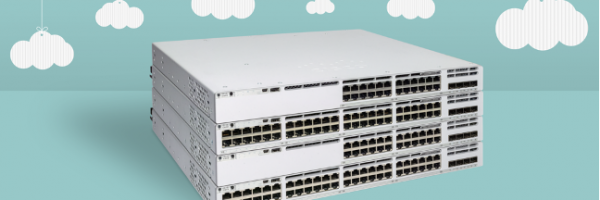
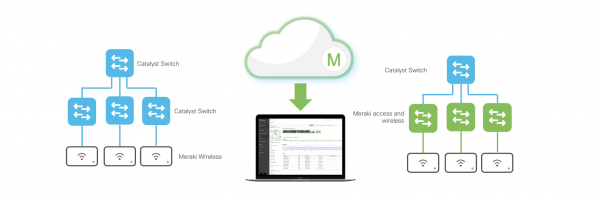
With the introduction of Cloud Monitoring for Catalyst Wireless, Cisco Catalyst customers can now gain visibility into traffic flowing across their access networks via the Meraki dashboard. The expansion of Catalyst 9300-M switching portfolio means
Have you been wanting to remotely troubleshoot your Catalyst switches in the cloud? Wait no more! Read on to learn about the latest and greatest troubleshooting features available today in the Meraki dashboard.
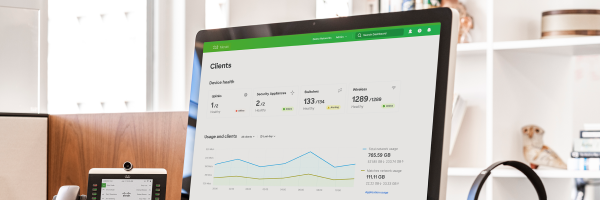
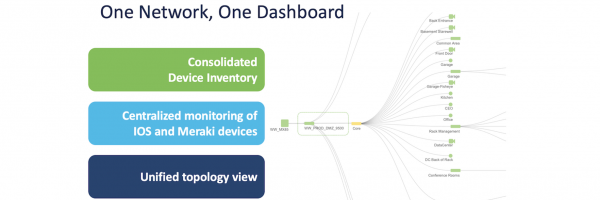
Visualizing your entire network is incredibly important for many reasons. In this blog, I'm going to walk you through a cloud-monitored Catalyst 9000 switch and give a high-level overview of the Meraki dashboard.
How do you know if Cloud Monitoring for Catalyst is right for your environment? We explore a unified view of Cisco network infrastructure, device health and troubleshooting, as well as network client and traffic information.
Explore the advantages of cloud-managed networking, find resources to help you onboard cloud monitoring for Cisco Catalyst switches, and get your questions answered at our Nov 15 webinar.
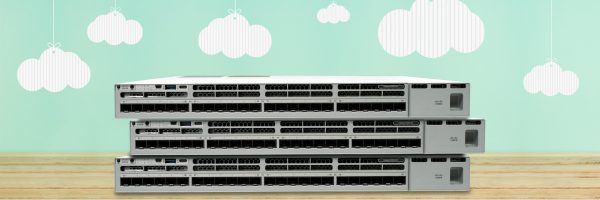
Do you have Cisco Catalyst 9k Switches that you just monitor individually via CLI? You can onboard them into the Meraki dashboard for visibility and troubleshooting.
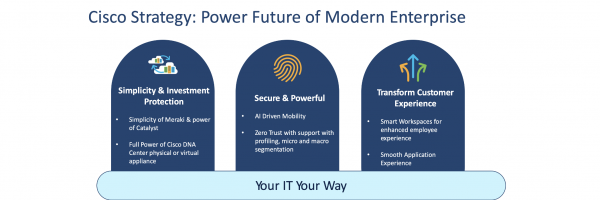
Join me and Catalyst wireless product management director, Shail Talati, to discuss how Cisco is providing greater flexibility, investment protection, and a better network management experience to IT organizations everywhere.