Cisco Catalyst (IOS-XE) coming to the Meraki Cloud is finally here, and we couldn’t be more excited to share that you can try it out today. This was first announced during the June Cisco Live; today, it’s available, and you can try it out now.
If this is your first time learning about this capability, cloud monitoring allows existing and new Cisco Catalyst customers to onboard and monitor Cisco Catalyst 9000 series switches using the Meraki dashboard.
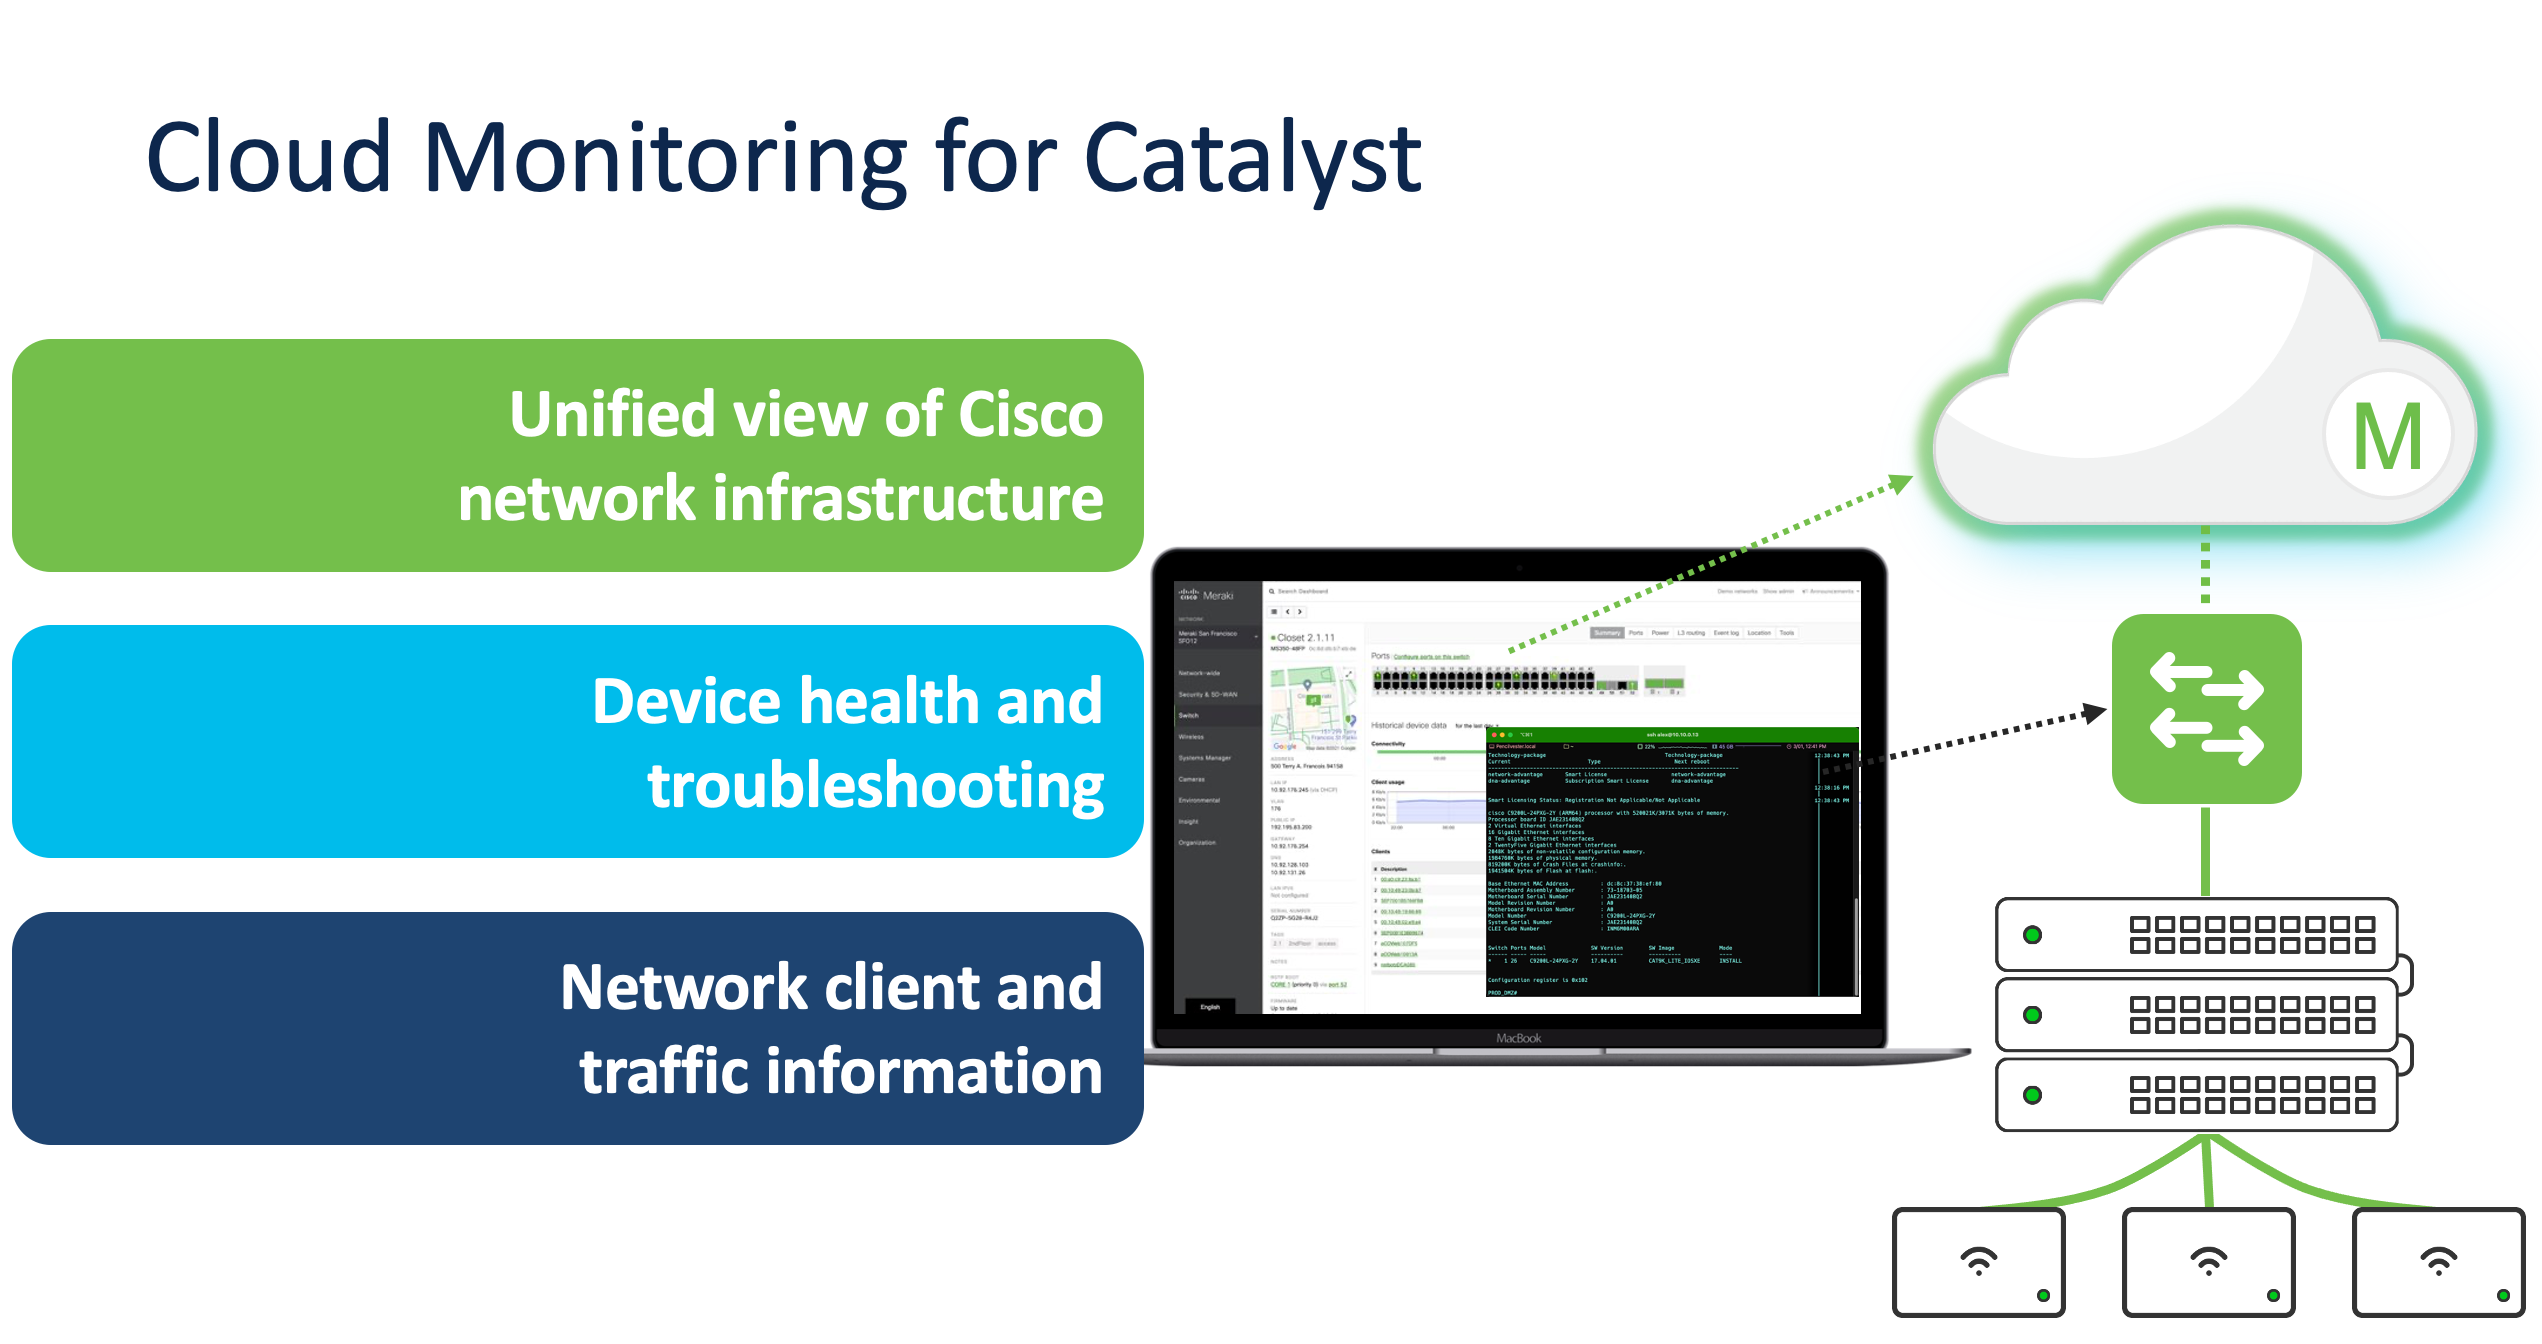
In the Meraki Dashboard, customers are able to view Catalyst switch statistics, configuration, and troubleshooting capabilities, providing a single pane of glass visibility. With monitoring, network device management and configuration changes are done elsewhere as the dashboard will have read-only access to the network devices. This means that IOS-XE features, CLI management, and configuration on the Cisco Catalyst switches in cloud monitoring mode are still supported.
Anyone can take advantage of this feature; for example, Cisco Catalyst customers not using Cisco DNA Center as their operational platform: you will be able to gain immediate value with cloud monitoring, providing a view of your network from anywhere, anytime, a low-effort way to experience the Meraki Cloud dashboard simplicity.
Another example is customers who are running a hybrid network of Meraki and Catalyst: you will benefit by moving your Catalyst hardware into view on the Meraki dashboard with monitoring to experience a single pane of glass for both solutions.
The process to add the Cisco Catalyst switches to the Meraki dashboard is very easy and can be accomplished in a few steps.
But first, let’s talk about the requirements and prerequisites:
- If you don’t have a Meraki dashboard account, you can sign up for one today. Get started by signing up for a Meraki Dashboard Account.
- Various Cisco Catalyst switches are supported for cloud monitoring. As of this writing, we support:
- Catalyst 9200 series switches (including 9200L models)
- Catalyst 9300 series switches (including 9300L and 9300X models)
- Catalyst 9500 series switches.
- Other platforms are under consideration
- The minimum version supported is IOS-XE 17.3.1 and later.
The onboarding process is very simple and straightforward. We leverage the Onboarding app, which is available for Windows, macOS, and Linux devices. The app can be downloaded from the Meraki Dashboard under Networkwide>Add Devices page. This page is accessible when you are logged in with your Meraki dashboard account.
The pre-onboarding process can be accomplished through a few steps:
• Confirm that you are on the supported IOS-XE version, 17.3.1 or later
• Have access to the Meraki dashboard
• Enable API Access for the organization the switches will be monitored under and acquire your organizational level administrator API Key. This can be generated through the dashboard account for your organization.
• The device from which the onboarding app is running must be able to reach api.meraki.com on TCP port 443.
• The Cisco Catalyst switch must be able to connect to the Cisco cloud using a TLS tunnel, which is used to communicate status and telemetry to the Meraki dashboard. Here are the TLS Gateways locations:
-
- Americas: us.tlsgw.meraki.com
- EMEA: eu.tlsgw.meraki.com
- Asia Pacific and Japan: ap.tlsgw.meraki.com
- For more details on additional requirements such as port connectivity, DNS, NTP, and IP routing requirements, please refer to cloud monitoring for Catalyst Onboarding under pre-onboarding steps.
After you have everything confirmed and ready to go, you can follow the Onboarding tool which has guided steps to bring up switches into the Meraki dashboard. It is recommended that you back up your device configuration before onboarding your Catalyst switches to the Meraki dashboard.
Once in the dashboard, these switches will be automatically tagged with “Monitor Only” to distinguish them from other Meraki switches. Also, the switch maintains its IOS-XE image, and two serial numbers (one Catalyst and one Meraki). Aside from this difference, “Monitor Only” Catalyst switches appear and function very similarly to Meraki MS switches in the dashboard, including a visual representation of connected ports and traffic information.
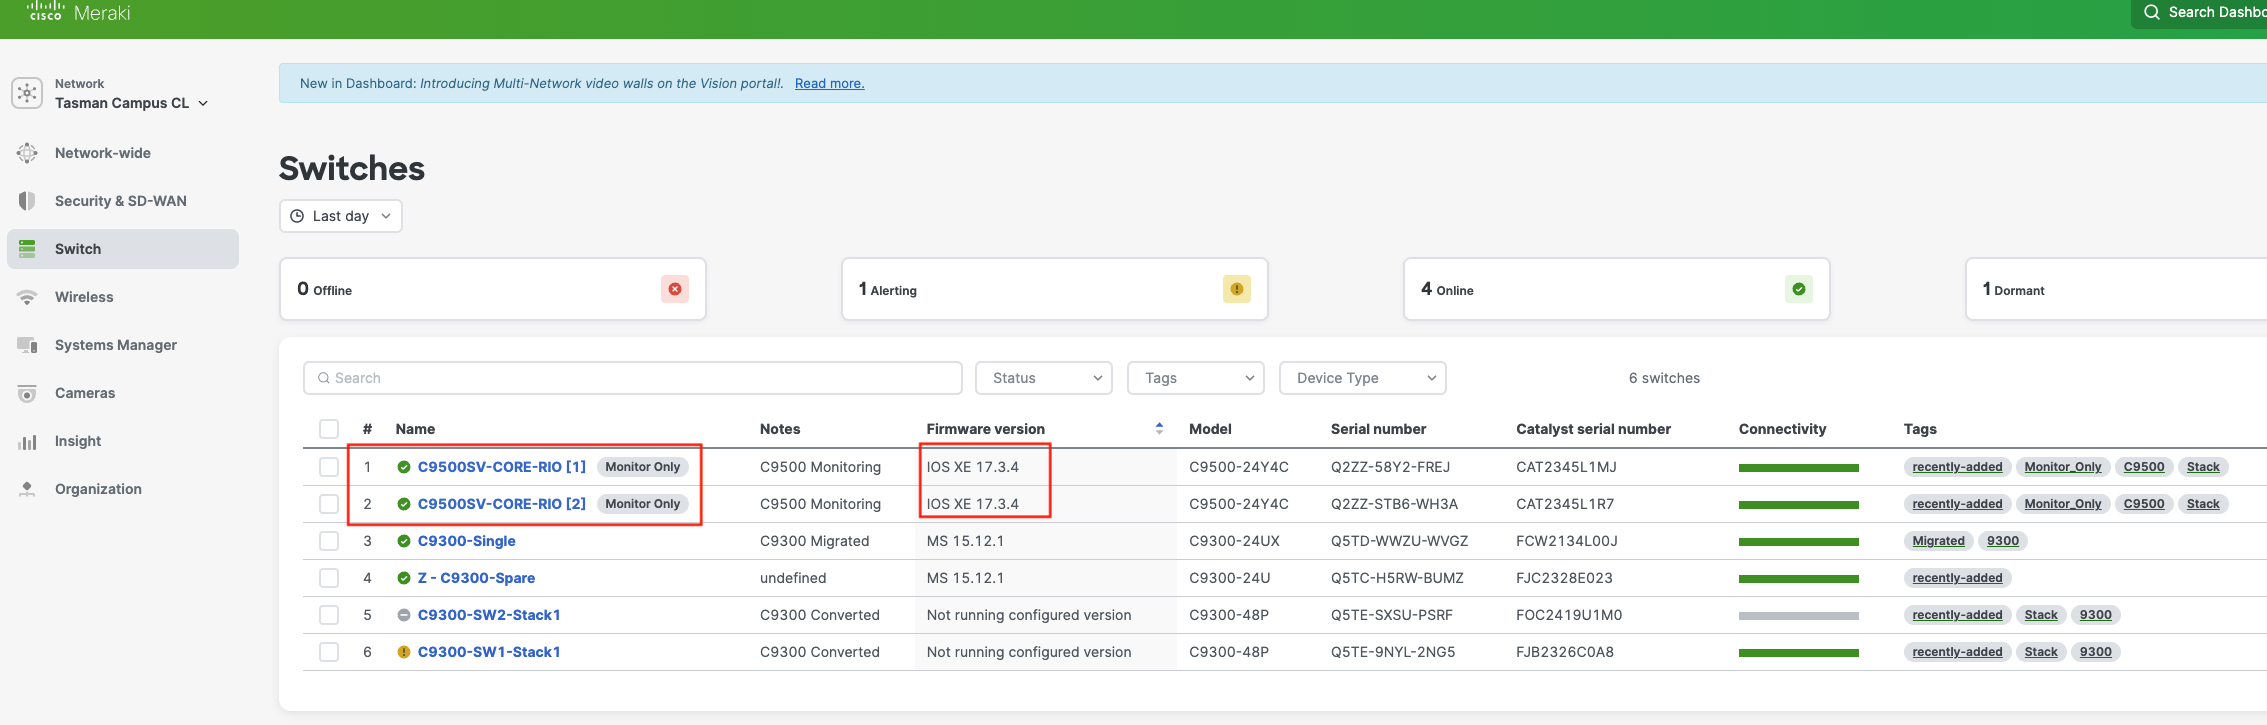
Figure 2 shows a detailed view of all switches I have in my environment; as you can see, the top 2 are stacked and are tagged as Monitor Only. They are running IOS XE 17.3.4, with both Meraki and Catalyst serial numbers.
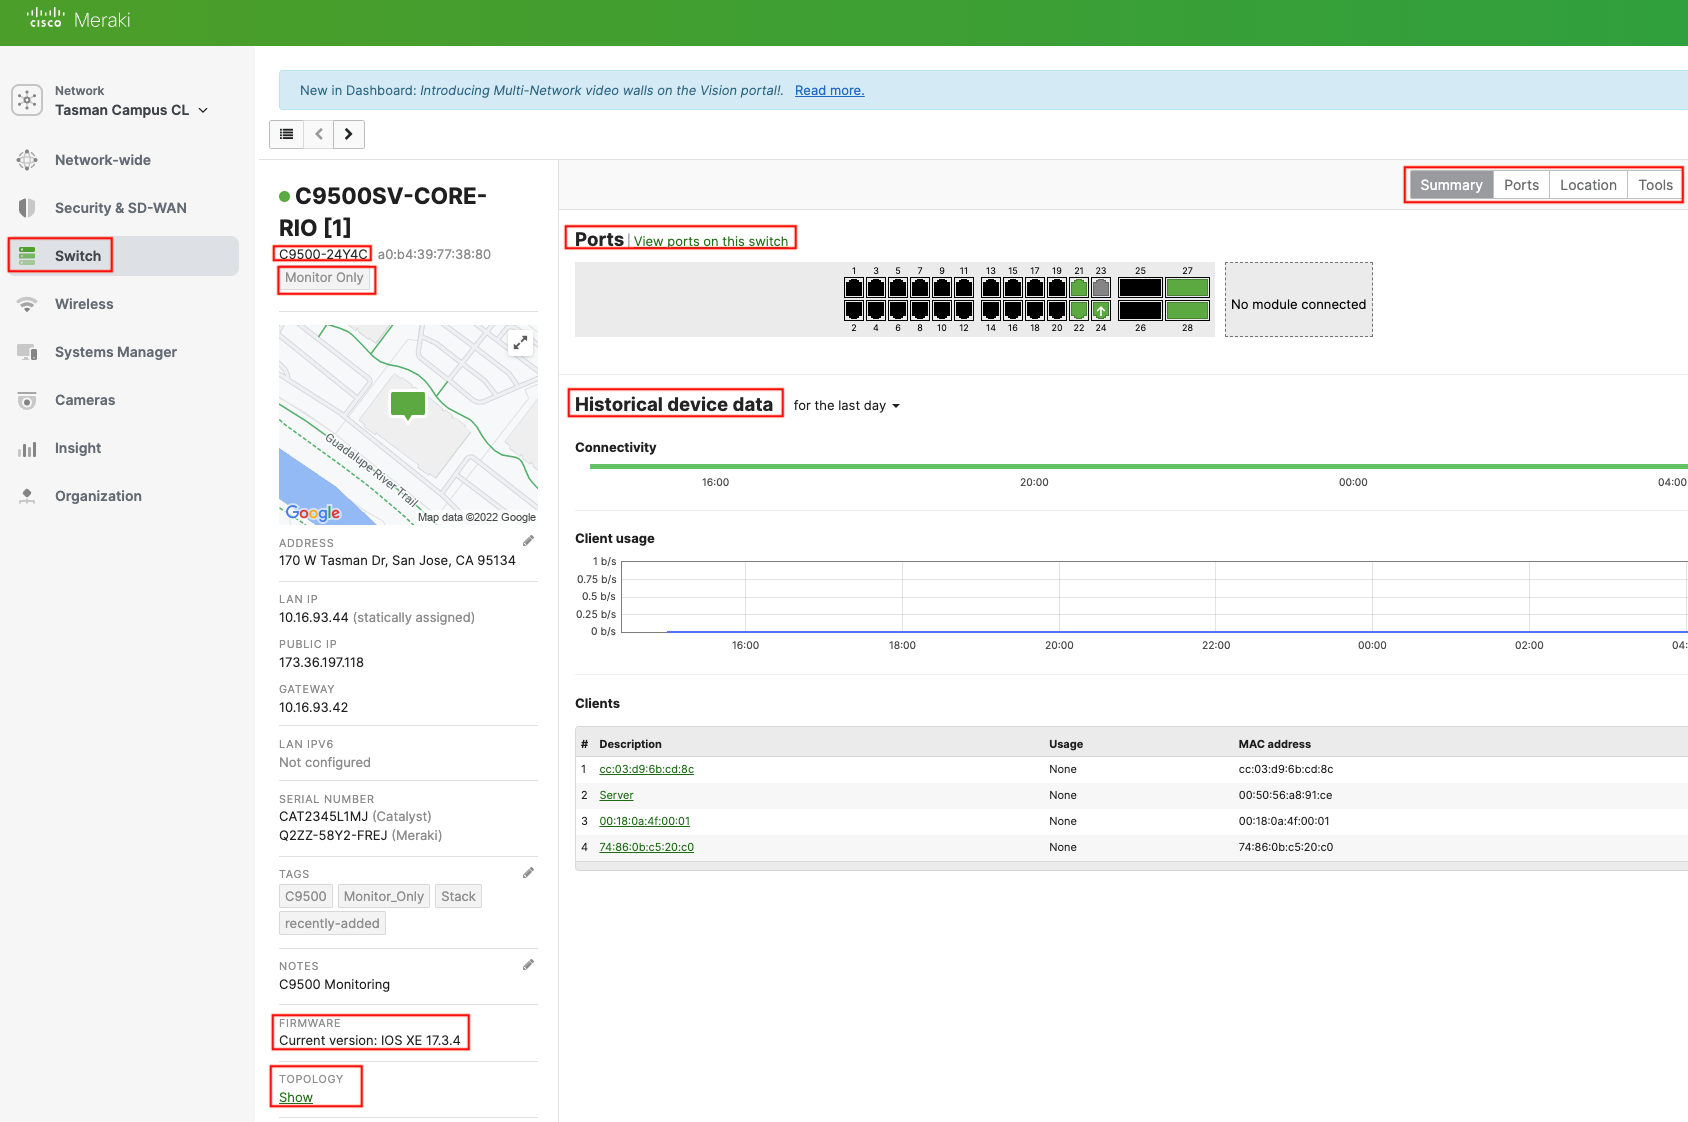
From the above screenshot of a Cisco Catalyst 9500 switch in monitor mode, you are able to see many details that are similar to what you’d see for a Meraki MS switch. You can click on port information to see the configuration, packet details, power cycle the port, and neighbor details. You can also see the network topology and troubleshooting tools. Reach out to your Cisco Account team for questions or support.
Join our November 15th webinar to learn more and ask questions!
Your Four-Step Guide to Enabling Cloud-Managed Networks
Nov 15, 2022 10:00am – 11:00am PST (GMT-08:00)
Additional Resources:
Get started by signing up for a Meraki free account
Onboard your Cisco Catalyst 9000 to gain visibility and troubleshooting abilities
Cloud Monitoring Overview and FAQ
Cloud Monitoring for Catalyst Onboarding
Supported Catalyst 9000 Series Switches (Cloud Monitoring)
Your Network, Your Way: A Journey to Full Cloud Management of Cisco Catalyst Products
Do more with the Meraki Dashboard with Cloud Management for Catalyst (Podcast)