Part 2: Industry trends
In our Threat Trends blog series, we attempt to provide insight into the most prevalent threat activity. Our goal in giving you the latest info on these trends is that you’ll be better prepared to allocate security resources to where they’re needed most.
Knowing the larger trends can help in this pursuit, particularly when it comes to the most common threat types. This is what we covered in part one of this Threat Trends release on DNS Security, using data from Cisco Umbrella, our cloud-native security service.
However, different industries sometimes have different levels of exposure to certain threat types. For example, those in the financial services industry may see more activity around information stealers; others in manufacturing may be more likely to encounter ransomware.
This is what we’re going to cover in part two. We’ll focus on specific industries, looking at two things: the top threat categories they face, and the categories that they’re more likely to encounter when compared to other industries. In this way, you’ll be better armed knowing which threats you’re more likely to encounter within your industry.
As in part one, we’ll be looking at data covering the calendar year of 2020. This time we’ll be comparing yearly totals of DNS traffic to malicious sites, by industry. While we do this, we’ll occasionally drill down to the monthly level, or look at endpoint data, to highlight items of interest. All of this gives us a window into the categories of threats that generate the most traffic for various organizations.
So, without further ado, and in no particular order, here are the industry trends:
Technology
The vast majority of DNS traffic in the Technology sector—the sector involving the development and/or distribution of technological goods and services—can be attributed to two categories: cryptomining and phishing. These two categories alone accounted for 70 percent of the traffic for organizations in this sector.
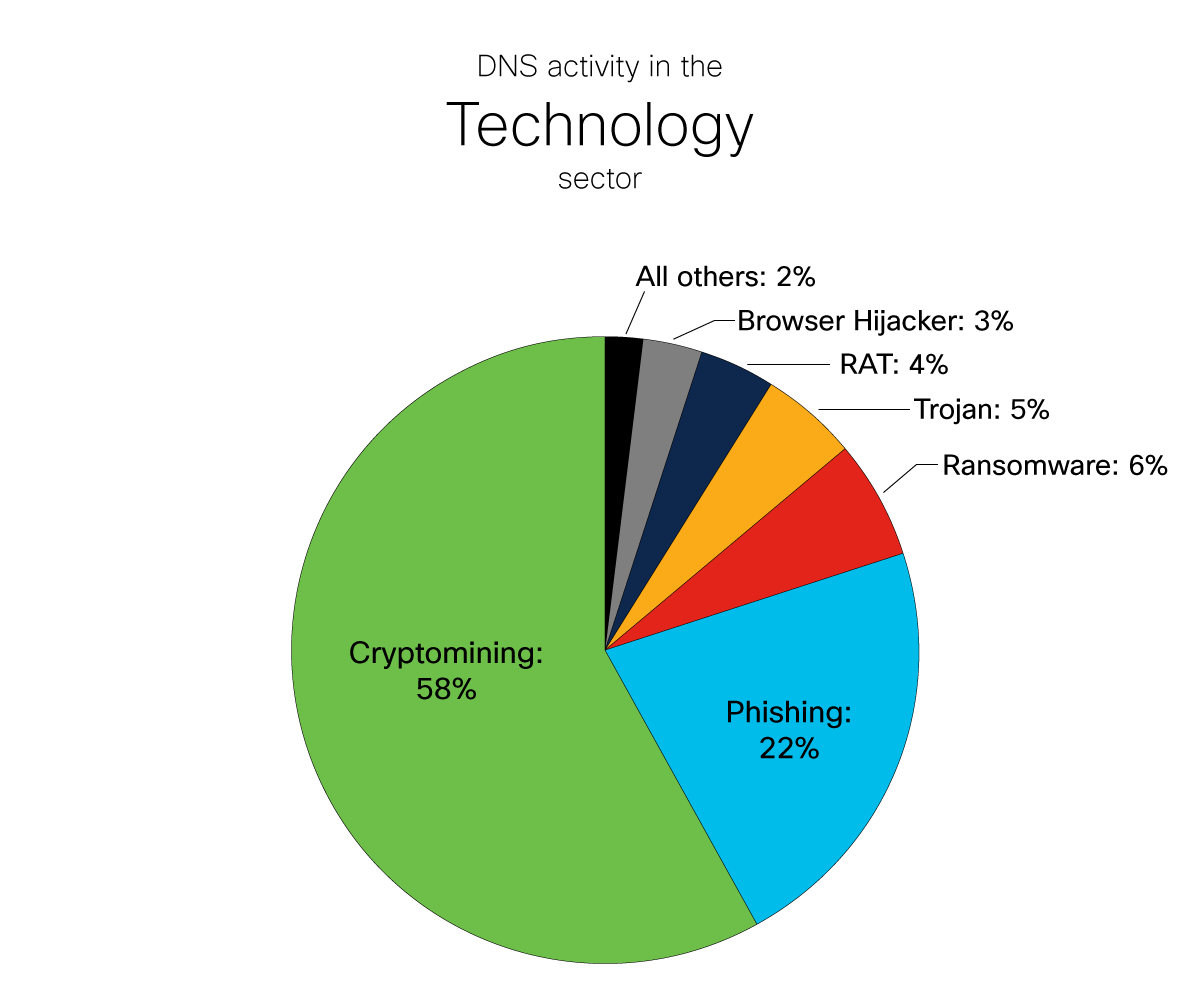
Unsurprisingly, the Technology sector saw far more cryptomining traffic than any other industry. While much of this activity can be attributed to bad actors, it’s possible that more knowledge surrounding cryptocurrencies could lead workers in this field to attempt to install miners on their company computers, triggering DNS blocks in Umbrella due to company policy violations. In comparison, Financial Services—an industry where workers are more likely aware of the risks of running cryptomining software on company devices—had one of the lowest levels.
Interestingly, the Technology sector saw the second-highest level of ransomware-related traffic, primarily driven by attacks involving Sodinobiki and Ryuk. However, the incredibly high proportion of cryptomining pushed the overall percentage down, coming in a six percent. trojan activity was also high, given that Emotet and Trickbot were used to distribute Ryuk, as previously discussed in part one.
Financial Services
Phishing resulted in the highest levels of malicious DNS traffic in the Financial Services sector. In fact, this sector saw 60 percent more phishing than the next-closest sector, Higher Education. It’s possible that this sector is targeted by attackers through phishing more often than others simply because of its proximity to many bad actor’s end goal: money.
Supporting this idea is the fact that the Financial Services sector also saw more information-stealing threats than any other industry. While not known to generate high volumes of DNS traffic (only 2 percent), Financial Services saw five times as much traffic in this category than any other industry.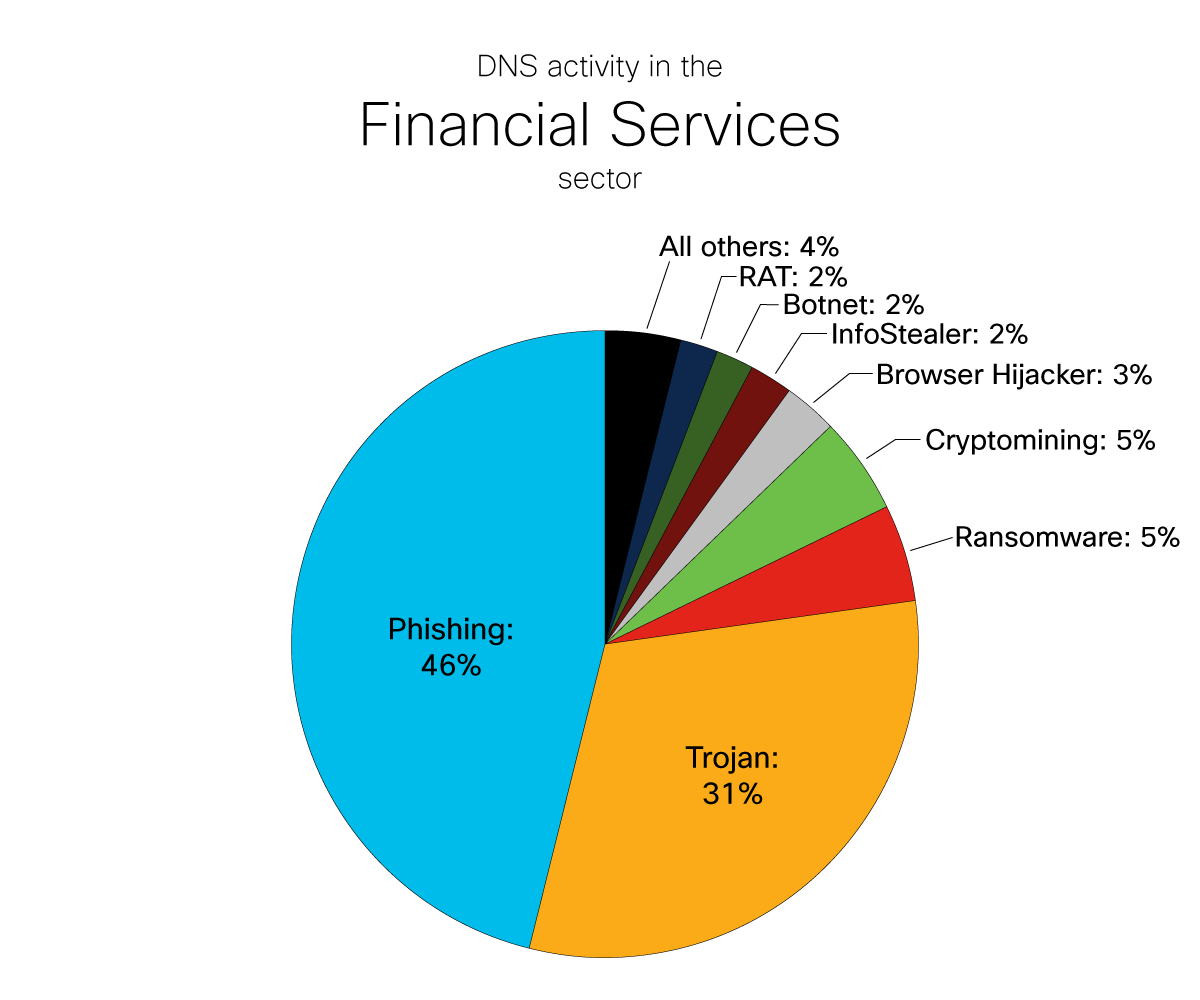
Financial Services also saw the second-highest amount of traffic in a number of categories, such as trojans, botnets, and remote access trojans (RATs). The breadth of malicious traffic seen in this industry could speak to how attractive a target it is to bad actors.
Healthcare
The Healthcare industry saw more trojans than any other sector, as well as higher numbers of droppers. Most of the trojan-based activity can be attributed to Emotet, as healthcare organizations were hit hard by the threat in 2020. Close to seven out of every ten trojans seen within the healthcare sector was Emotet. Throw Emotet’s close cousin Trickbot into the mix, you’re looking at 83 percent of all trojan-related traffic.
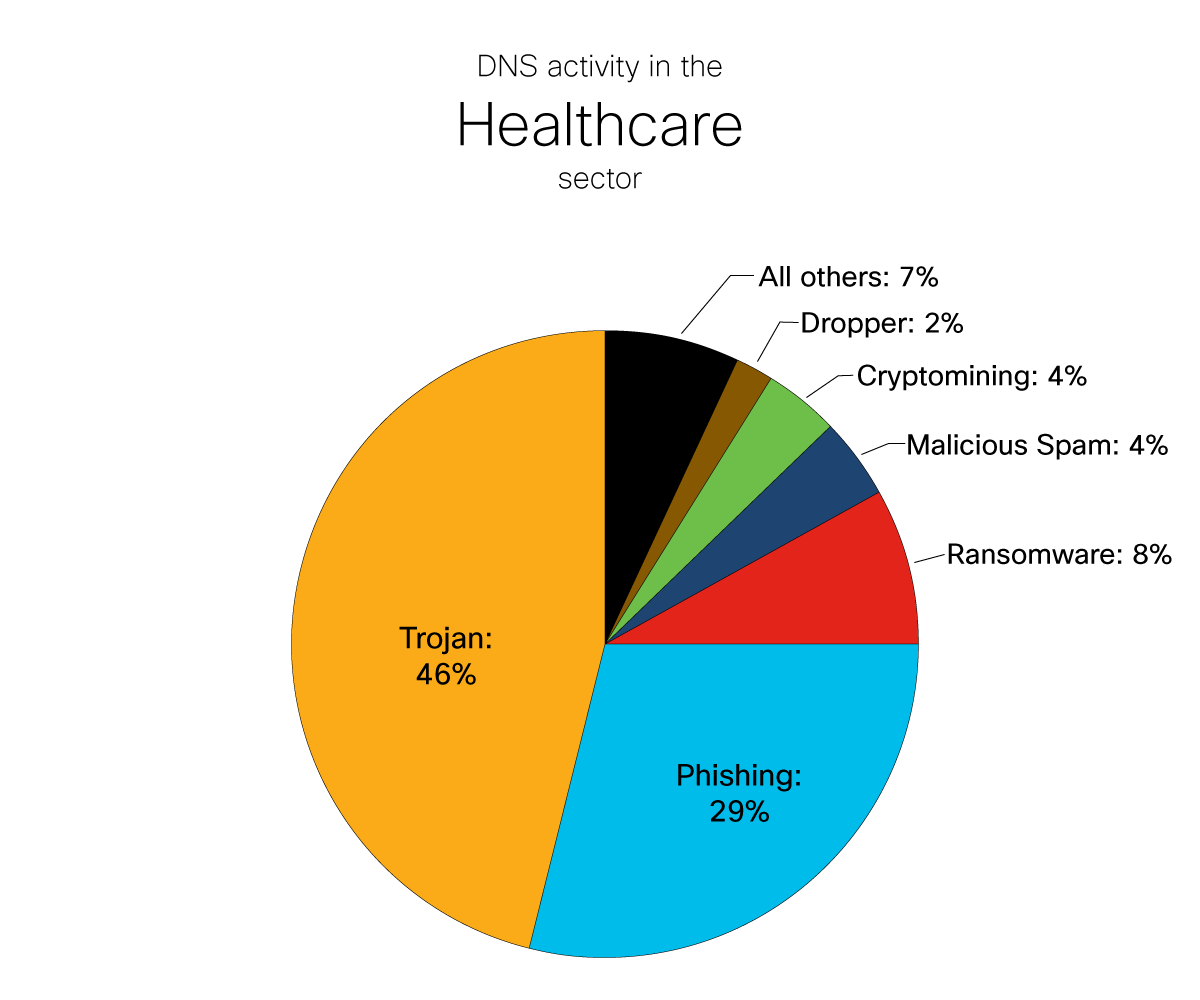
It likely comes as no surprise that ransomware also made its presence known within the Healthcare sector. Ryuk was particularly active, no doubt associated with the high activity surrounding Emotet. The Healthcare sector was also narrowly edged out of the second-highest place for ransomware, coming in only 1.5 percent lower in overall DNS traffic.
Manufacturing
Like the Technology sector, cryptomining activity was also high in the Manufacturing industry. It saw roughly half the activity seen in the Technology sector, but interestingly, there were almost three times as many endpoints in the Manufacturing sector involved in cryptomining. In short, more machines resulting in less DNS activity leads us to believe these endpoints were less powerful when compared to those in the Technology sector. It’s possible that the machines compromised are involved in the manufacturing process itself, even IoT related. In these cases, cryptomining would likely have been slower, but could still impact production speeds.
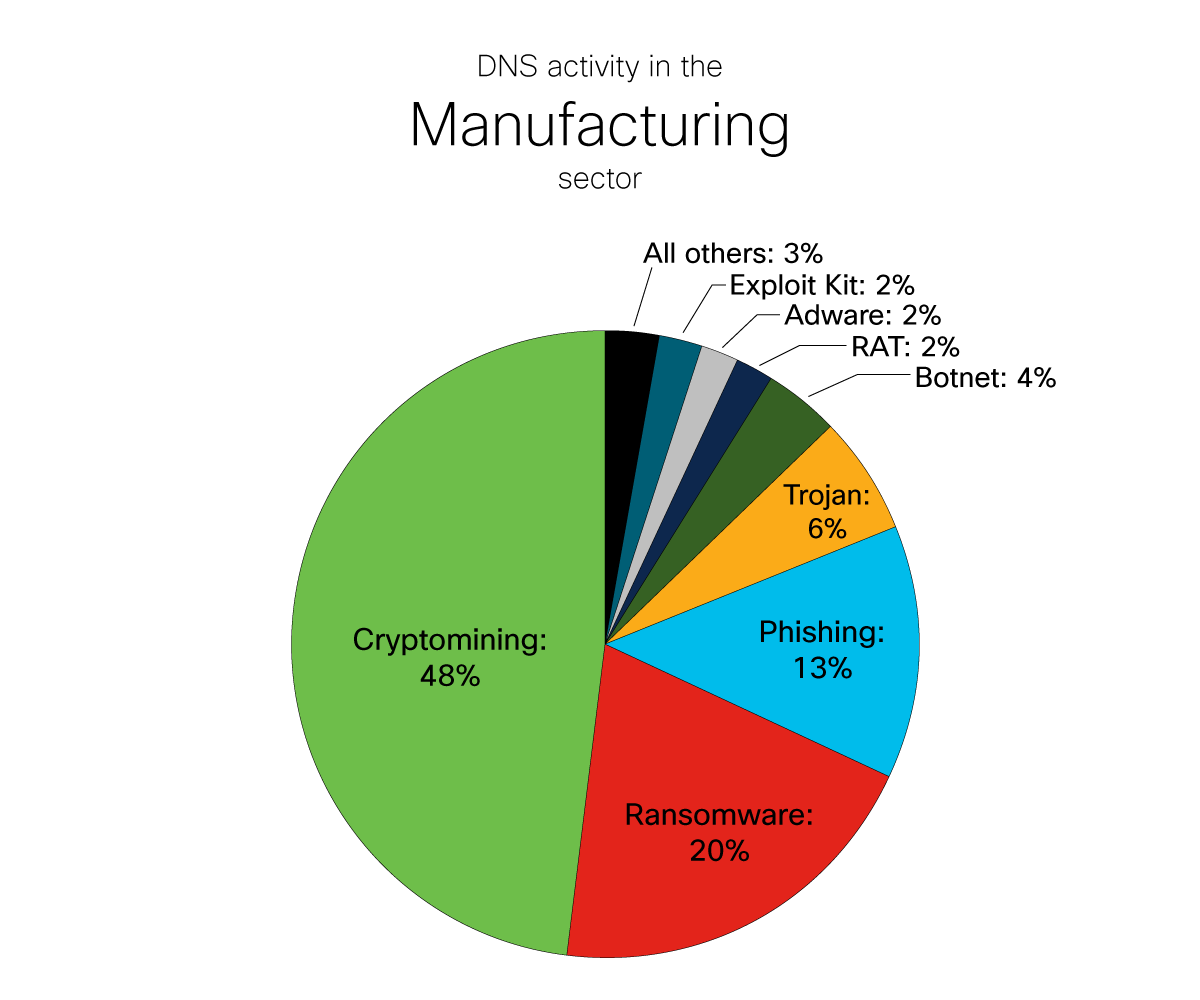
It turns out that the Manufacturing sector is also the most likely to be impacted by ransomware. This industry saw almost as much ransomware-related traffic as the next two closest industries combined (Technology and Healthcare). This appears to be a clear indication the industry is regularly targeted by bad actors, likely through big game hunting and the potential payout bad actors could receive.
Higher Education
The COVID-19 pandemic closed campuses worldwide in 2020. As classes moved remote, many malicious activities that would have been blocked on campus would have occurred on student’s home networks. This resulted in drop-offs in malicious activity for this sector in many categories from March onwards, and much lower overall numbers in 2020 than in previous years.
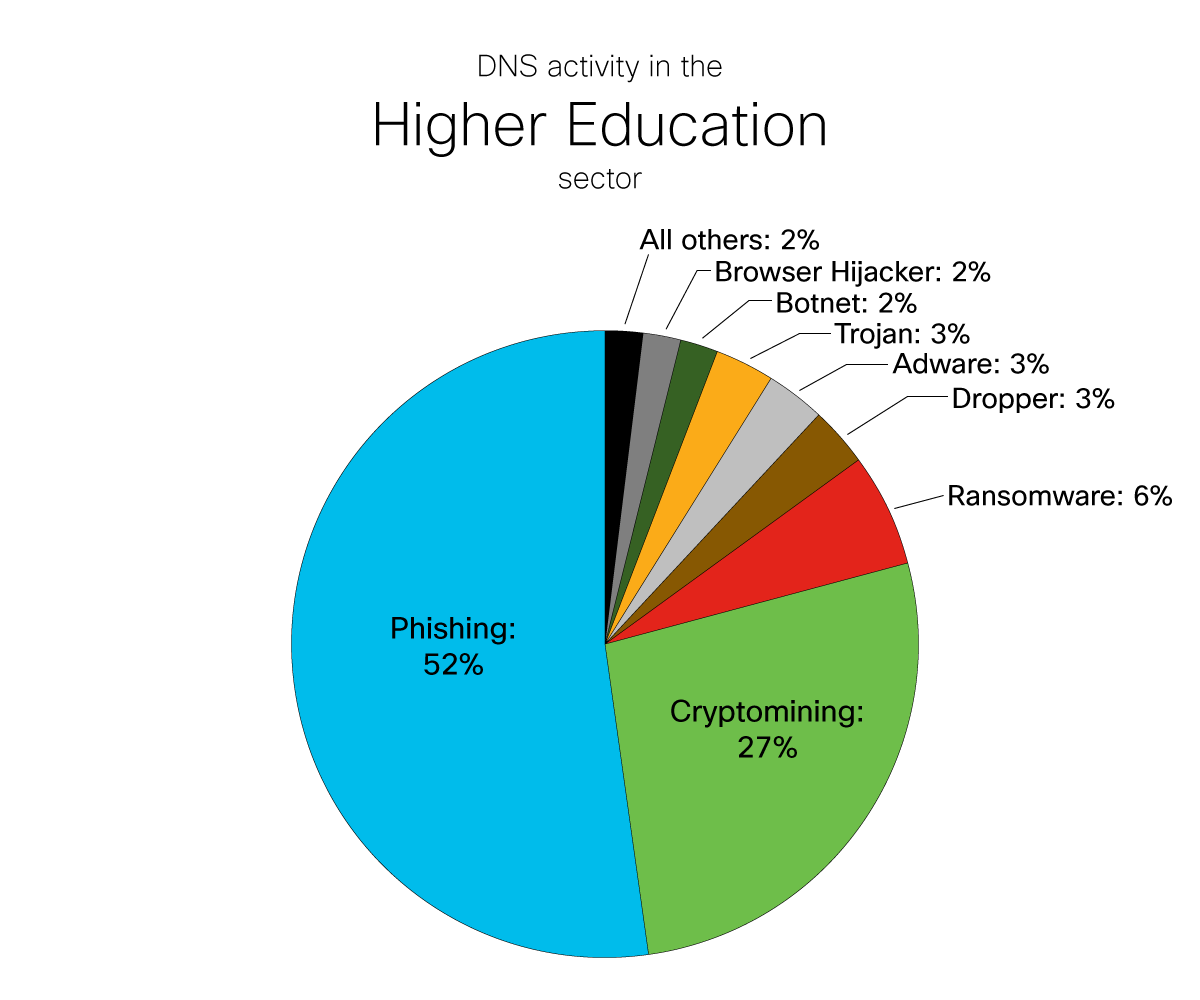
That’s not to say that activity dropped off a cliff, as certain activities that would require access to campus resources did register their share of DNS activity. For instance, phishing activity managed to put Higher Education in second place when comparing across industries. Cryptomining outfits also frequently target the Higher Education sector in an attempt to siphon off computing resources, or student-discounted cloud computing credits, to run their miners.
Government
Of the industries that we’ve examined, the Government sector appears to be the most evenly distributed across the top categories highlighted in part one of this series (Phishing, Cryptomining, Ransomware, and Trojans). The Government sector even saw a fairly even distribution for each of these categories when looking at them month-on-month.
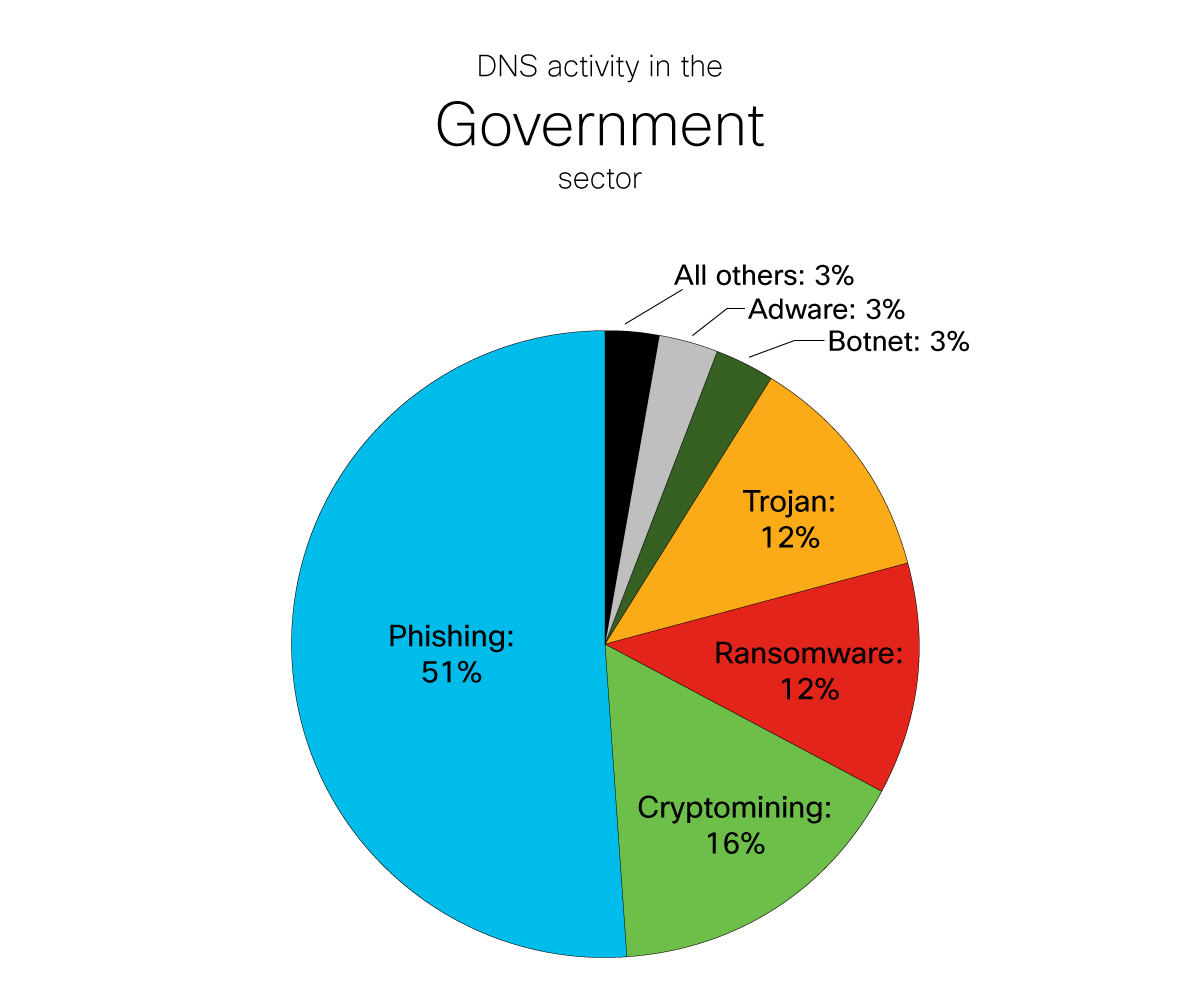
The sole exception to this trend was cryptomining, which saw low numbers in the first three quarters of the year, only to jump in October as cryptocurrency values reached a high for the year and continued to climb. However, the month-on-month numbers didn’t fluctuate through the last quarter of the year, remaining at largely the same elevated level each month.
Preventing successful attacks
As mentioned earlier, the data used to show these trends comes from Cisco Umbrella, our cloud delivered security service that includes DNS security, secure web gateway, firewall, and cloud access security broker (CASB) functionality, and threat intelligence. The malicious activity shown here was stopped in its tracks by Umbrella.
Umbrella combines multiple security functions into one solution, so you can extend protection to devices, remote users, and distributed locations anywhere. Umbrella is the easiest way to effectively protect your users everywhere in minutes.
Want to learn more?
Check out umbrella.cisco.com for more details.
Picking your battles
There is no doubt that examining trends can reap benefits. Knowing where attacks are occurring can make it easier to decide where to dedicate your resources to defend against them. Cryptomining and phishing are commonly seen these days, as are trojans like Emotet and Trickbot, used to deploy ransomware such as Ryuk.
Of course, different sectors are impacted by different threats in different ways, so it helps to understand the specific trends surrounding the sector you find yourself within. For instance, it would be wise for someone in the Financial Services sector to keep a close eye on phishing trends, while someone in the Manufacturing sector may want to take a closer look at ransomware.
Ultimately designing a defensive strategy combining the larger trends and those of your specific industry, can bring you a long way towards protecting your assets.
Methodology
We’ve followed the same overall methodology in this blog that we did in part one, with a few changes in representation. Pie charts are based off DNS query traffic to malicious sites. Any category comprising more than one percent of traffic for a particular industry is represented in the charts. All categories below one percent are combined into the ‘All Others’ group in the charts.