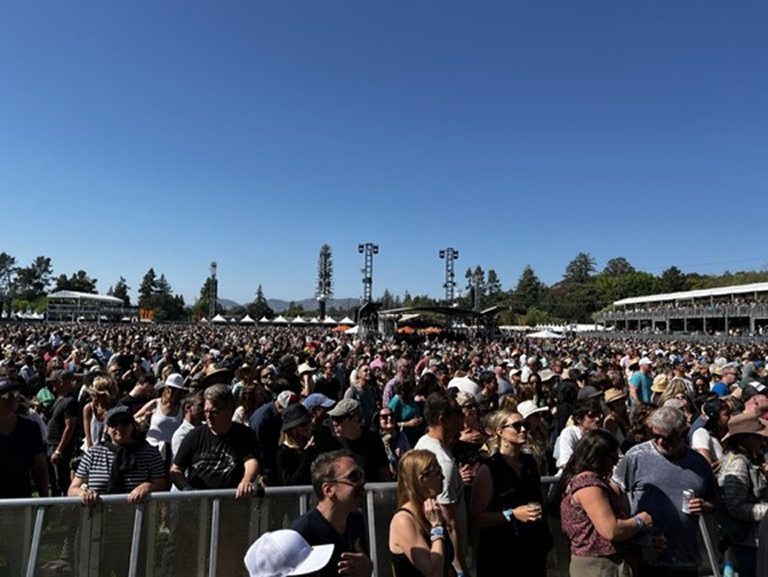
At BottleRock Napa Valley, the obvious headliners were on stage.
The less obvious one was overhead, under tents, behind stages, near point-of-sale terminals, and in thousands of pockets: the network.
That may sound like something only a data person would say, and fair enough. But once you spend time inside a live event like BottleRock, you start to see how much of the experience depends on invisible systems working together.
Every food order, mobile app check, shared video, vendor transaction, artist operation, sponsor activation, and “where are you?” text depends on a digital experience that has to work in a place that wasn’t a production campus a week earlier.
That’s what makes BottleRock such a useful proving ground. It’s real, high-density, high-expectation, and full of people who didn’t come for a network demo.
This year, that invisible system ran 475 access points, served 58,380 unique Wi-Fi clients across three days, peaked at 20,968 concurrent clients on Friday night, and pushed 58.69 TB of traffic through dual diverse WAN circuits. Just under half of those clients connected on the 6 GHz band, at standard power, outdoors via Wi-Fi 7. Wi-Fi 7 wasn’t the story because fans were thinking about it. It mattered because they weren’t thinking about Wi-Fi at all.
Here’s the thread to follow what comes next. Cisco brings the network, security, location, and infrastructure that connects the experience. Splunk turns the resulting machine data into something teams can search, correlate, visualize, and act on while the event is still live. Together, the opportunity is bigger than observability as a technical discipline. It’s digital resilience as an operating model—and BottleRock is what that looked like in practice.
48% on 6 GHz, at standard power, outdoors
Across the three-day festival, 48.3% of clients connected on the 6 GHz band. That’s 28,212 client devices—phones, laptops, payment terminals, staff radios, point-of-sale tablets—whatever was in someone’s pocket or on someone’s hip.
Day to day, the pattern held:
- Friday 5/22: 50.4% of clients on 6 GHz
- Saturday 5/23: 40.5% of clients on 6 GHz
- Sunday 5/24: 43.8% of clients on 6 GHz
Compare that to BottleRock 2025, when only 11.3% of clients landed on 6 GHz—5939 out of 52,606 total. In a single year, the 6 GHz share more than quadrupled, and the absolute number of 6 GHz clients grew 4.7x on essentially the same crowd. The 6 GHz wave didn’t roll in gradually. It crashed.
Five years ago, “percent of consumer Wi-Fi clients on 6 GHz” was zero. The band wasn’t open to unlicensed use. There was no consumer device that could even tune to it. Today, at a festival where the device mix is whatever fans happen to show up carrying, nearly half the population landed on a band that didn’t exist for them in 2021.
This isn’t a lab test or a curated device pool. It’s a real-world consumer mix in a messy outdoor radio frequency (RF) environment, and the 6 GHz adoption is already here.
Wi-Fi 7 is more than a faster logo on the access point. For large public venues, its real value is capacity, efficiency, and flexibility: more usable spectrum, better handling of dense client populations, and a path to support high-upload, real-time experiences without making the network part of the fan experience. At BottleRock, 6 GHz standard power was the most visible proof point, but the larger story is Wi-Fi 7 becoming operational infrastructure for places where experience, revenue, and safety all depend on connectivity.
The behind-the-scenes unlock
The part most fans will never know about is the part that makes this interesting for the rest of us.
6 GHz Wi-Fi operates at three regulatory power classes:
- Low power indoor (LPI)—what most indoor Wi-Fi 6E and Wi-Fi 7 access points use. No automated frequency coordination (AFC) required, but it has power caps and indoor use limitations.
- Very low power (VLP)—permitted outdoors, but the range is small enough to require an access point every few yards to cover anything meaningful.
- Standard power (SP)—full power, full range, full capacity. The only mode that makes outdoor 6 GHz operationally interesting at venue scale.
Standard power is also the mode that must share the band with incumbent licensed users—fixed satellite earth stations, microwave point-to-point links, and broadcast auxiliary services. To operate at SP, an outdoor 6 GHz access point has to coordinate its channel and power assignment in real time with an AFC system, which checks the access point’s geolocation against a database of incumbents and returns the channels and equivalent isotropically related power (EIRP) the access point is allowed to use, wherever it is.
AFC has been an FCC-approved framework for some time. Seeing it run outdoors, in production, at this density, under sustained festival load is the part that moves it from roadmap conversation to operating reality.
At BottleRock 2026, we did exactly that. Cisco CW9179 Series Access Points across the venue ran 6 GHz at standard power, with AFC actively coordinating channels and power. The 28,212 clients who landed on 6 GHz were not crowding a tiny VLP cell—they were using the full range and capacity of the band the way the regulator designed it to be used.
That’s the moment where outdoor 6 GHz with AFC stops sounding theoretical and starts looking like a repeatable venue design pattern.
Signals, not vanity metrics
Wi-Fi infrastructure is only half the operating picture. The other half is being able to see what’s happening across the environment while the event is live. This is the part we care about most: the network itself is impressive, but the bigger story is what happens when the data becomes usable before the headliner starts. That’s where Splunk turns “we think things are working” into “we can see what is happening, understand what changed, and make a better decision while the event is still live.”
At BottleRock, the dashboards we ran brought together the kinds of signals operators need during a live event:
- Wi-Fi access points, connected clients, fan-facing and back-of-house clients, OpenRoaming clients, and Wi-Fi 7 activity
- Client breakdowns by Service Set Identifier (SSID), device manufacturer, operating system, carrier, protocol, area, and RF/site tag
- Network health, switch telemetry, total data transferred, upload/download trends, and traffic mix
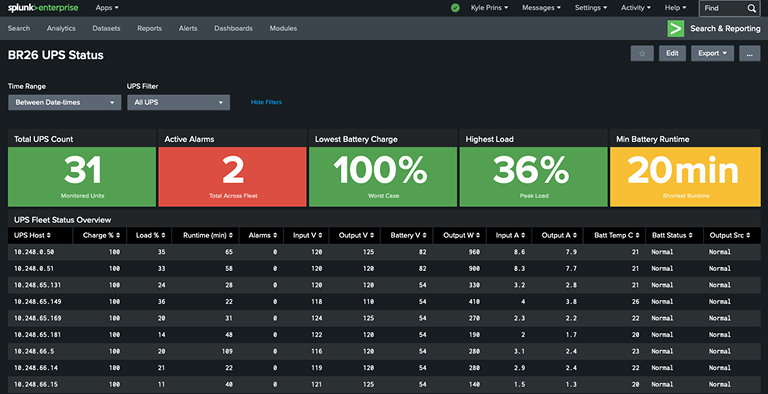
- Uninterruptable power supply (UPS) health, active alarms, battery charge, runtime, load, and fleet status
- Weather forecasts, temperature, humidity, precipitation probability, wind, and festival schedule context
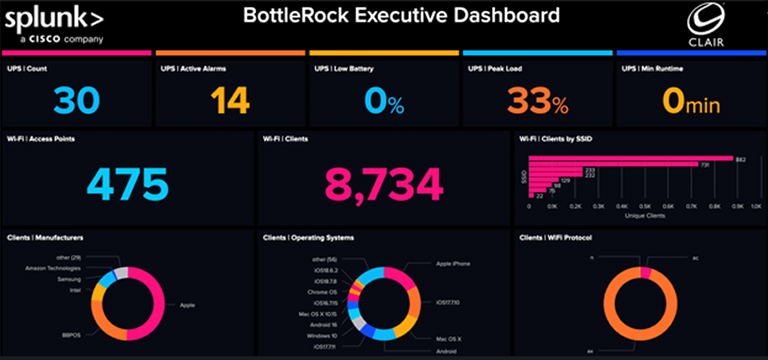
The headline numbers from those signals:
| Metric | Value |
|---|---|
| Wi-Fi access points deployed | 475 |
| Unique Wi-Fi clients (3 days) | 58,380 |
| Peak concurrent clients (10-min window) | 20,968 (Friday night) |
| Clients on 6 GHz | 28,212 (48.3%) |
| OpenRoaming-authenticated clients | 49,420 (85%) |
| OpenRoaming partners | 4 carriers (AT&T, T-Mobile, FirstNet, Samsung) |
| Total WAN traffic (show days) | 58.69 TB (33.96 TB up/24.73 TB down) |
| Peak combined WAN throughput | 6.87 Gbps (Sunday, 7:40 p.m.) |
| Peak upload/peak download | 4.26 Gbps/2.84 Gbps |
| Dual-WAN load balance | 51/49 across diverse circuits |
| Access platform | Cisco CW9179—Wi-Fi 7, 6 GHz standard power via AFC |
These aren’t vanity metrics. They’re signals that help teams understand where demand is forming, which parts of the environment are under pressure, and whether the experience is behaving the way the business needs it to behave.
Upload-dominant: Fans push more than they pull
One of the more interesting lines in that table is the upload share of total traffic (58%), with 33.96 TB pushed up versus 24.73 TB pulled down.
That’s the inverse of what enterprise WANs and home broadband typically look like, where download dominates 80%–90% of the mix. Festival Wi-Fi flips that pattern for a specific reason: fans aren’t passively pulling content—they’re actively pushing it—via live photos and short-form video to Instagram and TikTok, FaceTime to the friend who couldn’t get a ticket, broadcast feeds streaming out from production, point-of-sale and tap-to-pay traffic, and IoT telemetry from staging, lighting, and crowd safety systems.
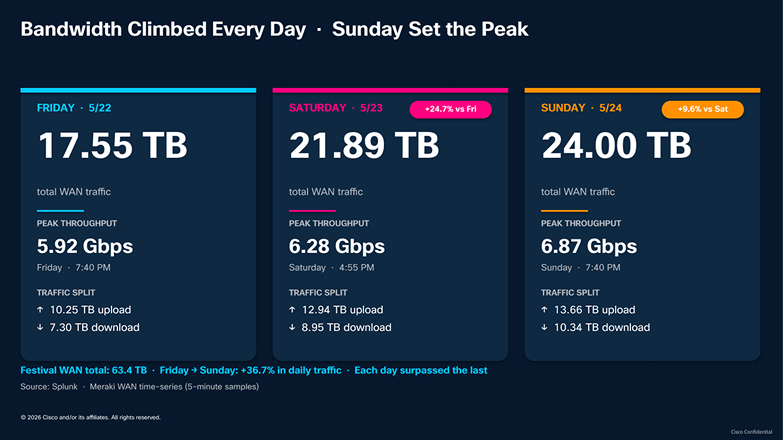
The design held. Each day was bigger than the last—Friday 17.55 TB, Saturday 21.89 TB (+24.7%), Sunday 24.00 TB (+9.6%)—and the dual-WAN diverse-circuit design held its split at 51/49 across the entire festival window. Exactly the resilience pattern the network was designed to deliver under peak utilization.
If you’re designing connectivity for an environment where people gather around a shared experience—stadiums, transportation hubs, retail flagships, conference centers, public plazas—that upload-heavy mix is the one you should be sizing for. Not the download-first assumption your circuits were originally specified against.
OpenRoaming as default, not an upsell
The other quietly remarkable number is 85% OpenRoaming adoption. Nearly nine of every ten Wi-Fi clients auto-authenticated through their carrier identity the instant they walked into venue range, with no captive portal, no extra authentication friction, and no reason for most fans to think about Wi-Fi at all.
That’s 49,420 fans who just had service.
And the trend keeps moving in the same direction year over year. OpenRoaming adoption climbed from 82.1% in 2025 to 85% in 2026 (43,299 → 49,420 clients), while public Wi-Fi share continued its quiet decline—17.1% → 15%. The frictionless onboarding path keeps absorbing share from the captive-portal path.
That matters because Wi-Fi 7 capacity only becomes business value when users actually land on the network. OpenRoaming helped make the high-capacity path invisible: fans connected, traffic shifted, and the network absorbed demand without turning onboarding into a user experience problem.
When you give people the option, the identity-bridged path is where the load actually wants to go. The open public Wi-Fi SSID still ran—8734 unique clients chose it—but the carrier-authenticated experience became the dominant onboarding path. The operational signal is clear: OpenRoaming is no longer a niche carrier-side feature. At venue scale, it’s the path that makes the network feel like it simply belongs there.
The event is a system
Individually, those are useful operational views. Together, they tell a much bigger story: the event is a system.
That system includes people, devices, infrastructure, applications, physical spaces, weather, vendors, sponsors, and business outcomes. The real value comes when those signals stop living in separate tools and start supporting a shared operating picture.
This matters because live events compress years of enterprise complexity into a weekend.
A festival is temporary, but the challenges are familiar. Retailers need to understand store performance while customers are still in the aisle. Hospitals need to protect patient-impacting services while clinicians are working. Manufacturers need to keep production moving while equipment, applications, networks, and suppliers all change. Financial institutions need to connect service health, cyber risk, and customer experience in real time.
The pattern is the same: the business is running through digital systems, and the people responsible for those systems need trusted, contextual data before a small issue becomes a visible disruption.
When you build for a live festival, you don’t get to hide behind ideal conditions. Device density spikes. Usage patterns change by the minute. A headliner can shift traffic across the venue. Weather can matter. Power can matter. One bad blind spot can ripple into fan experience, staff coordination, vendor revenue, sponsor value, or safety operations.
That pressure is valuable. It forces better questions:
- Can we see across network, infrastructure, application, and physical-world telemetry?
- Can we distinguish noise from an issue that actually matters?
- Can an executive, operator, or partner understand the state of the event without reading raw logs?
- Can we package what worked into a reusable pattern for the next venue, customer, industry, or product workflow?
This is the field innovation muscle that customers expect from us. The most interesting problems don’t arrive as polished roadmap requests. They show up as early signals: a customer with no playbook, an operating model under stress, a new telemetry source, a business process that depends on systems no single team fully owns.
BottleRock gives us a way to explore those signals with real stakes.
From the deployment partner
The network at BottleRock is designed, deployed, and operated by Clair Global, the same team that handles audio, lighting, and rigging across the festival’s stages. Here’s Matt Clair, Executive Vice President at Clair Global, on what this year’s deployment felt like in operation:
“At BottleRock, connectivity is no longer just infrastructure; it’s part of the fan experience. Wi-Fi 7, 6 GHz, and Cisco’s 9179 platform have given us a meaningful leap in capacity, responsiveness, and reliability in one of the most demanding wireless environments you can build for. Fans can share, pay, navigate, and engage in real time without the network getting in the way. That’s the best kind of technology improvement: largely invisible to the guest, but transformative to the experience.”
The blueprint doesn’t end Sunday night
For customers, the takeaway isn’t “you should run your business like a music festival.” The takeaway is that your business probably already has festival-like moments: peak demand, executive visibility, temporary teams, distributed systems, customer-facing pressure, and a narrow window to get it right.
- The regulatory framework (AFC) is operational and works at production scale, outdoors, in a complex RF environment with incumbent neighbors.
- The hardware is shipping—Cisco CW9179 and the platform class around it are deploying in the wild today, not next quarter.
- The client device mix on the ground is already 40% to 50% 6 GHz capable without device curation or BYOD intervention.
- OpenRoaming has matured enough to be the default onboarding path, with 85% adoption at venue scale.
- Cross-domain observability is real—Wi-Fi, power, environment, and application telemetry sit in one operating picture instead of five disconnected tools.
This is what we meant by digital resilience as an operating model. Cisco brings the network, security, collaboration, location, and operational infrastructure that connects the experience. Splunk brings the ability to search, correlate, visualize, and act on machine data across that environment. Together, the result is fewer blind spots, faster troubleshooting, better communication between technical teams and business leaders, more useful post-event analysis, stronger partner reporting, and more confidence when the next peak moment arrives.
Three days. 475 access points. 58,380 clients. 58.69 TB of traffic. Half the population on 6 GHz at standard power outdoors. A 36.7% climb in daily traffic from Friday to Sunday, and the design held. UPS, weather, and infrastructure telemetry alongside Wi-Fi data in one shared operating picture.
That’s the part worth paying attention to. Wi-Fi 7 wasn’t just tested at BottleRock. It was absorbed into the operating model of a real event.
The music ended Sunday night. The blueprint didn’t.
That’s data into doing, with a wristband on.
Network metrics sourced from live Splunk dashboards aggregating Cisco Meraki WAN time-series, Wi-Fi client analytics, and UPS fleet telemetry across BottleRock 2026 (May 22–24, 2026, Napa Valley Expo). Network deployment partner: Clair Global. Access platform: Cisco CW9179. Learn more about how Cisco and Splunk help organizations build digital resilience at Cisco.com.
Want to dive deeper? See all the capabilities the Cisco CW9179 has to offer.