
Often, engineers from many teams (e.g., Network Engineering, Site Reliability Engineering, DevOps) can spend hours looking at bandwidth and performance data. A closed-loop corrective action (CLCA) process – looking for details to identify, analyze, and find or correct a problem – often is like looking for a needle in a haystack.
New, easy to deploy, reporting tool for Cisco SD-WAN
Good information on your data is critical in any enterprise environment. So, I recently recorded a DevNet Snack Minute video to share a demo with you of this new, easy to deploy, reporting tool for Cisco SD-WAN. The tool gives you the ability to perform actions such as:
- capacity management
- network planning
- auditing
- troubleshooting
- ROI analysis
- SLA enforcement
Watch the SD-WAN reporting tool in action using a DevNet Sandbox.
Real-time visibility
This is a simple reporting tool that is available as an OVA or Docker container image. It leverages Cisco SD-WAN vManage APIs to generate scheduled and on-demand historical reports. There is an option to plot charts. The reports are available in Excel format, and can be downloaded or delivered via email. The tool also has a dashboard that provides real-time visibility into tunnel performance, bandwidth consumption, and site availability.
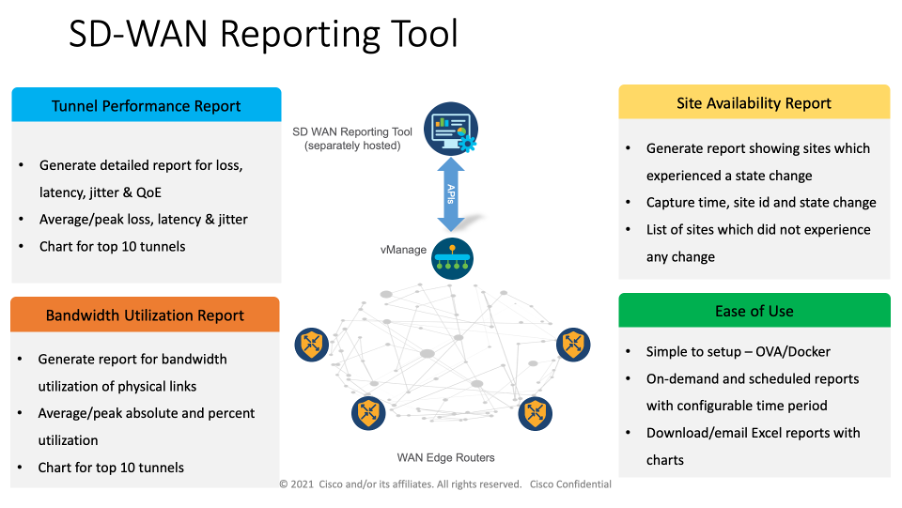 The SD-WAN reporting tool has a dashboard that provides real-time visibility into
tunnel performance, bandwidth consumption, and site availability.
The tool is available as an OVA and as a docker file. You can download and try the tool today on Cisco DevNet Code Exchange
Have a comment or question? Please leave me a note in the comments section below.
- Follow @bigevilbeard
- Follow @CiscoDevNet
We’d love to hear what you think. Ask a question or leave a comment below.
And stay connected with Cisco DevNet on social!
Twitter @CiscoDevNet | Facebook | LinkedIn
Visit the new Developer Video Channel


