Why Streaming Telemetry?
Cisco IOS XE is the Network Operating System for the Enterprise. It runs on switches like the Catalyst 9000, routers like the ASR 1000, CSR1000v, and ISR 1000 and 4000’s, Catalyst 9800 Wireless LAN controllers, as well as a few other devices in IoT and Cable product lines. Since the IOS XE 16.6 release there has been support for model driven telemetry, which provides network operators with additional options for getting information from their network.
Traditionally SNMP has been highly successful for monitoring enterprise networks, but it has limitations: unreliable transport, inconsistent encoding between versions, limited filtering and data retrieval options, as well as the impact to the CPU and memory of the running device when multiple Network Monitoring Solutions poll the device simultaneously. Model-Driven Telemetry addresses many of the shortfalls of legacy monitoring capabilities and provides an additional interface in which telemetry is now available to be published from.
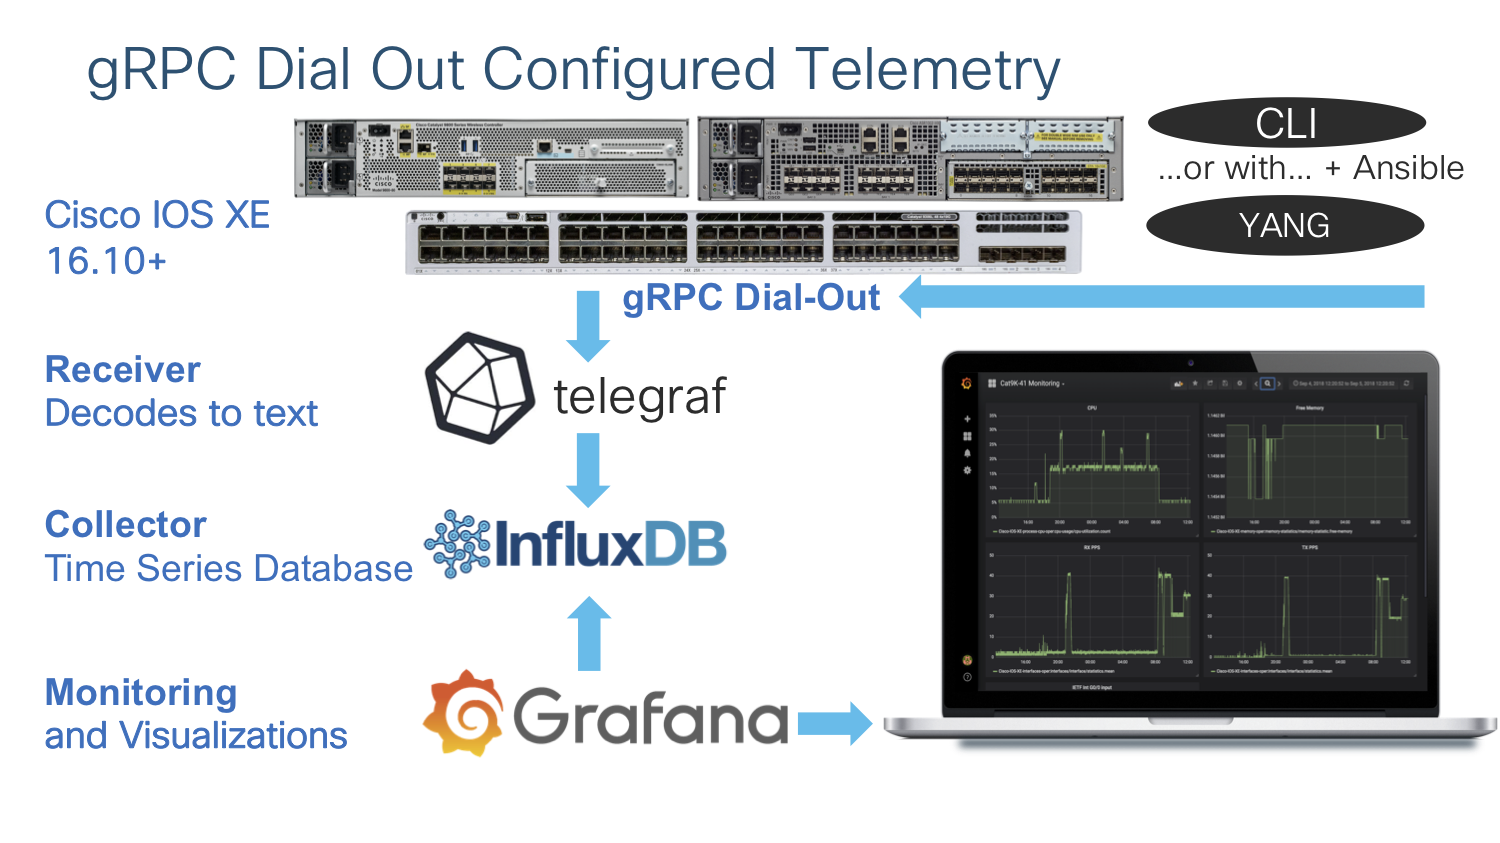
Yes, this is a push based feature. No longer do we need to poll the device and ask for operational state. Now we just decide what data we need, how often we need it, and where to send it. Once the configuration is in place the device happily publishes the telemetry data out to the 3rd party collectors, your monitoring tools, big data search and visualization engines like Splunk and Elastic, or even to a simple text file – it’s totally configurable what you do with the data. In the example below we use Telegraf + InfluxDB + Grafana to receive, store, and visualize the data.

Once common use case is to monitor the CPU utilization of a device. Let’s understand where and how we can get this data from our Cisco Catalyst 9300 running IOS XE 16.10
YANG Models
YANG Models are at the heart of Model-Driven Telemetry: Yet Another Next Generation! These human-readable text-based models define the data that is available not just telemetry publication but also for programmatic configuration as well. These data models reside within the IOS XE device and can easily be downloaded when using tooling like YANG-Explorer. All of the models are also published on the YangModels Github page which makes them easy to access and analyze.
The YANG-explorer tooling is available on the CiscoDevNet Github page which can download the YANG models directly from the IOS XE device over the NETCONF or RESTCONF interfaces and quickly show which data is available and from which model.

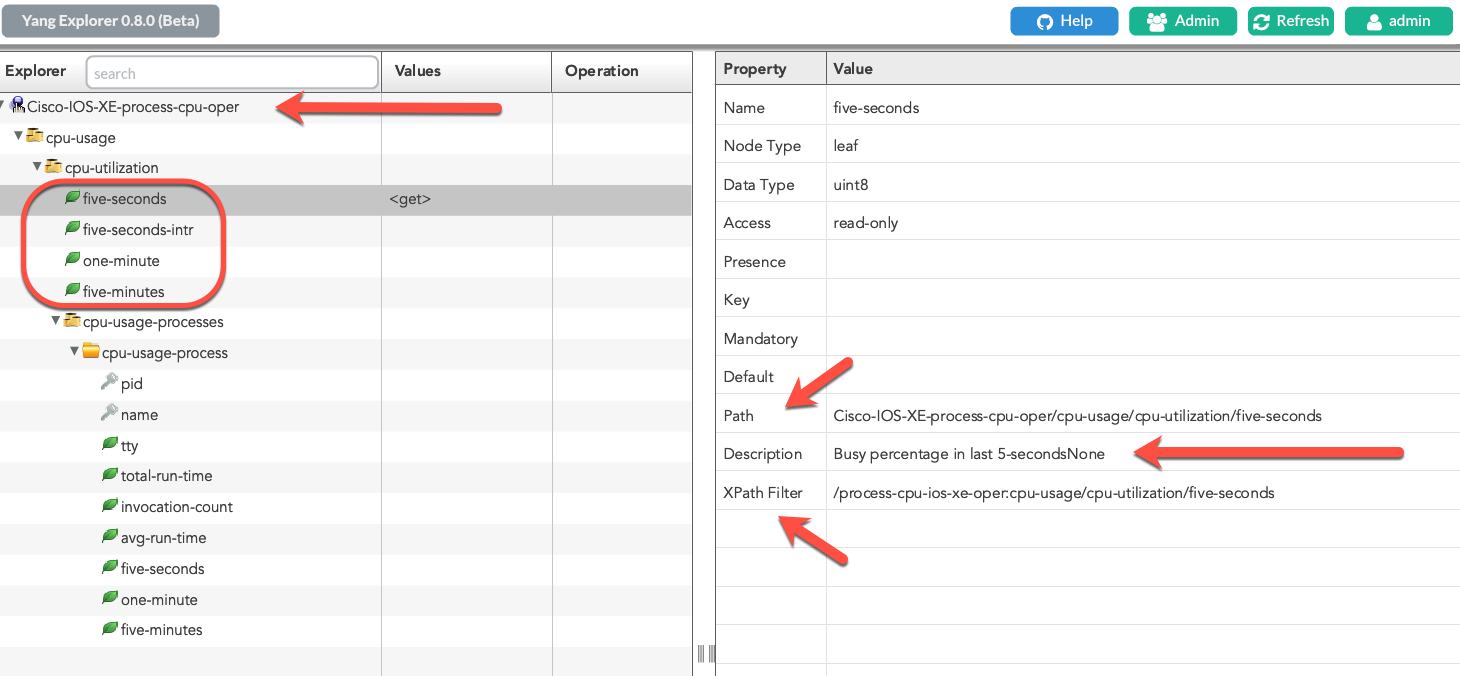
This example from the YANG Explorer shows that we have already downloaded and loaded the Cisco-IOS-XE-process-cpu-oper.yang model and began to explore it. It shows that the one-minute, five-minute, and 5-second “Busy CPU-Utilization” is available as a percent, as well as the Interrupt 5-second (five-second-intr) metric. It also shows some metadata about the model that includes the XPath, Prefix, Namespace, and a description with some other details.
Cisco IOS XE MDT Configuration
Now that we know which YANG data model contains the needed information let’s enable sending this telemetry from the device.
It is possible to configure and verify telemetry subscriptions from the traditional CLI as well as through the NETCONF, RESTCONF, and gNMI programmatic interfaces using YANG. When using CLI the show commands are available with the ‘show telemetry ietf’ set of commands, and is configured similarly with ‘telemetry ietf’ commands when in configure mode. When using YANG, the “Cisco-IOS-XE-mdt-cfg.yang” and “Cisco-IOS-XE-mdt-oper.yang” YANG models are available for both configuration and operational datasets.
Lets look at a configuration example from a Catalyst 9300 switch running Cisco IOS XE 16.10 This configuration enables telemetry subscription ID 501 and encoding is set to “kvgbp” which is a self describing JSON key-value pare Google Protocol Buffers format. The data that we want sent is defined by the filter xpath and we used YANG Explorer and the YANG models earlier to find it. The xpath filter prefix for the Cisco-IOS-XE-process-cpu-oper.yang model is “process-cpu-ios-xe-oper.yang”, and the specific datapoint or KPI we want is the 5-second CPU Utilization. The source address and source VRF are set so that the device knows which port or interface to send telemetry from. The update policy is set in centiseconds so every 5 seconds (500 centiseconds) the device will publish an update. Finally, the IP and port that the receiver is listening on is set, as well as the to use gRPC over TCP as the protocol.
Cat9300# show run | sec tel
telemetry ietf subscription 501
 encoding encode-kvgpb
 filter xpath /process-cpu-ios-xe-oper:cpu-usage/cpu-utilization/five-seconds
 source-address 10.60.0.19
 source-vrf Mgmt-vrf
 stream yang-push
 update-policy periodic 500
 receiver ip address 10.12.252.224 57000 protocol grpc-tcp
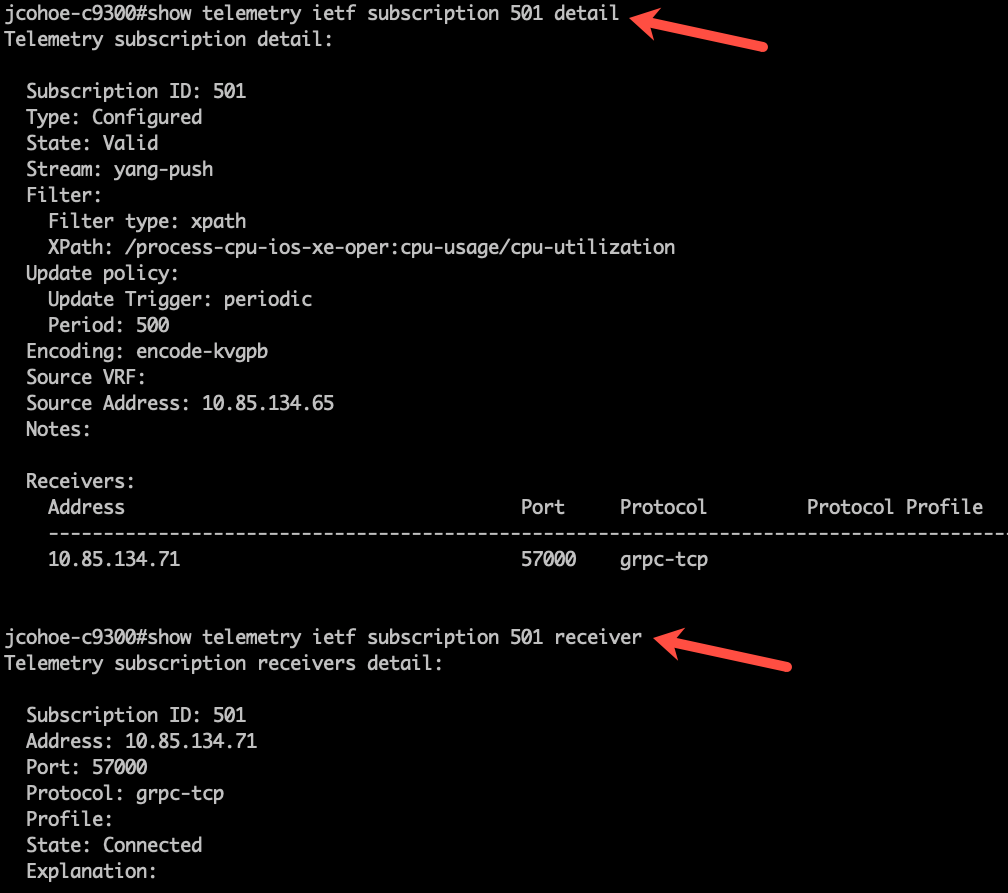
Let’s see what this looks like with some of the show commands: ‘show telemetry ietf subscription 501 detail’ and ‘show telemetry ietf subscription 501 receiver’:

The output shows that the CPU Utilization XPath has been set and that the telemetry receiver has connected successfully.
Telemetry Receiver
The open source software stack that allows easy reception, decoding, and processing of the “kvgbp” telemetry is referred to as the TIG stack. TIG represents three separate software components: Telegraf which receives the telemetry data, InfluxDB which stores it, and Grafana which is responsible for visualizations and alerting.
Telegraf has the “cisco_telemetry_mdt” input plugin that receives and decodes the gRPC payloads that the IOS XE device sends. It also has an output plugin that sends this data into the InfluxDB where it is stored. The configuration for Telegraf is simple and static because once it’s setup it rarely needs to be reconfigured or modified. Simply define a few global parameters, the input, the output, and then start the telegraf binary or daemon process.
In this example we configure the gRPC input listener on port 57000 – this is the port that IOS XE will publish telemetry to. We have also configured where to send the data out to: InfluxDB running on the localhost, port 8086, as well as the database, username, and password to use for the data base storage.
# telegraf.conf
# Global Agent Configuration
[agent]
hostname = "telemetry-container"
flush_interval = "15s"
interval = "15s"

# gRPC Dial-Out Telemetry Listener
[[inputs.cisco_telemetry_mdt]]
transport = "grpc-dialout"
service_address = ":57000"

# Output Plugin InfluxDB
[[outputs.influxdb]]
database = "telegraf"
urls = [ "http://127.0.0.1:8086" ]
username = "telegraf"
password = "your-influxdb-password-here"
InfluxDB and Grafana can run inside Docker containers or natively on Linux, and there is excellent getting started documentation on the official InfluxDB and Grafana websites. I recommend following the official guides in order to setup InfluxDB and Grafana in your environment as needed.
Visualization with Grafana
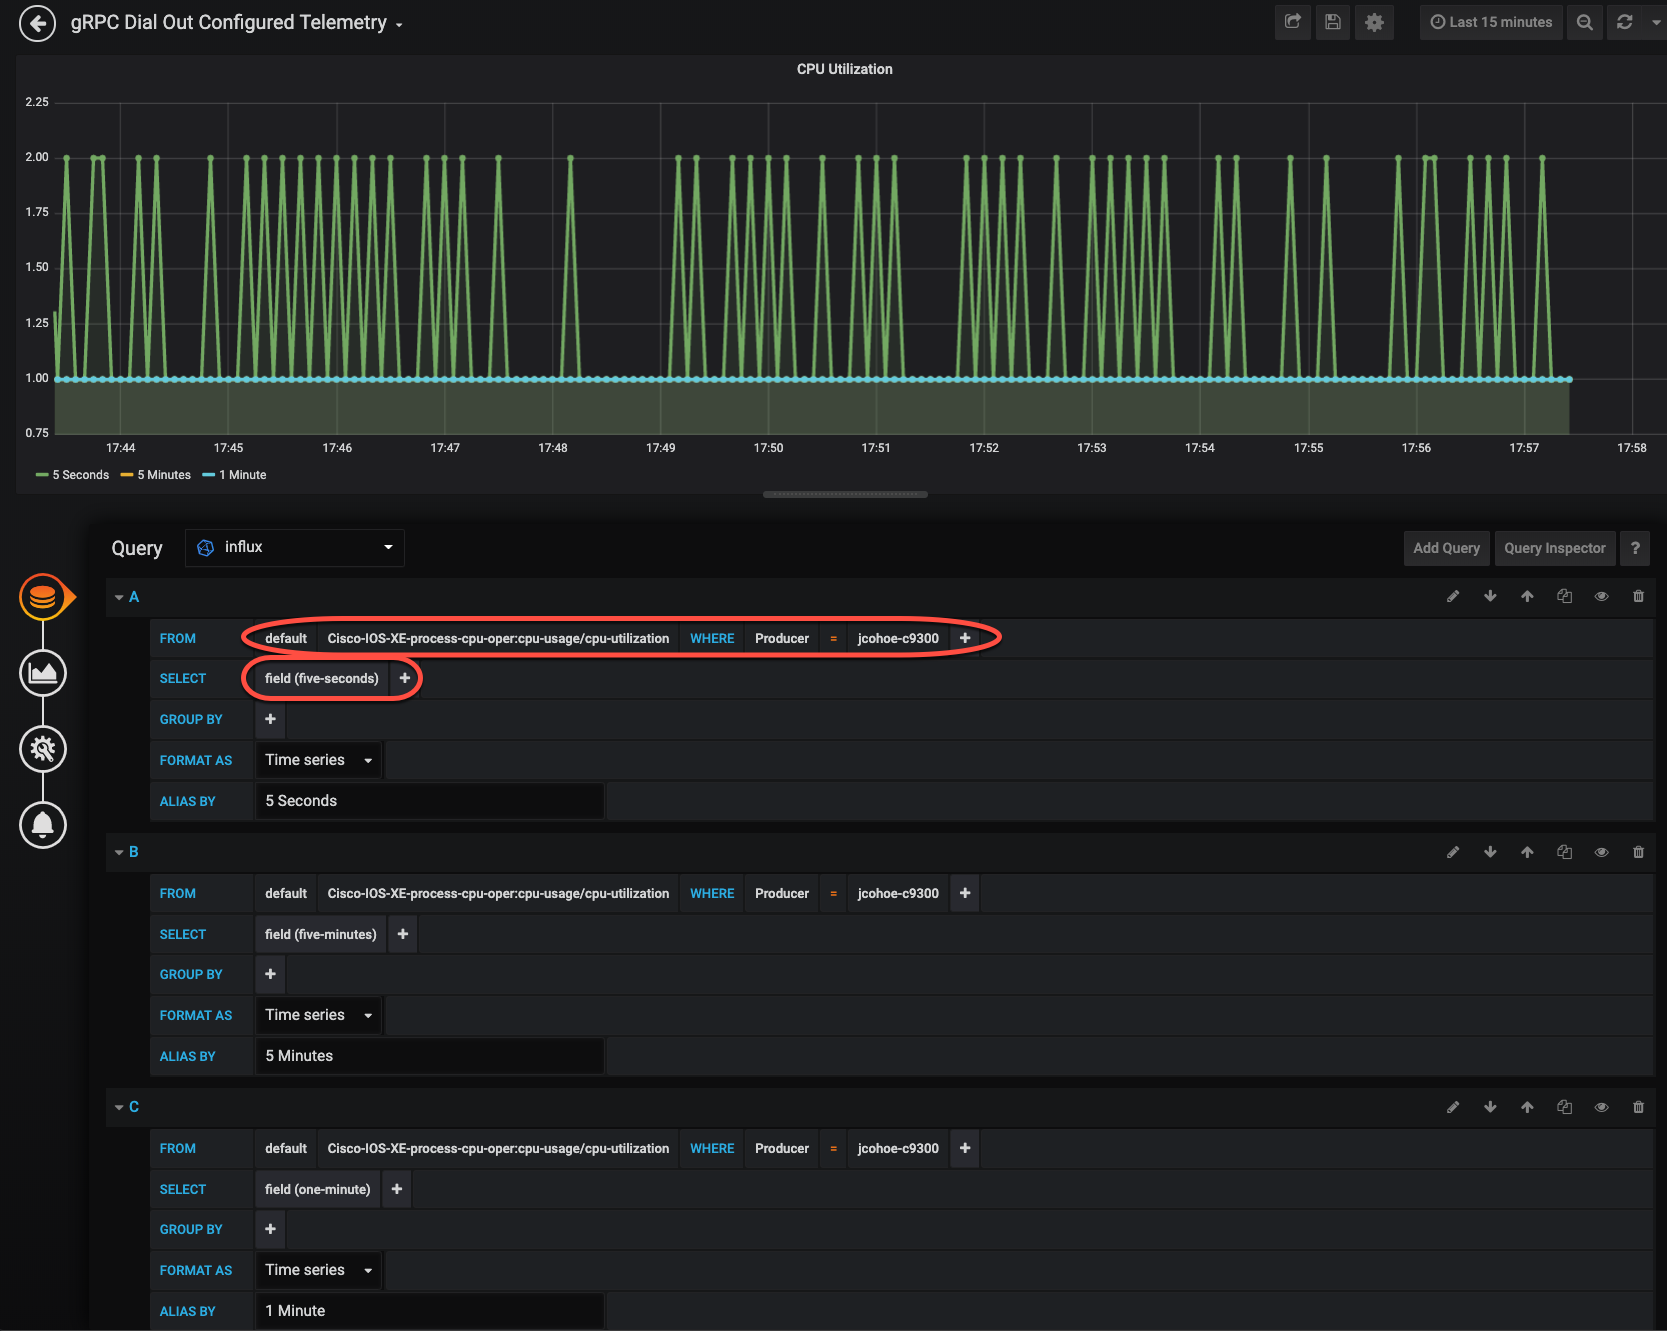
Grafana is the visualization engine that is used to display the telemetry data. It calls into InfluxDB to access the data that is stored there, which is the same data that Telegraf received from IOS XE. In this example there are three unique queries for each of the CPU metrics: five-seconds, five-minutes, and one-minute, and those are shown in the chart. We can see that the 5-second CPU average in green is between 1% and 2%, while the 1 minute CPU average in blue remains at 1%.

Conclusion
We understand why moving away from SNMP is important, and now that additional streaming telemetry protocols are available on IOS XE we can start transitioning towards their use. The open source Telegraf, InfluxDB and Grafana software stack can easily be setup to receive, store, and visualize this data from the network.
References
- Check out the many Telemetry use cases on the new DevNet Network Automation Exchange.
- Programmability Configuration Guide for Cisco IOS XE 16.10 – for details on Model Driven Telemetry
- YANG Models on Github
- YANG Explorer tooling on Github
- cisco_telemetry_mdt plugin on Telegraf Github
We’d love to hear what you think. Ask a question or leave a comment below.
And stay connected with Cisco DevNet on social!
Twitter @CiscoDevNet | Facebook | LinkedIn
Visit the new Developer Video Channel


finally someone demystifying the Telemetry with a good and working example.Now it is much clear for me how Telemetry is really working beside just talking about "Model Driven "
Thanks
awesome stuff buddy – really great blog!
Hi Jeremy
thanks for a great post! Telemetry is so important. Please also have a look at our technology that integrates directly your hardware to build up an ultra rich telemetry dashboard. Cisco + LAWO SMaRT makes for a great turnkey solution for those users that are looking for an out of the box solution. Cheers