
No one who works in technology operations – network management, software engineering, security, or IT – needs to play Whac-A-Mole when they go to the arcade. Because it’s a game we play in real life every day. We focus on the gopher holes in our domains, and keep smacking down the issues as they pop up. Hopefully, fast enough to solve them.
In our jobs, as in Whac-a-Mole, it’s critical that we focus on observing our own domain. It takes a lot of skill and attention to play this game well. And there’s only so far your mole mallet can reach. You can’t play the Whac-a Mole console next to your own game. You can’t even pay attention to it, not if you want to win at the game in front of you.
But the entire arcade is vast, and full of holes. Worse, the gophers burrow between the machines. And there are only so many people available to get the job done.
This is why we’re now talking about Full-Stack Observability.
Keep your systems flying
When an airline passenger using the company’s mobile app can’t re-book a ticket, whose problem is it to solve? Is the problem in the mobile app, the user’s network connection, a cloud service, a compute server, a database, an API call to a transaction processing service… or something else? You cannot solve the problem if you don’t know where it is. Figuring out how to address a performance (or security or efficiency) issue requires both domain expertise and a holistic view of the application that lets you see how one issue affects the larger system.
Full-Stack Observability (FSO) solutions begin to bring these different domains together, centralizing and correlating performance analytics, from application, to network, to cloud and data center.
FSO is becoming more practical as time goes on, thanks to constant improvements in observability in products and services at all levels of the technology stack. But it’s a journey, as they say, to get to analyzing all this data accurately and quickly, and then to remediating the issues.
Currently, it takes more than one area of expertise to continuously monitor an entire tech stack and to optimize for multi-component issues and interactions anywhere they occur. Your knowledge of your unique technology domain is vital to keeping things running well – and to building the automated solutions that can address your specific needs.
As business relies more every day on the smooth running of highly interdependent systems, it’s valuable to learn more about intersecting and overlapping domains. Full-Stack Observability gives you those insights across domains. And the more we can communicate with other people working towards the same goals – like business process performance – the more quickly we will be able to come up with comprehensive improvements, and fixes when the need arises.
We have a few tools at Cisco that can help.
AppDynamics
AppDynamics is primarily an application performance monitoring (APM) tool that provides real-time and alert-based intelligence on applications running across the span of business, from user devices to cloud services. Once AppD baselines the performance of an application, it can continuously compare performance to that, and report deviations. If an application in your stack starts to under-perform, it can tell you where the problem is, down to the line of code or the specific API call. If a particular network component has become slow and is dragging the system, it can alert you. At that point, it might either confirm what your experience tells you the issue is, or give you new insights into your system to help you remediate the issue quickly.
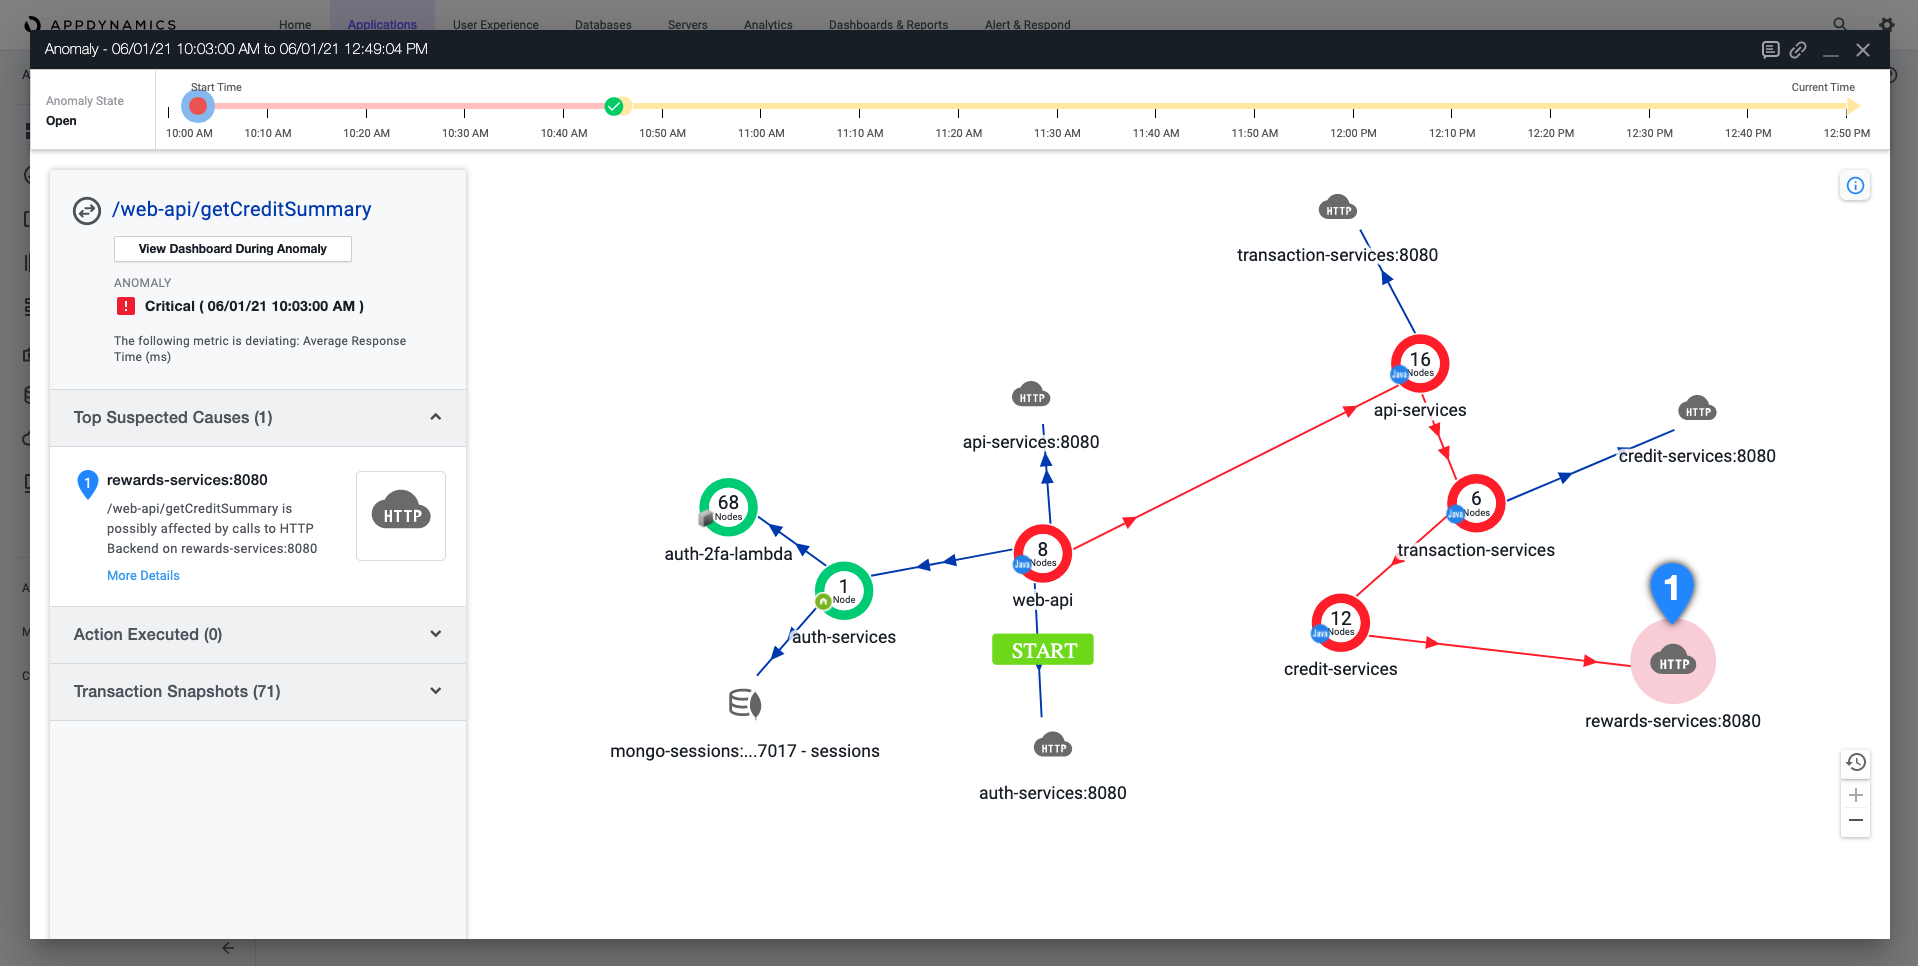 AppDynamics’ basic APM dashboard shows the interactions between
application components and where there might be performance issues.
It is a powerful tool for software coders, DevOps engineers, and site reliability engineers (SREs), as it can help you understand the demands applications are making on the network and how to adapt the infrastructure to keep those apps running smoothly.
AppDynamics can also correlate performance insights back to business KPIs, which helps IT teams to better prioritize their work based on what matters most to the business. See our AppDynamics Dev Center to get started.
ThousandEyes
ThousandEyes illuminates the path your company’s applications take as they use networking infrastructure outside your enterprise network. It lets you see the live connections between infrastructure, data centers, and clouds. Its tools can monitor not just the network behavior between any two processes you control (for example, a front-end app and a back-end database server) but also how the Internet is performing between almost any two major points of presence in the world, thanks to its own network of agents.
ThousandEyes can run synthetic tests that generate IP traffic that imitates user-generated traffic, giving you metrics like response times, page load times, and other key performance indicators before you roll out a new online tool or product. These synthetic tests can run against ThousandEyes global agents, showing you how your application will perform in various regions. And using the platform’s APIs, you can automate these tests whenever updates are pushed into your software repos or network configurations.
Check out this use case put together by Kareem Iskander, Cisco Developer Advocate and DevNet Snack Minute co-host: Automating Test Creation with the ThousandEyes API.
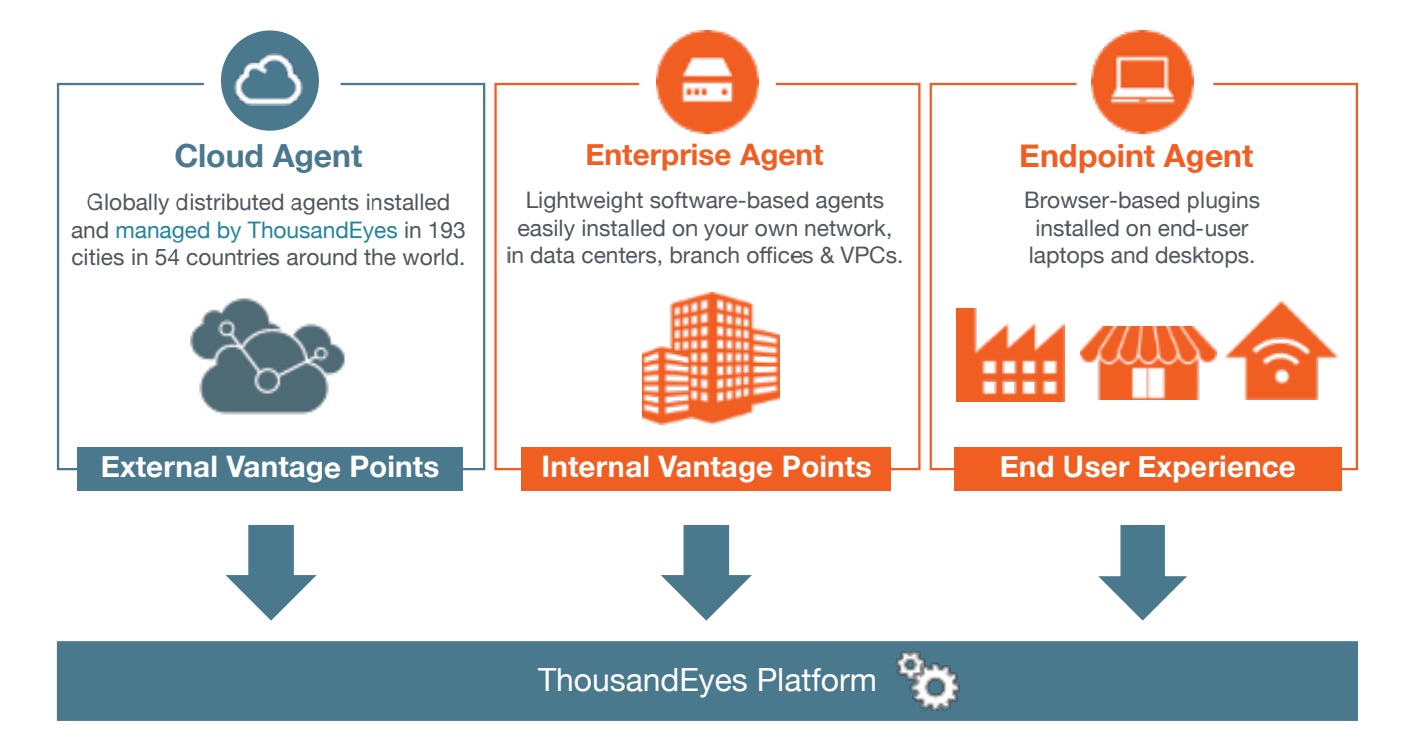 ThousandEyes agents monitor network traffic and performance around
the world, from ISPs and cloud providers to on-prem data centers.
ThousandEyes APIs and webhooks can also be integrated into third party applications such as ServiceNow, for end-to-end ITSM integration, alerting, and immediate remediation of issues.
We’ve found it to be a very useful tool for network engineers, DevOps engineers and SREs.
Intersight
Intersight is a Cloud Operations Platform. It lets you deploy and then control processes in your system of compute and networking infrastructure, from cloud-hosted microservice clusters to on-prem compute servers.
Intersight Workload Optimizer gives you access to adjust, from one interface, the configurations of the services that affect your system’s performance. It integrates with infrastructure provisioning tools like Hashicorp’s Terraform Cloud Business and our own HyperFlex platform for hyperconverged infrastructure.
The product is focused on the physical and virtual machines hosting your processes. In addition to giving you a unified platform to apply the insights provided by AppDynamics and ThousandEyes, it also evens the field between running services in the cloud or on-prem, making it easier to put your processes in the best environment. Or move them as requirements change.
Intersight, like our other tools, can be controlled through its console (“ClickOps”) or programmatically through APIs. Learn more in the Intersight Dev Center.
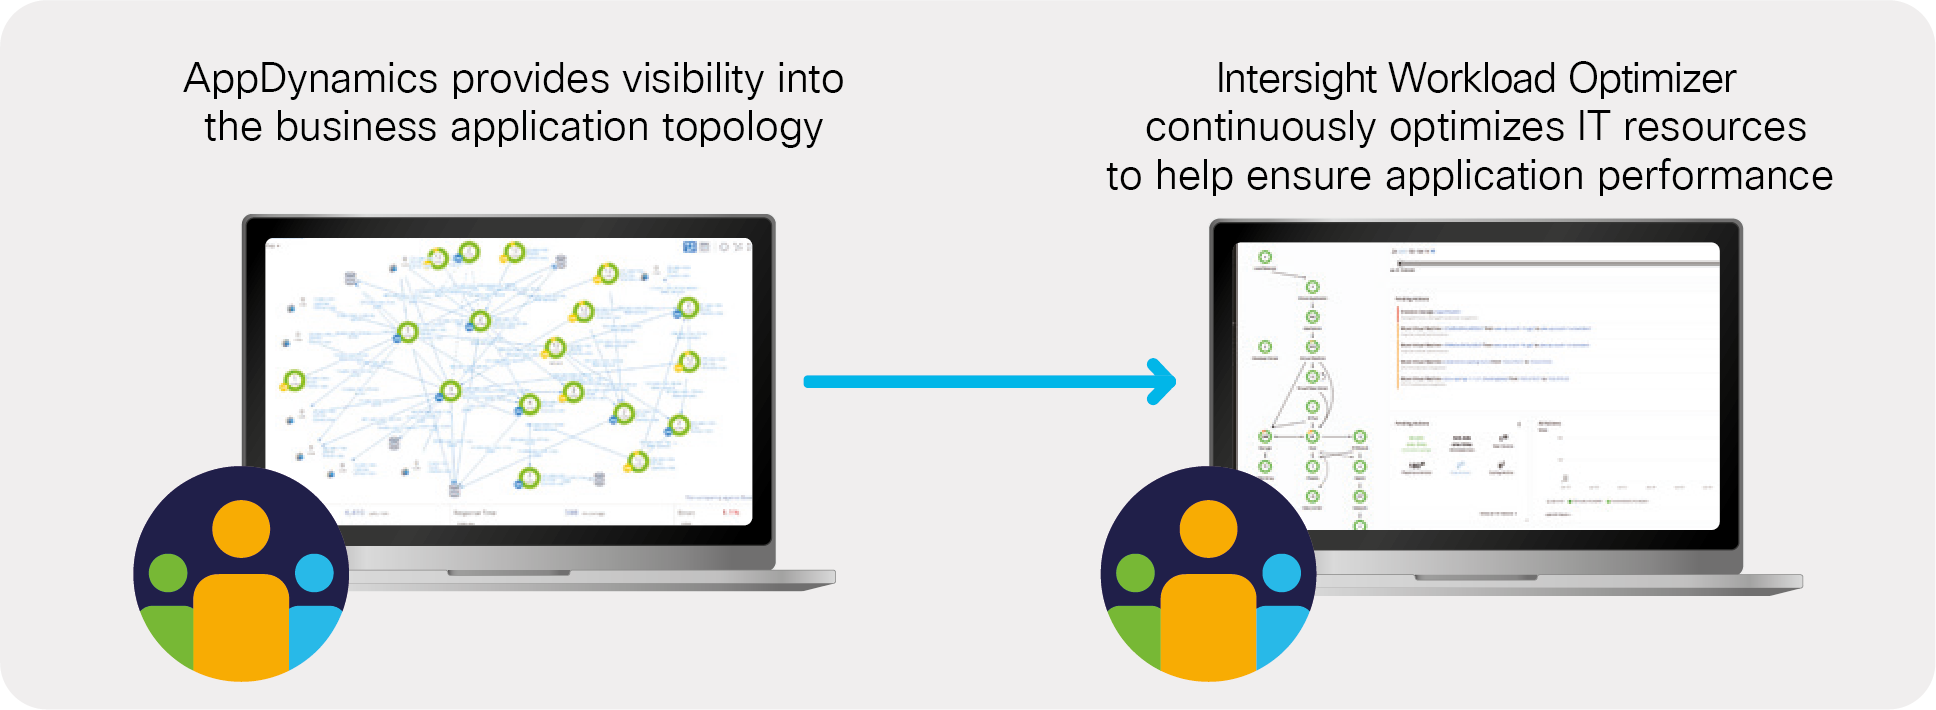 Intersight Workload Optimizer can effect changes based on input
from AppDynamics (and other tools).
Use them together
As we are all aware, business applications and processes are vast, and it takes different people who have unique expertise to run them all. Traditionally, these people have all had their own sets of tools.
Full-Stack Observability shares a vision with DevOps: That the boundaries between teams will grow more porous. With FSO, we add the concept that you will be able to collaborate based on an accepted ground truth of what’s happening in the system overall, so it will be faster to determine which specialty should be called on when something needs to be improved.
With the tools discussed here – AppDynamics for correlating user experience to business, ThousandEyes for understanding the impact of the network itself, and Intersight for connecting those insights deep into infrastructure – we can both observe and control the full stack of a technological business process.
See our updated Cloud Developer Center for more useful guides to the new Hybrid Cloud.
Learn more:
- Cisco – the Bridge to an API-first, Cloud Native World, by Liz Centoni
- Improving Application Experience with Full-Stack Observability, by Jeff Scheaffer
- Applications are driving digital transformation, by Linda Tong
- Helping Customers Redefine Network Operations with Catalyst 9000 and IOS-XE APIs, by Jeremy Cohoe
We’d love to hear what you think. Ask a question or leave a comment below.
And stay connected with Cisco DevNet on social!
Twitter @CiscoDevNet | Facebook | LinkedIn
Visit the new Developer Video Channel


Excellent analogy, along with fantastic explanations and examples of combining these technologies for maximum efficiency in full-stack observability.