
In October, Cisco launched two new simple-to-deploy sensor solutions:
- Meraki MT sensors – ideal to monitor indoor IT facilities like network closets or in the data center
- Cisco Industrial Asset Vision sensors – IP67 ruggedized outdoor sensors to monitor OT assets and facilities in outdoor and industrial indoor spaces
When you deploy hundreds or even thousand sensors, you can easily lose track of your assets. One of the most important things for operators is to have an intuitive data visualization, or dashboard, that can clearly and easily show what is wrong and what is a normal operation.
So, wouldn’t it be great to have just one big dashboard for all these different sensors? Operators can see on just one screen how their assets, either outdoor or indoor, are doing and if actions are required. But how can a developer get the data?
This is exactly what this blog is about: you will see how easy it is to gather data from both IoT solutions and insert it into an Influx time series database and visualize it with a Grafana dashboard. Furthermore, the pre-built dashboard is very easy and fast to install with Docker Compose.
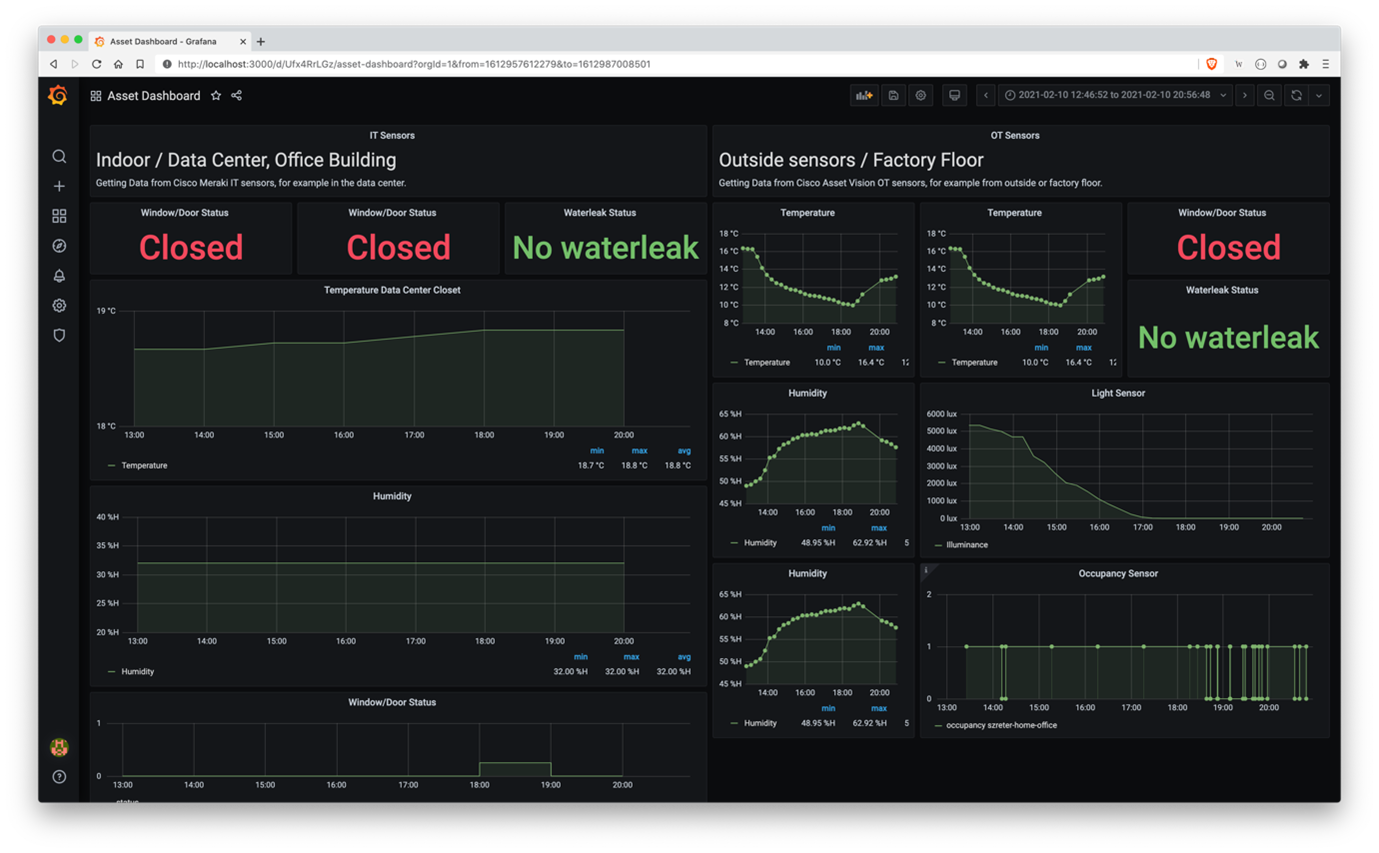 Pre-built example dashboard
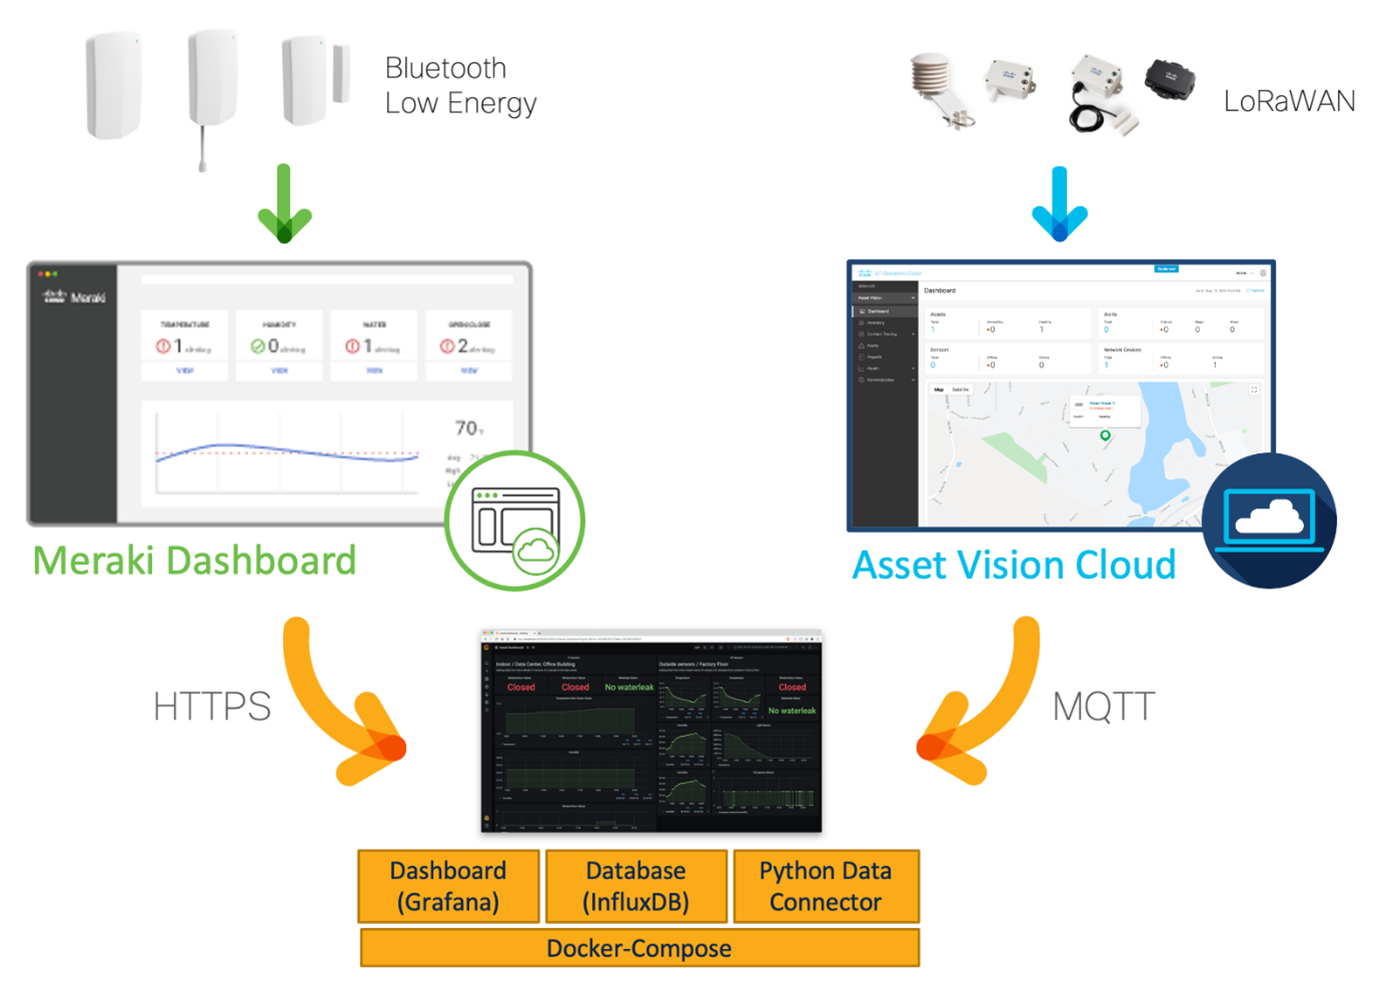
The Architecture & Installation
The architecture is pretty simple: The current and historical data from the Meraki MT sensors can easily be requested via the Meraki Dashboard API (be aware, they are still in the beta phase). The sensor data from the LoRaWAN sensors are forwarded to a MQTT broker which can be configured in the Cisco Industrial Asset Vision cloud. You can either get a free or paid cloud based MQTT broker or run this container-stack where you can open the required MQTT-port and have a public IP available.
For the installation, simply download the files from the Git repository, insert your credentials/API keys and spin up all containers with Docker Compose. After that, you just need to select what measurement you would like to visualize on the dashboard, and it’s done.
If you would like to try it on your own
Check out this YouTube video:.
Find documentation in the repository with a more detailed description and demo:
Related resources
We’d love to hear what you think. Ask a question or leave a comment below.
And stay connected with Cisco DevNet on social!
Twitter @CiscoDevNet | Facebook | LinkedIn
Visit the new Developer Video Channel


Flo, great topic and super easy to follow, thx!