
Building a detection usually involves more than writing a search. You need to understand the data, test the detection logic, normalize fields, decide how analysts will see the results, configure risk, and provide a path for further investigation.
Those tasks can require moving between several different parts of Splunk. While developing a detection for Cisco Secure Network Analytics (SNA), I used the Splunk Detection Editor (Alpha) to bring much of that workflow into one place.
Our goal was to take active SNA alarms, associate them with the source systems responsible for the activity, and add that information to the Splunk Enterprise Security risk index. Along the way, we used the editor to develop and test the SPL, associate sample data with the detection, configure risk scoring, reference CIM fields, and create an investigation drilldown.
Why use risk-based alerting?
A traditional detection can create an analyst-facing alert every time its search conditions are met. This works well for high-confidence activity, but it can also generate a large number of isolated alerts that analysts must review individually.
Risk-based alerting takes a different approach. Instead of treating every observation as an incident, detections can create risk events associated with entities such as systems or users. Multiple risk events can then accumulate and contribute to a higher-fidelity security story.
Splunk Enterprise Security stores these observations in the risk index. Risk incident rules can correlate activity involving the same entity and generate a risk notable when the accumulated score, behavior, or other criteria warrant an investigation. This allows analysts to investigate connected behavior over time instead of reviewing every event in isolation. Splunk’s RBA documentation provides a more detailed explanation of this process.
This approach was a good match for our SNA data. An individual SNA alarm may be interesting, but it may not always justify interrupting an analyst. If that same source system also generates firewall detections, unusual DNS activity, or other suspicious behavior, the combined activity becomes much more meaningful.
The SNA detection therefore acts as one source of risk evidence. It adds an observation to the source system’s risk history, where it can be correlated with detections from other security products.
Developing the detection in one workspace
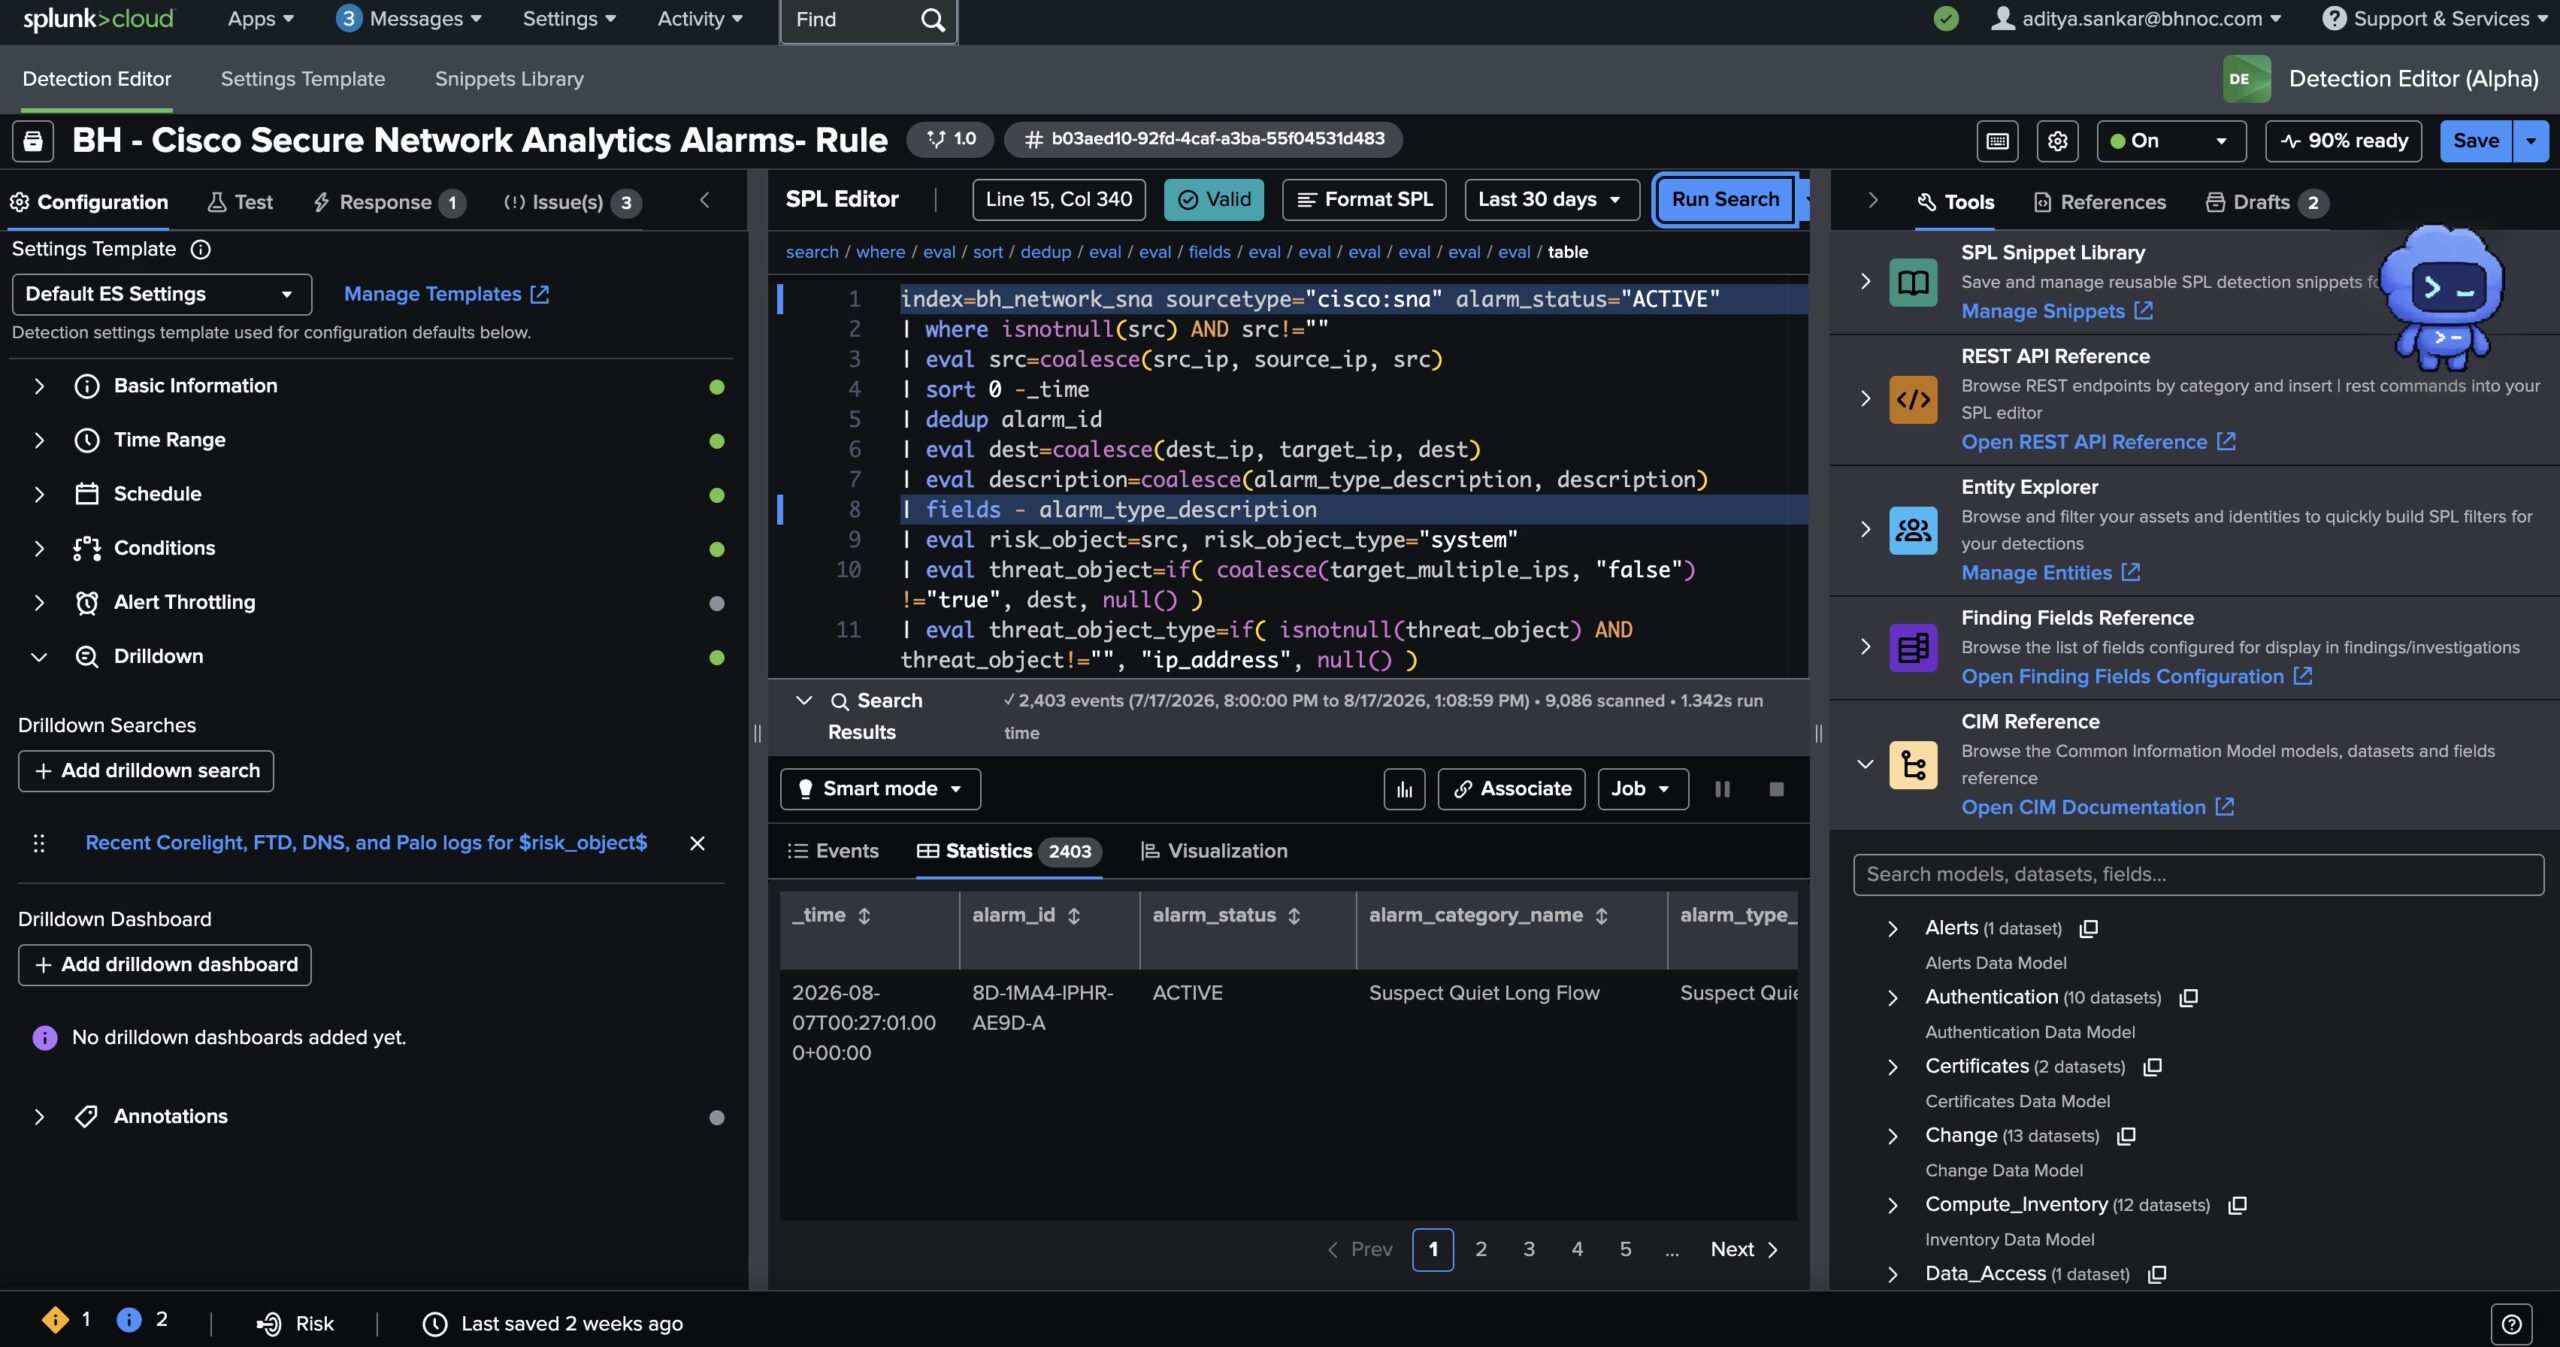
The Detection Editor provides a workspace for building the search while configuring the other parts of the detection.
The SPL editor highlights syntax problems, provides field completion, formats the search, and can suggest potential improvements. Search results are displayed directly below the editor, making it possible to adjust the search and immediately see how the returned events change.
The surrounding panels contain the detection’s schedule, conditions, response actions, risk configuration, references, and drilldown searches. This made it easier to think about the complete detection rather than treating the SPL, risk response, and analyst experience as separate tasks.
Associating sample data with the detection
One of the most useful capabilities was the ability to associate sample events with the detection.
A search can be syntactically valid while still producing unexpected results. A field may only be present in some events, a destination may represent multiple systems, or a token used in a risk message may not be returned by the final search.
By testing the detection against representative SNA events, we could make small changes and immediately see their effect on the output. This helped us confirm that:
- The source IP was populated consistently
- Duplicate alarm IDs were removed
- The alarm description was available
- Aggregate destination values were handled correctly
- Fields referenced by the risk response were present
- The final results contained useful context for an analyst
This shortened the feedback loop between editing the SPL and understanding how the detection would behave with actual data.
It was especially helpful when working with data that had several possible field names. Rather than assuming every event followed the same structure, we could test the normalization against real examples.
Using the field references
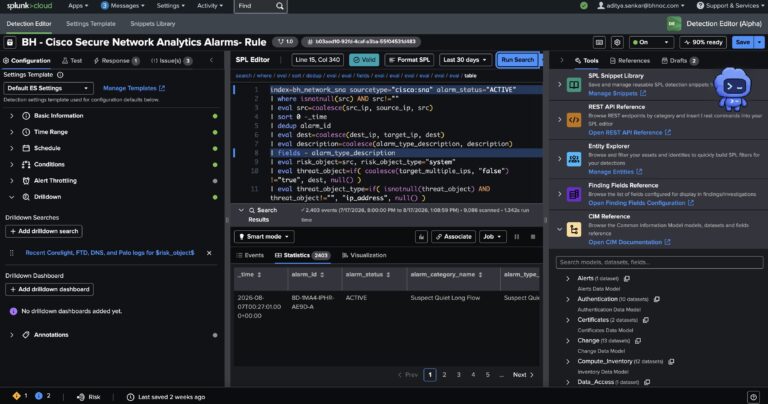
The Detection Editor also includes references that are useful while designing the search output.
The CIM Reference allows the detection author to browse Common Information Model data models, datasets, and fields. We used it when deciding how to normalize SNA-specific fields into names that would be more consistent with other Splunk security data.
The Finding Fields Reference shows the fields configured for display in findings and investigations. This helps answer a slightly different question: which fields will provide useful information when an analyst views the detection in the analyst queue?
Together, these references encouraged us to think beyond whether the search simply returned results. We also considered whether those results would be understandable and useful during an investigation.
Generating the SNA detection SPL
The SPL was an important part of the process, but the search itself was relatively straightforward.
We searched for active SNA alarms, removed duplicate alarm IDs, and normalized fields that could appear under different names. For example:
| eval src=coalesce(src_ip, source_ip, src)
| eval dest=coalesce(dest_ip, target_ip, dest)
| eval description=coalesce(alarm_type_description, description)
This gave the detection consistent src, dest, and description fields regardless of which original SNA field was populated.
The editor’s field completion and syntax validation helped while building the search. More importantly, the integrated results allowed us to verify that the normalized fields were populated before using them elsewhere in the detection.
Connecting SNA to risk-based alerting
The most important configuration decision was selecting the risk object.
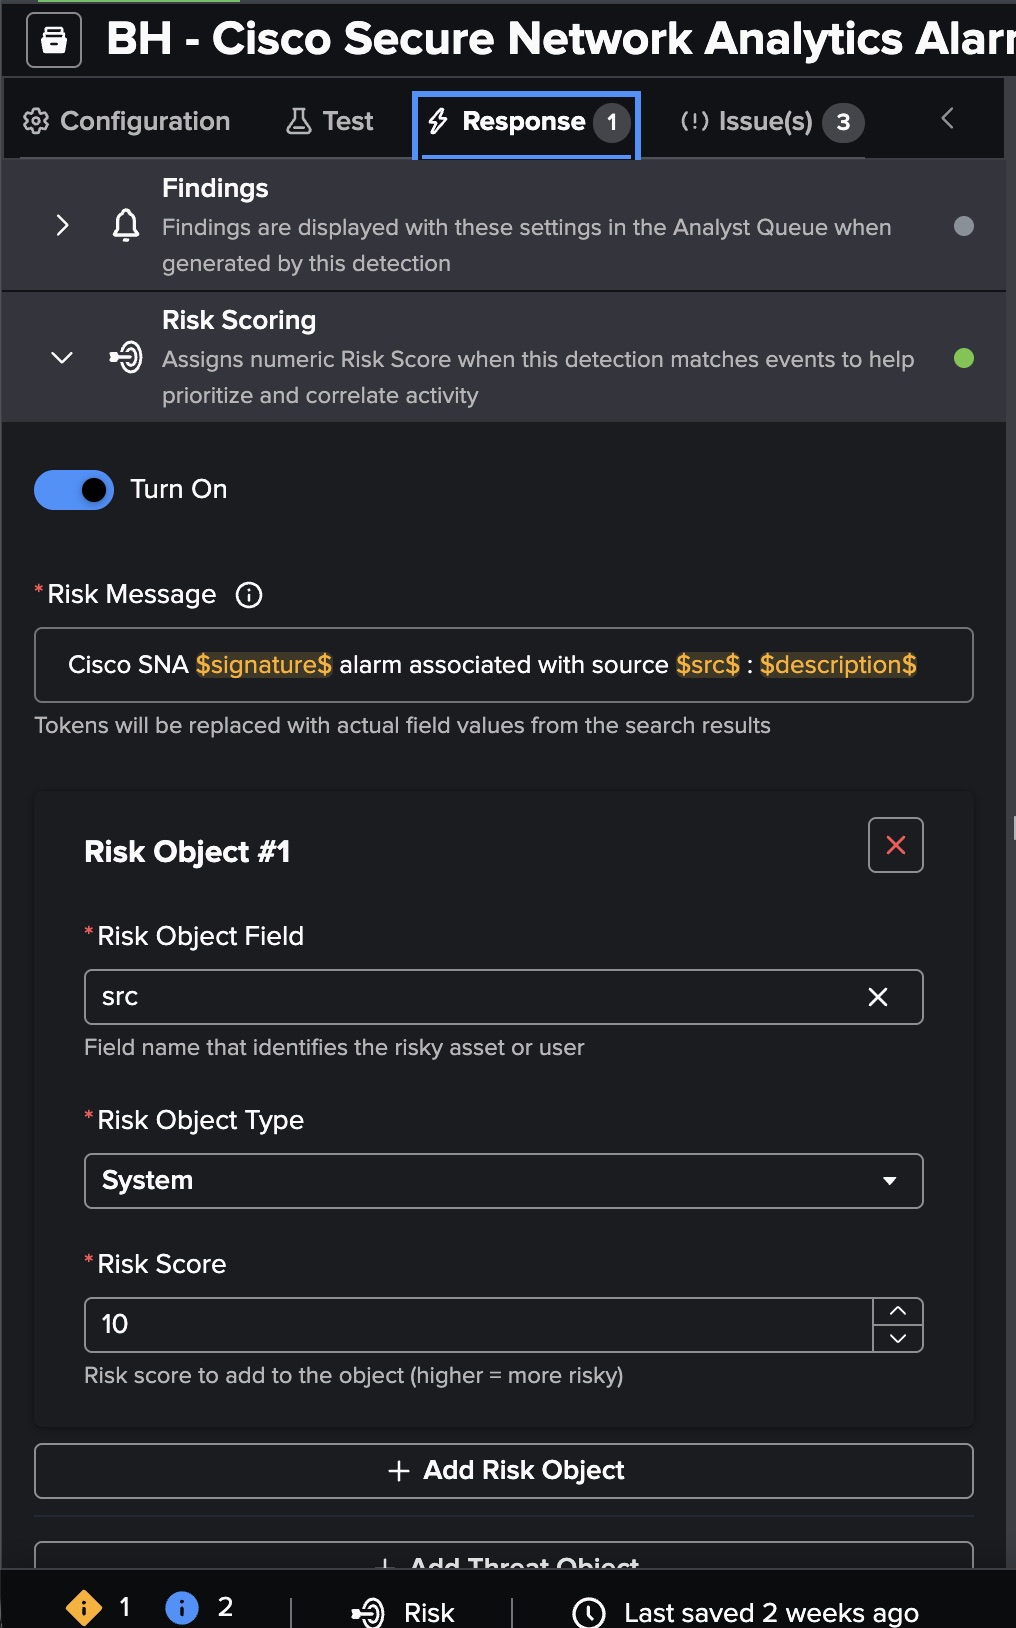
For this detection, we used the source IP because SNA alarms generally describe behavior associated with a source observed on the network. The risk configuration was:
- Risk Object Field: src
- Risk Object Type: System
- Risk Score: 10
When the detection runs, the source IP receives a risk event with a score of 10. That score is not necessarily meant to declare the system compromised. It represents one piece of evidence that can contribute to the system’s overall risk.
This is where consistent field normalization becomes important. Risk events for the same entity need to use a consistent risk object so Splunk Enterprise Security can associate them correctly. Splunk defines the risk object, its type, and its score as key parts of a risk event. The risk notable field documentation describes how these values are used.
We started with a score of 10 so we could observe and tune the detection. A future version could vary the score based on the SNA alarm severity, category, confidence, or the importance of the affected asset.
Handling the threat object
The destination was useful context, but it was not appropriate to treat every destination as a threat object.
Some SNA alarms refer to a single target, while others describe behavior involving multiple destination IP addresses. Attaching a single destination to an aggregate alarm could give the analyst an incomplete or misleading view.
We therefore retained the destination as a threat object only when the alarm did not indicate multiple targets. When SNA reported an aggregate destination, the threat object was left empty and the destination information remained available as supporting context.
This allowed the risk event to retain useful information without implying a level of precision that was not present in the original alarm.
Making the risk event understandable
We configured a risk message using fields returned by the search:
Cisco SNA $signature$ alarm associated with source $src$: $description$
The tokens are replaced with values from the matching event when the detection runs. This gives the analyst a short explanation of the observation, the source system involved, and a description of the SNA alarm.
Associating sample data with the detection helped validate that each of these token fields was present. The editor could also warn when it could not validate a token, prompting us to review the final search results before enabling the detection.
Providing a path for investigation
Adding risk is useful, but the resulting event should also help the analyst understand what the system was doing around the time of the alarm.
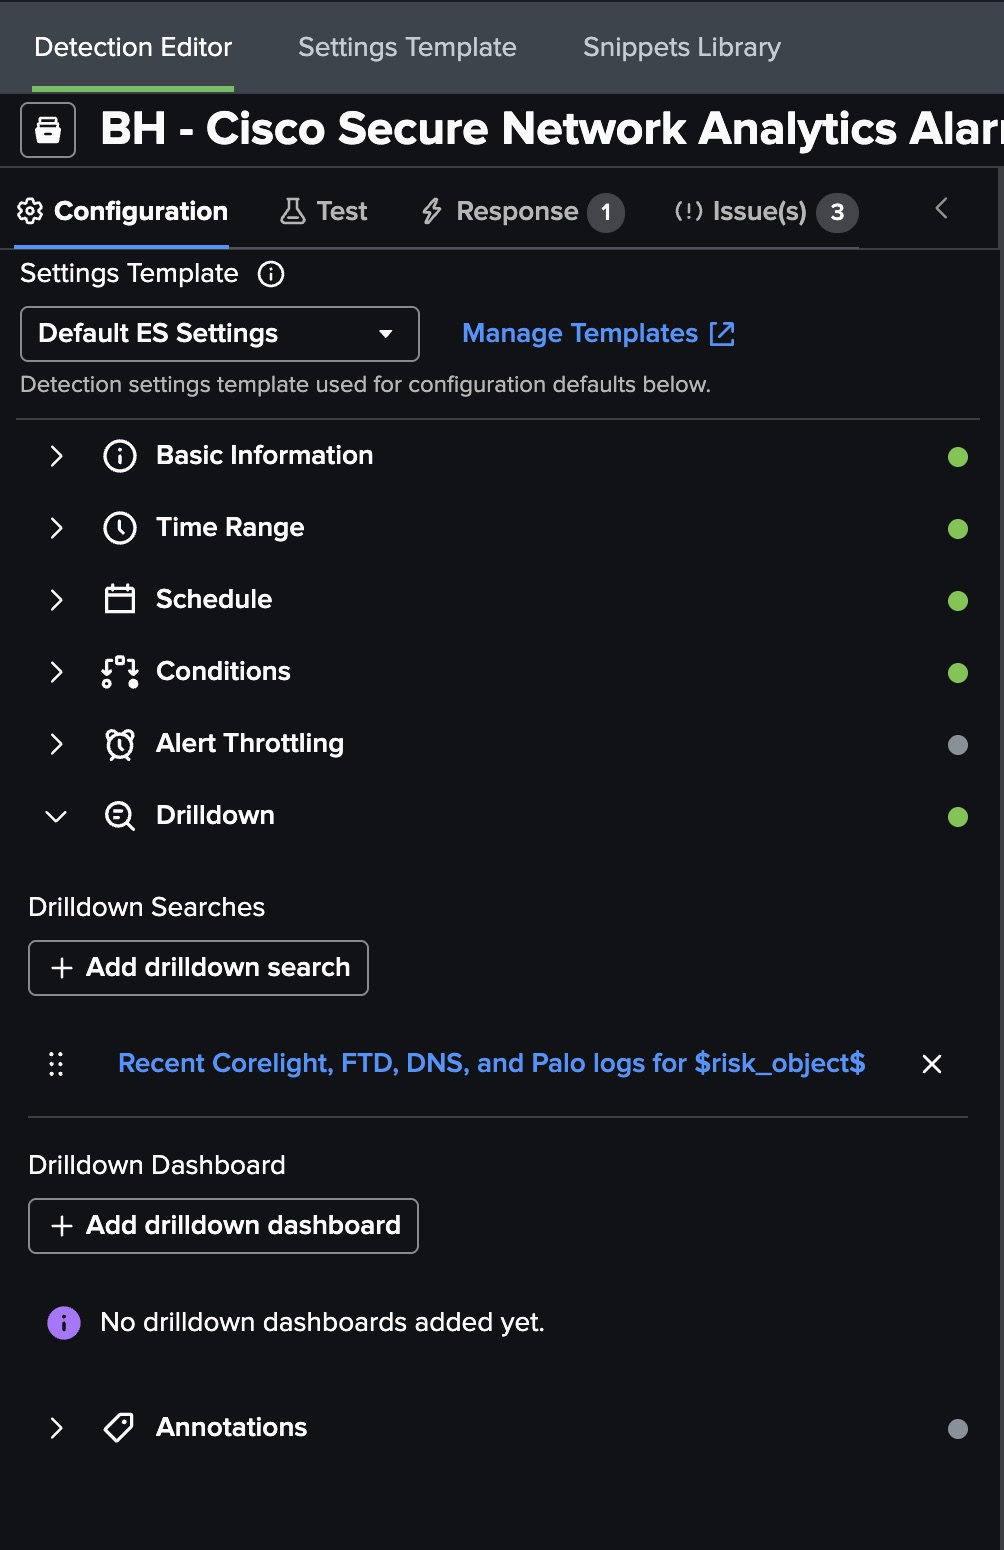
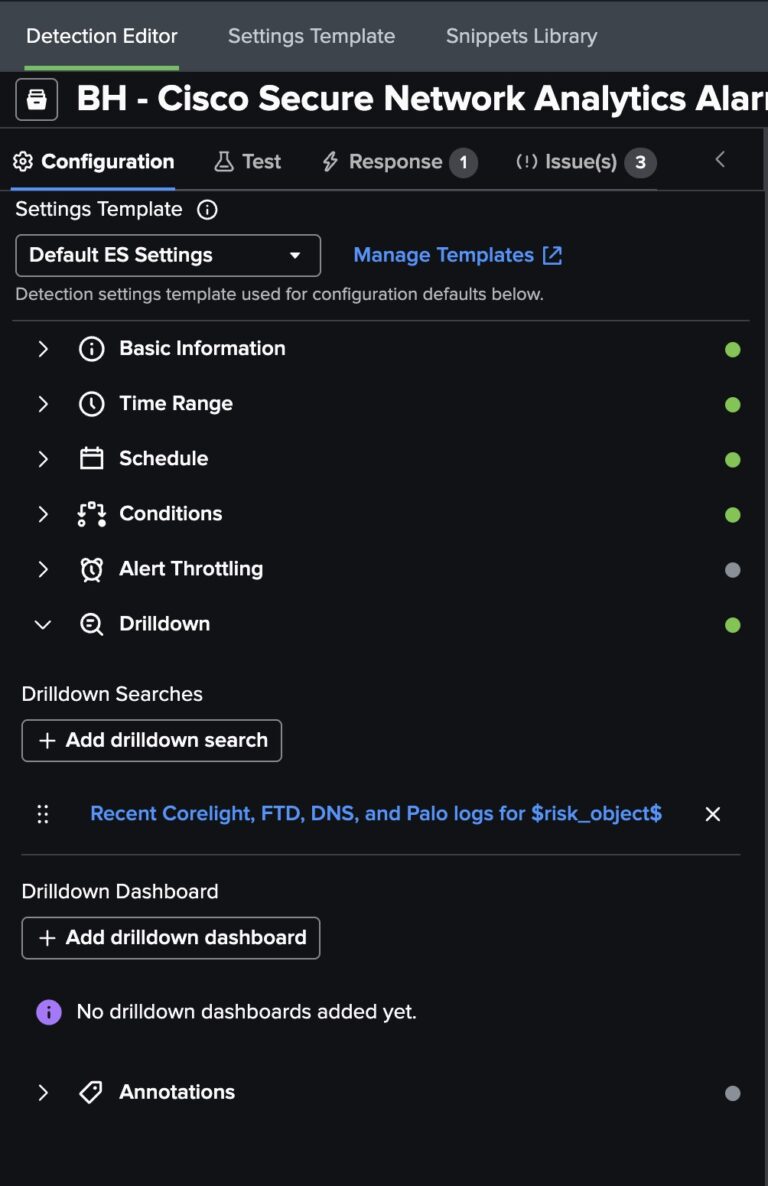
We created a drilldown named:
Recent Corelight, FTD, DNS, and Palo Logs for $risk_object$
The drilldown uses the source IP as its pivot and searches related network activity across SNA, Corelight, Cisco Secure Firewall, Palo Alto Networks, and DNS data.
It returns details such as connection direction, ports, protocols, firewall actions, applications, DNS queries, URLs, signatures, network zones, and bytes transferred.
This gives the analyst a focused view of activity surrounding the SNA alarm without requiring them to manually build searches across multiple data sources.
Scheduling and enabling the detection
After validating the search and response configuration, we scheduled and enabled the detection.
Each matching SNA alarm can now create a risk event associated with its source system. Those risk events can accumulate alongside observations from other detections. A risk incident rule can then surface the combined activity when it becomes significant enough to investigate.
That distinction is important. The detection is not simply turning every SNA alarm into another alert. It is turning the alarm into risk evidence that can contribute to a broader security story.
Final thoughts
The Detection Editor (Alpha) made the end-to-end detection development process easier to follow. It brought together SPL editing, syntax validation, search results, sample data testing, field references, risk configuration, drilldowns, and scheduling in a single workspace.
The SPL still matters, but detection engineering involves much more than producing a valid search. We also need to understand what entity the activity belongs to, how much risk it should contribute, what context an analyst will see, and how the analyst can continue the investigation.
By combining the SNA alarm with an identified risk object, a readable risk message, and a cross-data-source drilldown, we created a detection that contributes to risk-based alerting instead of creating another isolated alert.
That is where the Detection Editor was most valuable: it helped us develop the search and the analyst workflow together.
Scheduling the detection
Once the SPL, fields, risk response, and drilldown were configured, the final step was to schedule and enable the detection.
When the scheduled search identifies a qualifying active SNA alarm, Splunk creates a risk event associated with the source system. Those events can then contribute to the system’s broader risk history and appear alongside other detections involving the same entity.
This is where the detection becomes more than a search. It connects the SNA alarm to an entity, provides a human-readable explanation, adds risk, and gives the analyst an immediate path to investigate related activity.
Final thoughts
The Detection Editor (Alpha) brought several normally separate parts of detection development into one workflow. I could write and validate SPL, test it against representative data, look up CIM and finding fields, configure risk, build an investigation drilldown, and schedule the detection without constantly moving between different parts of Splunk.
As an Alpha experience, there were still occasional validation warnings that required a closer look. In particular, token validation could be conservative even when the necessary fields were present in the final results. Testing the detection with actual events remained important.
For this SNA use case, the result was a detection that does more than report an active alarm. It identifies the source system as the risky entity, preserves the relevant alarm context, and gives analysts a direct path into the supporting network activity.
That is the real value of the workflow: reducing the distance between network telemetry, risk, and investigation.
Check out the other blogs by our team at Black Hat USA.
- Building the Agentic SOC, One Live Event at a Time
- Safeguarding DNS With Secure Access at Black Hat
- Thrown into the SOC – A Black Hat First-Timer’s Story
- Troubleshooting Wi-Fi at Black Hat USA 2026 with ThousandEyes
- Distributed Latency Monitoring at Black Hat
About Black Hat
Black Hat is the cybersecurity industry’s most established and in-depth security event series. Founded in 1997, these annual, multi-day events provide attendees with the latest in cybersecurity research, development, and trends. Driven by the needs of the community, Black Hat events showcase content directly from the community through Briefings presentations, Trainings courses, Summits, and more. As the event series where all career levels and academic disciplines convene to collaborate, network, and discuss the cybersecurity topics that matter most to them, attendees can find Black Hat events in the United States, Canada, Europe, Middle East and Africa, and Asia. For more information, please visit www.BlackHat.com.