



Data centers are evolving and so are the network fabrics, especially with the advent of AI. The demand is no longer just about operating and managing complex infrastructure, but being able to successfully navigate through changes, ensure reliability, anticipate scale, facilitate full lifecycle management, preempt security threats, mitigate risks, and guarantee compliance. All this, while incorporating AI for impactful performance in an easy, seamless, and simple way.
Achieving unified network visibility with Cisco Nexus One
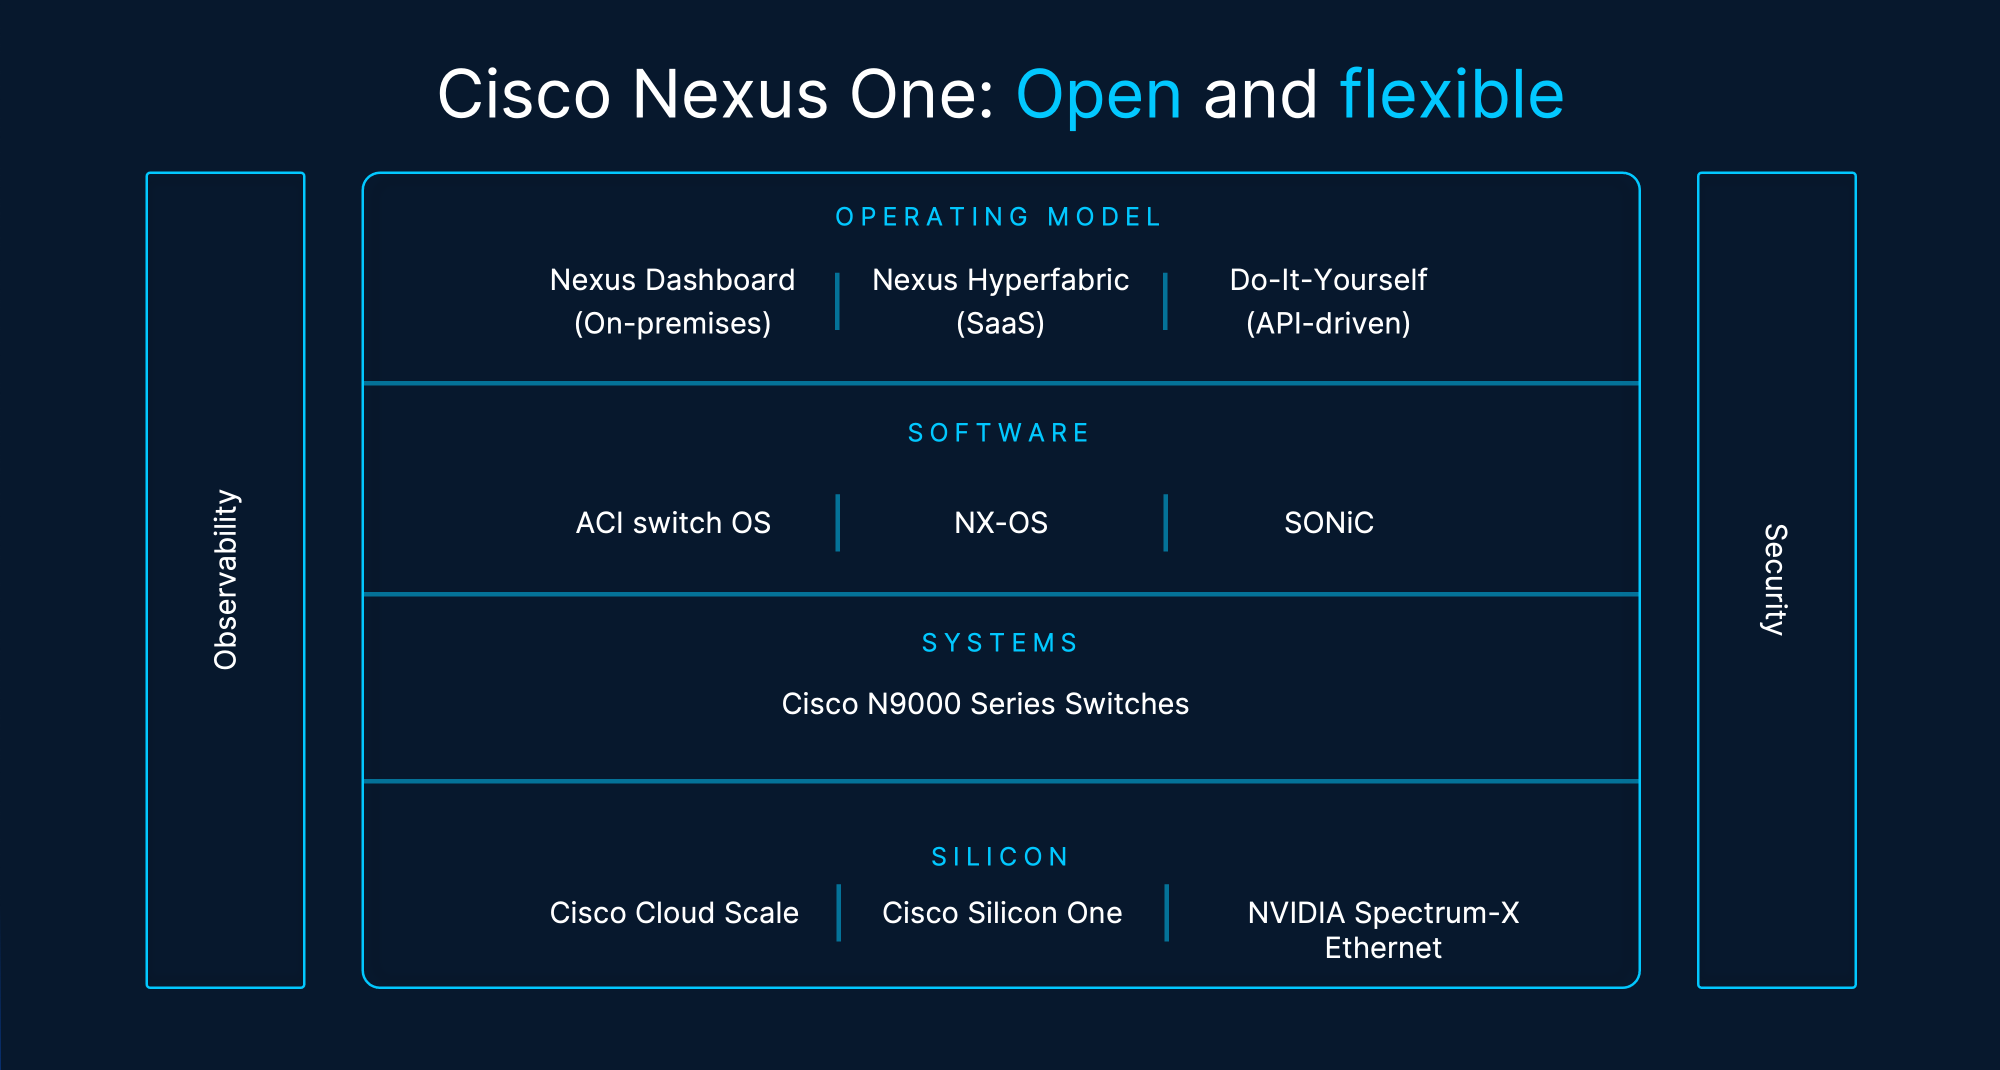
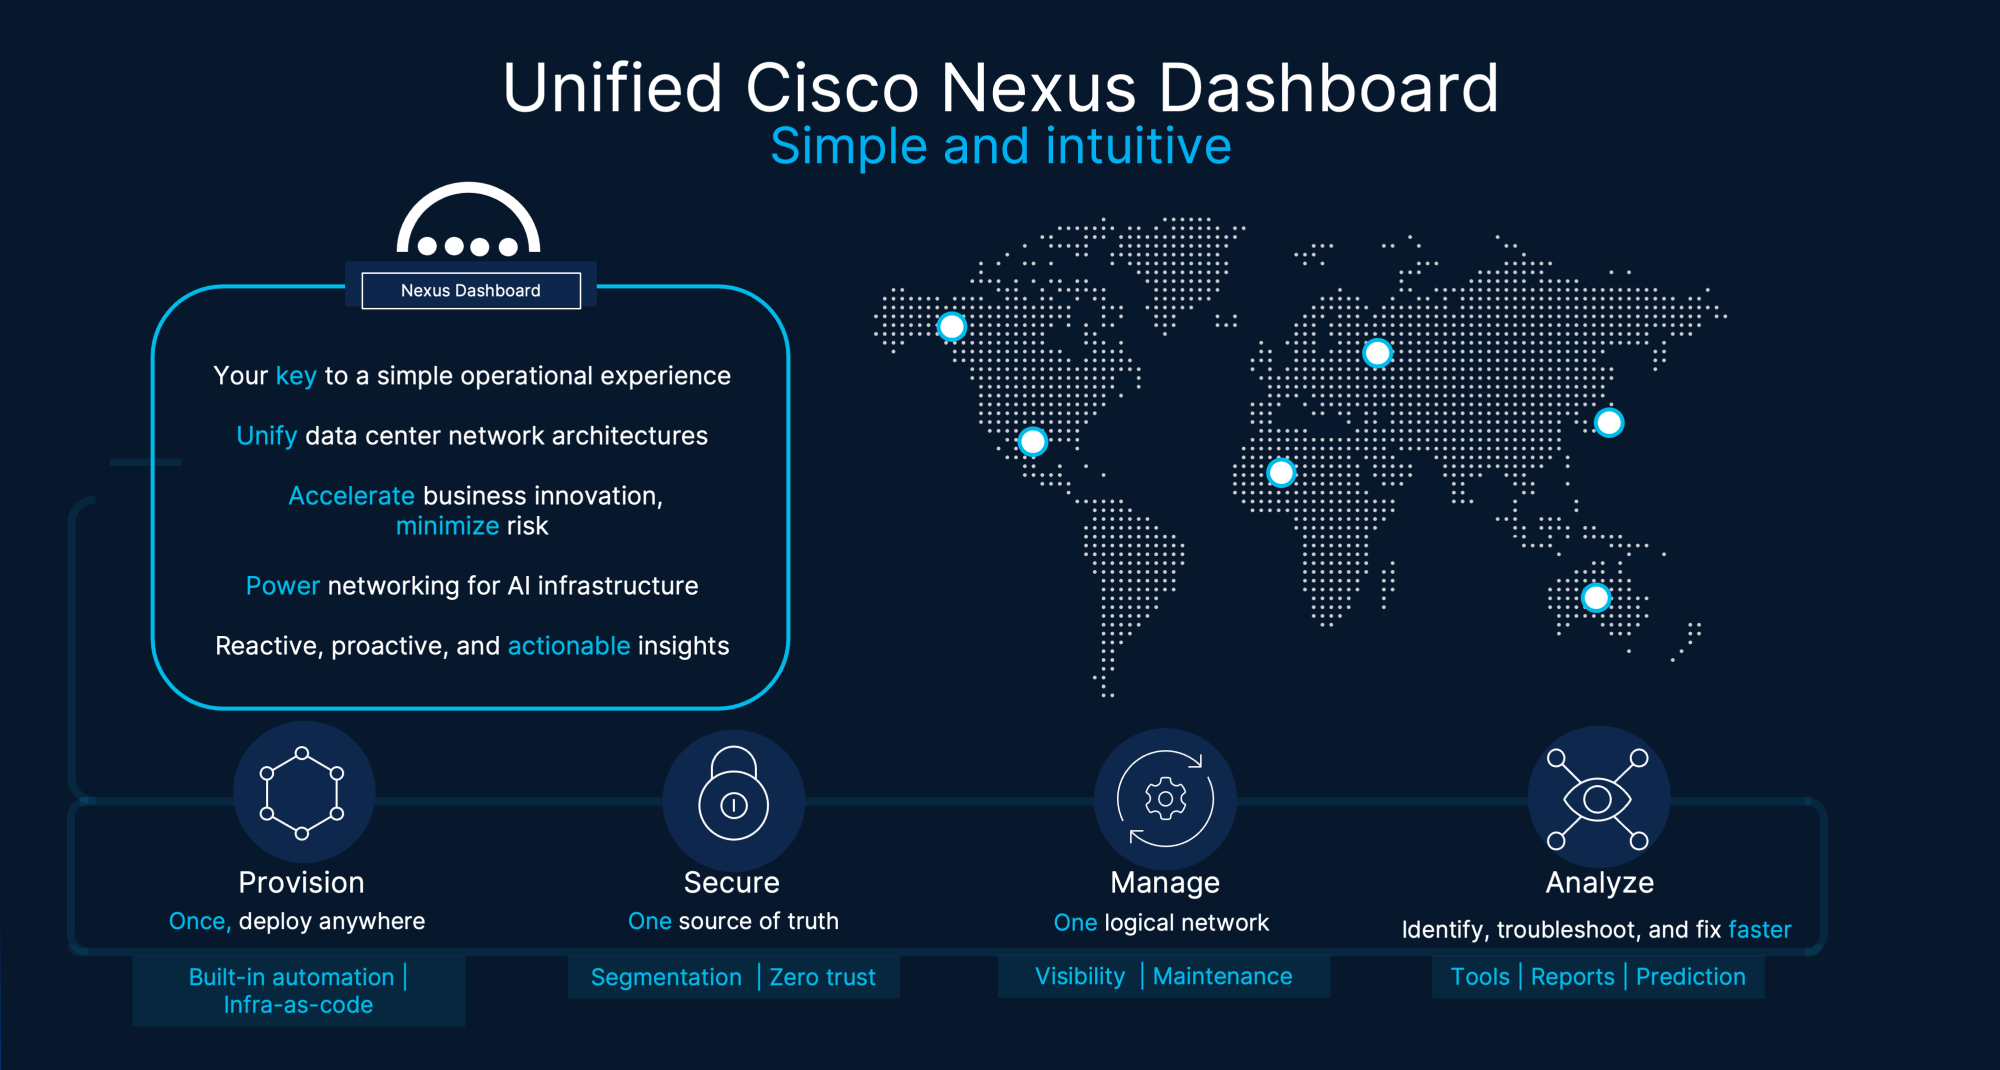
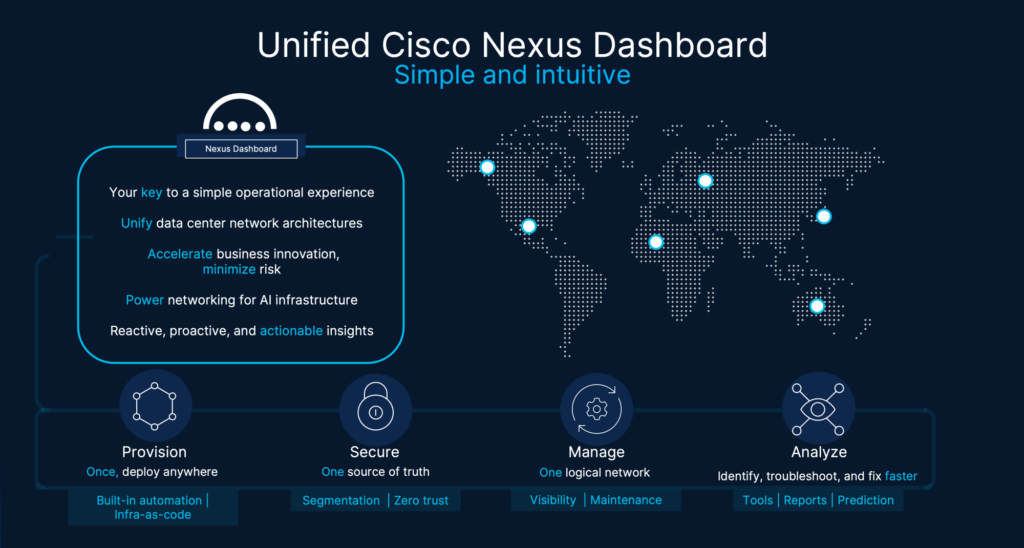
To meet such demand, we need one trusted, unified view of the network. We need a guide that sees everything, secures everything, and simplifies everything, and that guide is Cisco Nexus Dashboard, the on-premises operating model for Cisco Nexus One. Cisco Nexus One is a transformative, open, unified architecture that integrates silicon, systems, software, and a single operating model with embedded security and observability at every layer. It delivers operational consistency and flexibility across AI and enterprise cloud environments, supporting massive AI clusters and diverse workloads.
Understanding the importance of network packet visibility
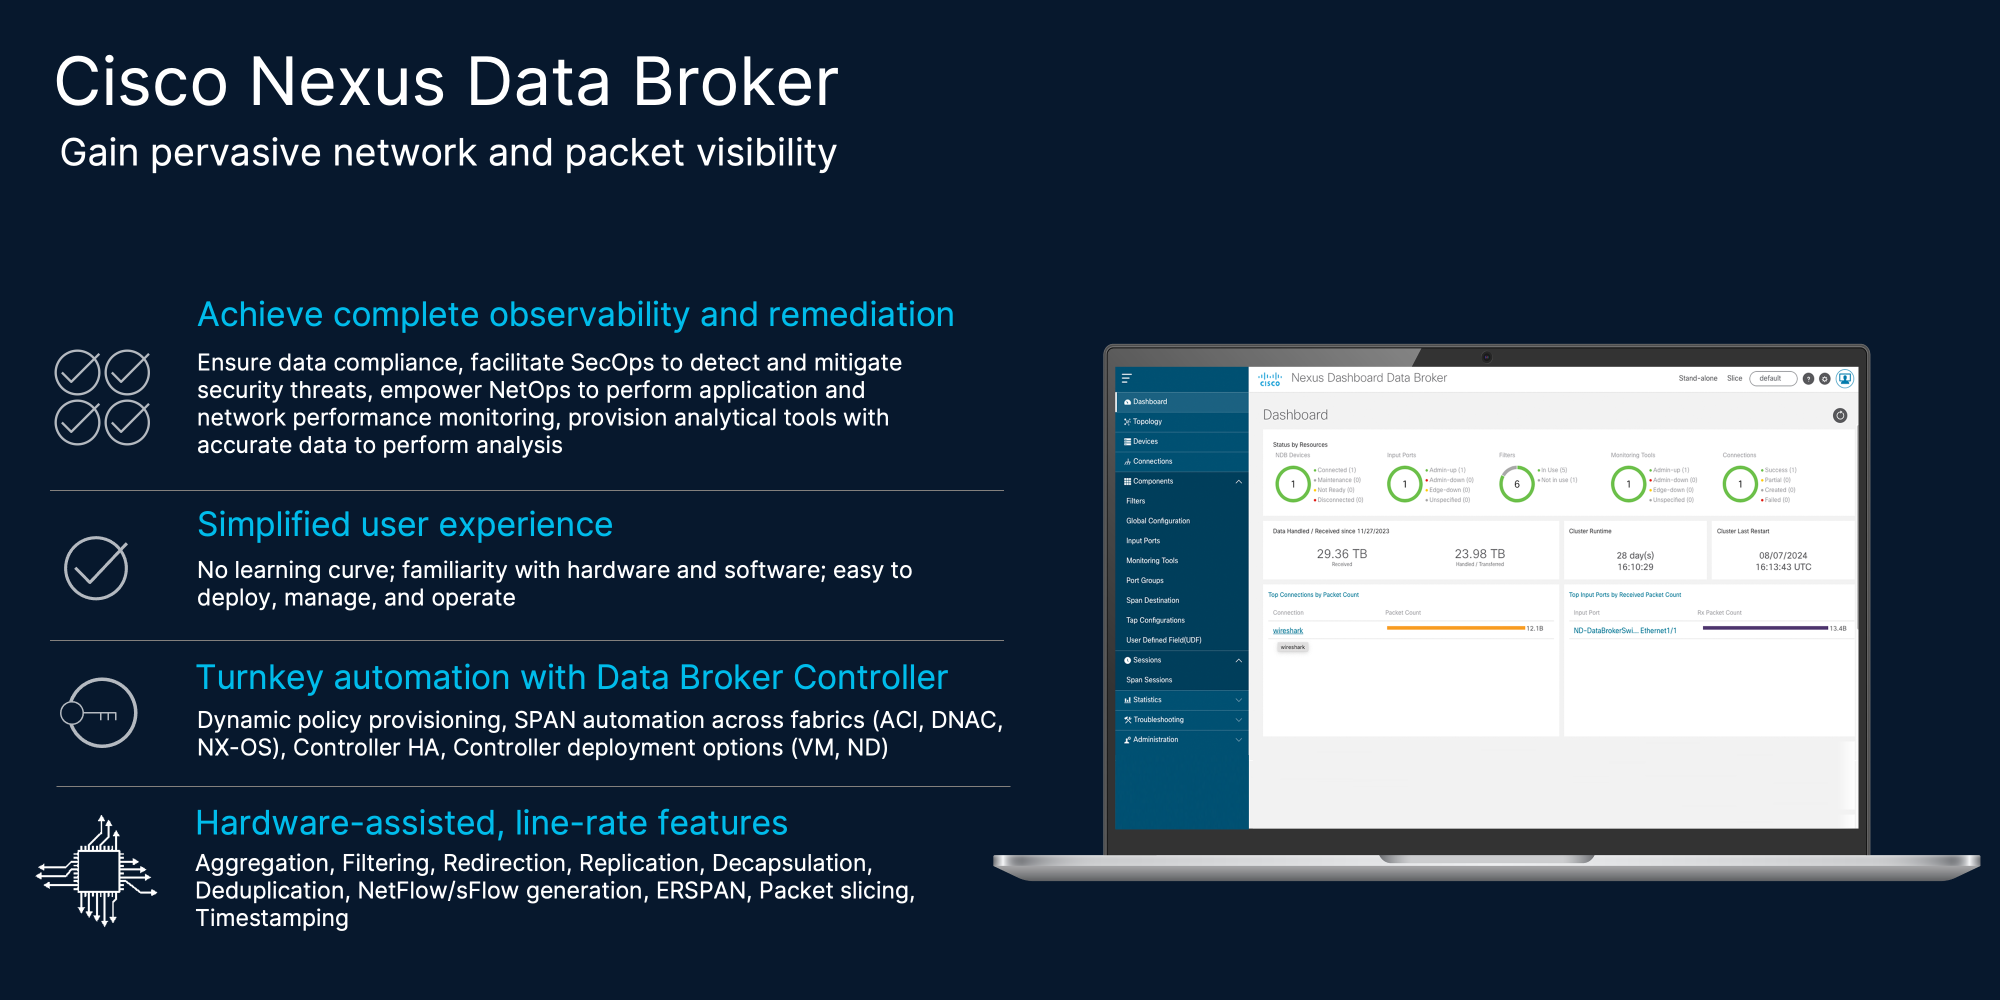
Packet-level visibility is often referred to as the “source of truth” in any networking environment. Visibility is paramount for various teams (SecOps, NetOps, compliance). The challenge in many organizations is that these teams often work in silos. Cisco Nexus Data Broker acts as a bridge by providing a centralized way to capture, aggregate, and redirect traffic to the various tools and services that these teams use, thereby facilitating accurate analysis and actionable outcomes.
Evolving the Cisco Nexus Data Broker architecture
For years, Nexus Data Broker has been a cornerstone for customers requiring scalable network packet broker solutions. Traditionally, Nexus Data Broker has been deployed in a centralized mode, typically running as a standalone application on a dedicated Linux server or a virtual machine.
While this architecture has served as a reliable foundation, it does require manual lifecycle management, independent patching, and separate infrastructure maintenance for the host server. As customers move toward a more integrated, single-dashboard management model, the need for a more cohesive management experience has become indispensable. This drove the requirement to integrate Nexus Data Broker into a unified Cisco Nexus Dashboard, which provided a single source of truth and a single pane of management for comprehensive end-to-end visibility.
Integrating Cisco Nexus Data Broker with unified Cisco Nexus Dashboard
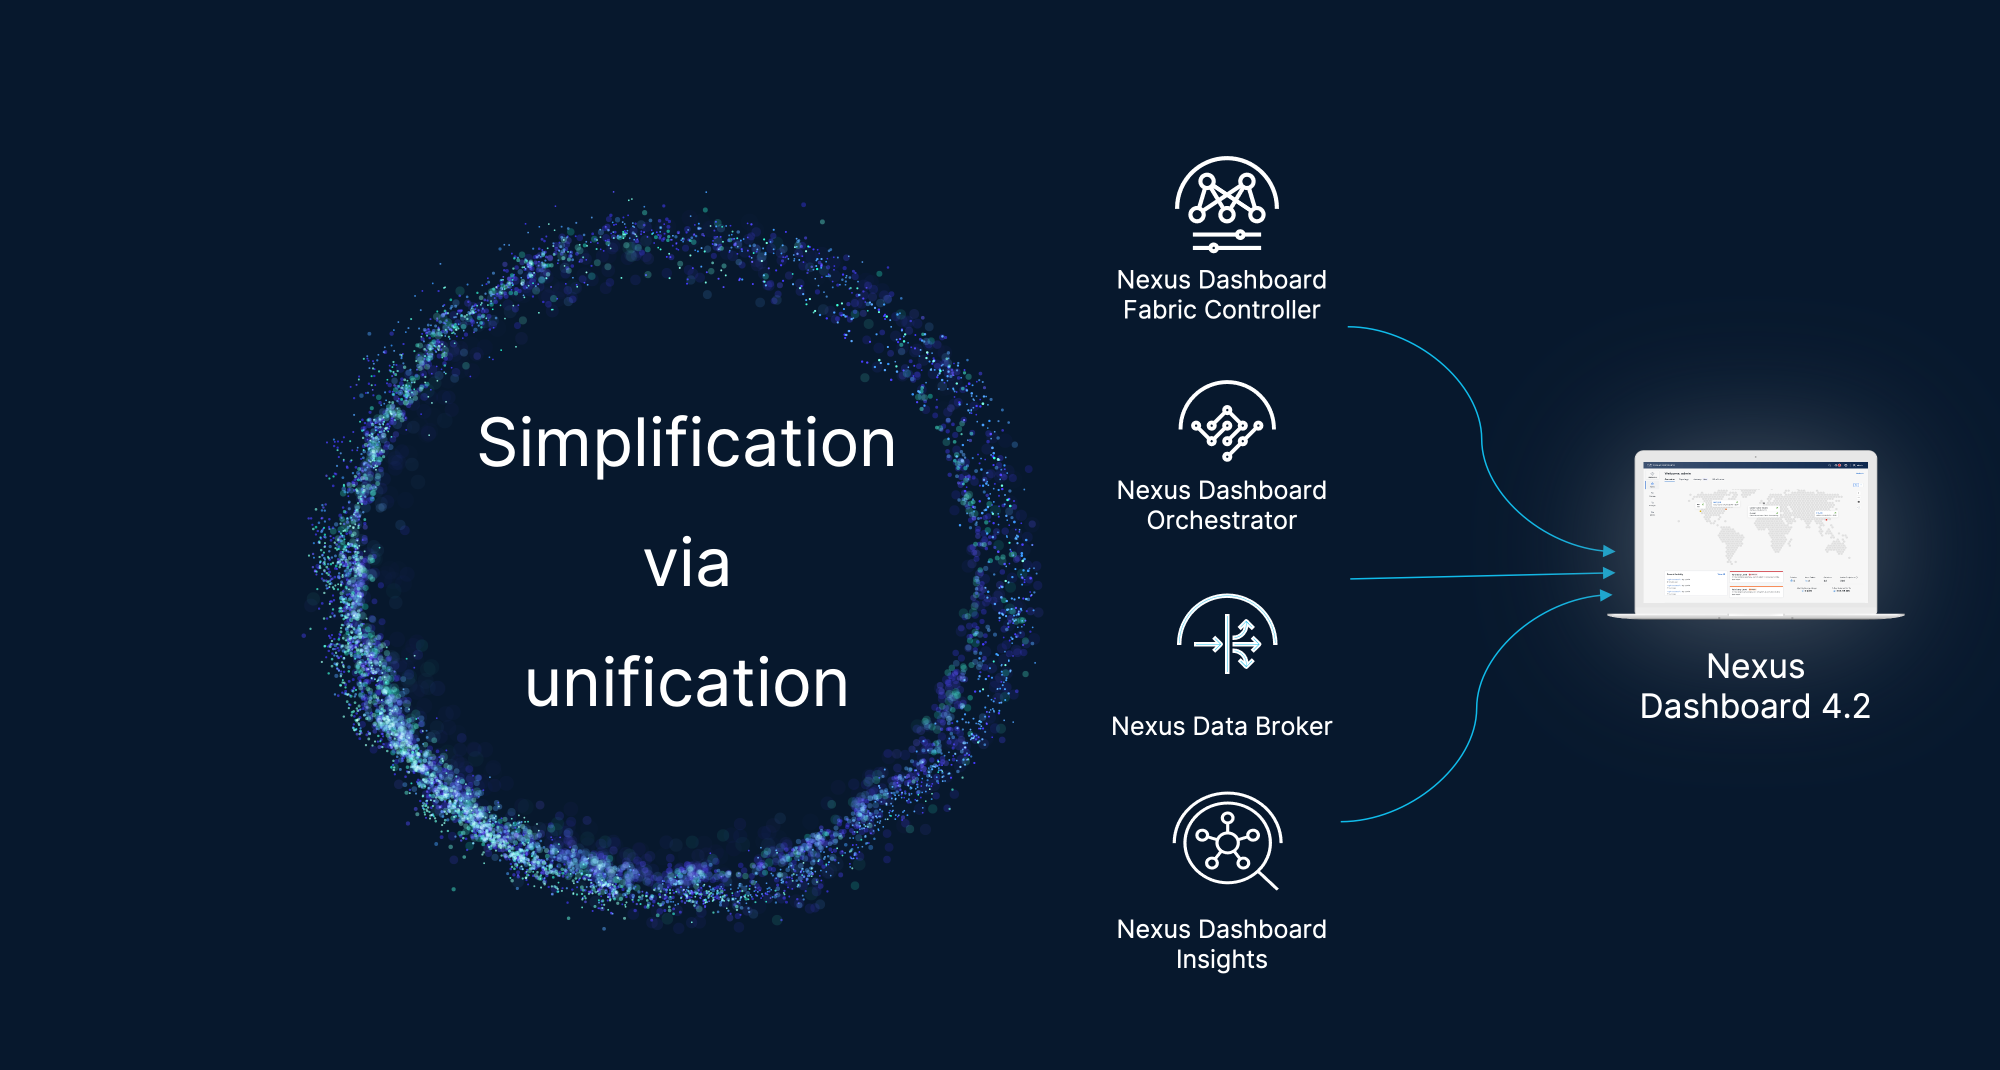
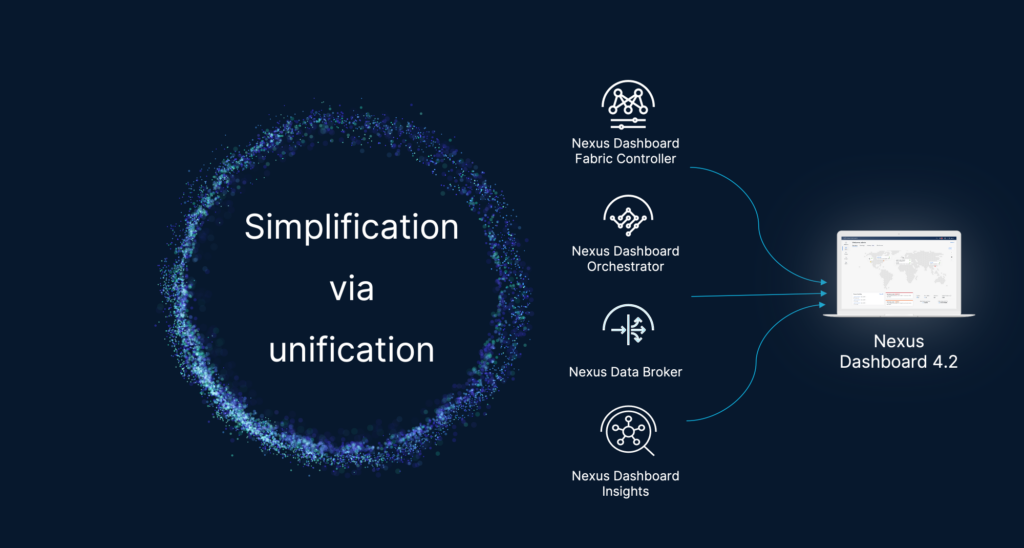
In the evolving landscape of network operations and management, visibility is paramount. Today, we are excited to highlight the integration of Nexus Data Broker into Nexus Dashboard version 4.2. This milestone represents a significant step forward in simplifying how network administrators manage traffic visibility and monitor fabrics.
Leveraging Cisco Nexus Dashboard
Cisco Nexus Dashboard serves as the unified platform for Cisco data center management applications. By hosting applications like Nexus Data Broker directly on Cisco Nexus Dashboard, customers gain several key advantages:
- Unified management: A single view for all your data center operations, reducing the need to switch between disparate tools.
- Operational consistency: A shared UI/UX framework ensures that navigating between Nexus Data Broker and other services (like Nexus Dashboard Insights or Orchestrator) feels intuitive and familiar.
- Shared infrastructure services: Applications running on Cisco Nexus Dashboard benefit from shared platform services, including centralized authentication and Role-Based Access Control (RBAC), common telemetry, and streamlined backup/restore processes.
- Scalability: Leverage the underlying cluster architecture of Nexus Dashboard to ensure high availability and robust performance for your visibility applications.
Why Nexus Data Broker on Cisco Nexus Dashboard 4.2 is a game changer
With the release of Cisco Nexus Dashboard 4.2, the integration of Nexus Data Broker is designed to make life easier for network operations teams. Here is why this transition is a significant upgrade:
- Simplified deployment: Gone are the days of manually provisioning and maintaining a separate Linux host. Nexus Data Broker can now be deployed directly from the Nexus Dashboard App Store, significantly reducing the “time to visibility.”
- Lifecycle management: Updates and upgrades are handled through the Nexus Dashboard, ensuring that your Nexus Data Broker instance remains secure and up to date with minimal administrative overhead.
- Unified security and access: By integrating with the Nexus Dashboard’s identity management, Nexus Data Broker inherits your existing enterprise security policies, ensuring consistent access control across your entire visibility fabric.
- Operational efficiency: By bringing the controller into the Nexus Dashboard ecosystem, administrators can correlate visibility data with other insights provided by the Nexus Dashboard, enabling faster troubleshooting and more informed decision making.
Advancing the future of network visibility
The move to Cisco Nexus Dashboard 4.2 is more than just a platform shift; it is a commitment to simplifying the operational complexity of modern data centers. By centralizing Nexus Data Broker within Cisco Nexus Dashboard, we are empowering our customers to spend less time managing infrastructure and more time gaining the critical insights they need to run their networks effectively.
We invite you to explore the new Nexus Data Broker integration in Cisco Nexus Dashboard 4.2 and experience a more streamlined, unified approach to network visibility.
Get the Cisco Nexus Dashboard data sheet
Additional resources:
Modernize your data center operations with Cisco Nexus Dashboard
Streamlining Network Visibility: Data Broker & Nexus Dashboard 4.2 (03:16)


