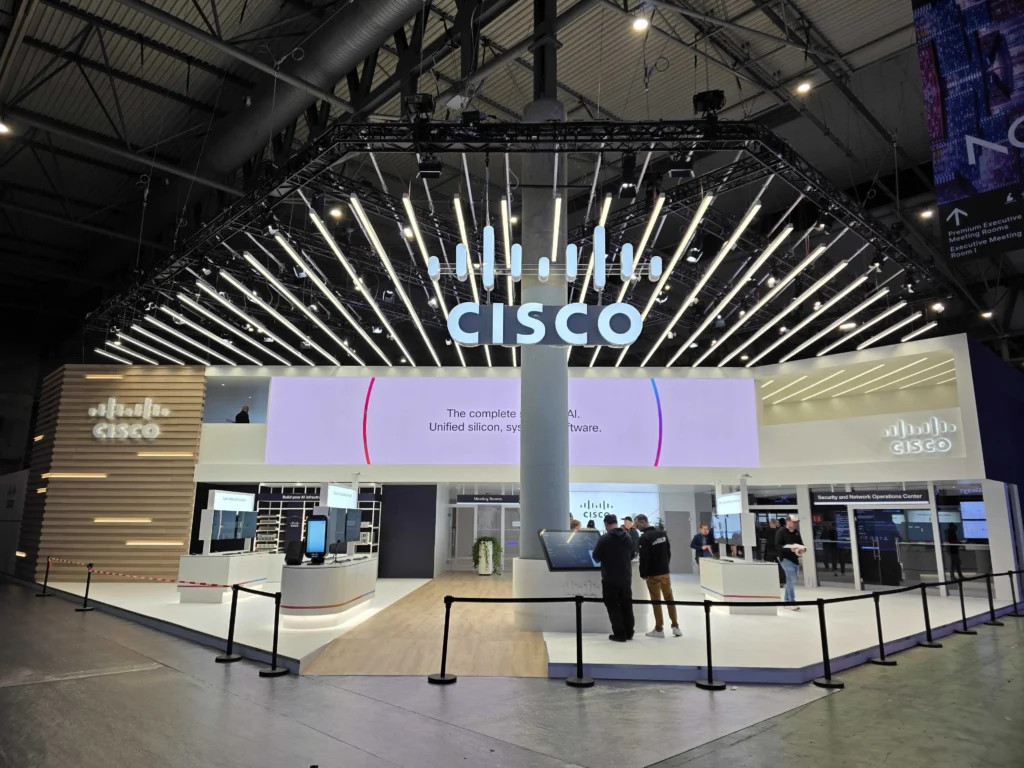
Mobile World Congress (MWC) Barcelona is one of the most demanding environments for network and security operations. With thousands of attendees, unmanaged devices, and applications interacting in real time, operational visibility and threat detection must function flawlessly.
For the 2nd year, the Cisco team leveraged Splunk, in addition to its other security products, to deliver a unified Security Operations Center (SOC) and Network Operations Center (NOC) experience. Together, we used Splunk as the central data platform and integrating telemetry across a broad set of Cisco technologies.
What made this deployment particularly notable was not just the breadth of integrations, but the speed and flexibility with which we operationalized the environment.
The Architecture: A Unified Operations Platform
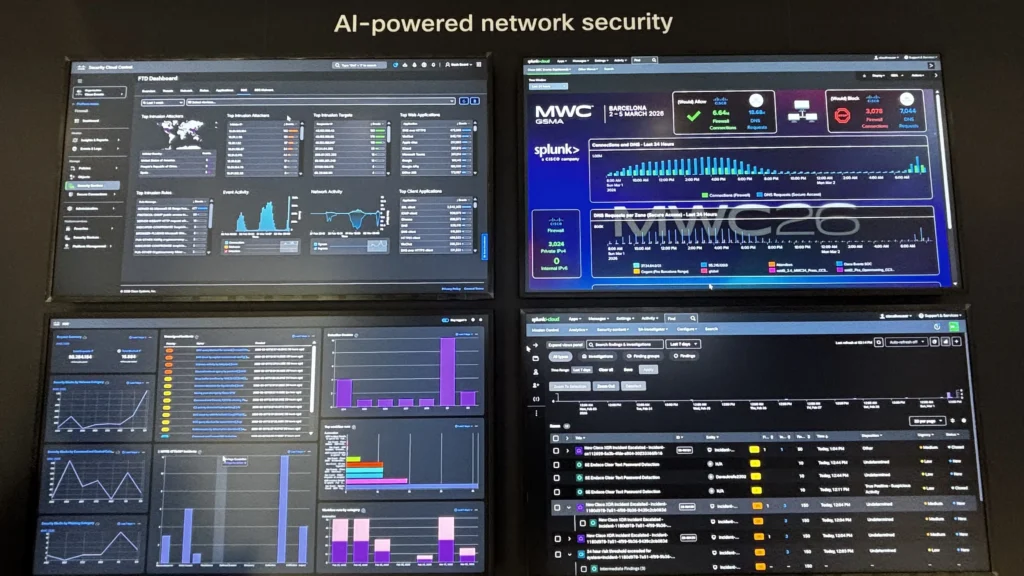
At the core of the deployment was Splunk Cloud, acting as the single pane of glass for both SOC and NOC workflows.
We ingested data from multiple Cisco platforms, including:
- Cisco Secure Access – user and policy telemetry
- Cisco XDR – correlated threat detection and response signals
- Cisco Firewall Threat Defense (FTD) – perimeter and deep packet inspection telemetry, with the new Secure Firewall 6160 for AI-ready data centers
- Cisco Meraki & Catalyst Center – network health, performance, and device insights
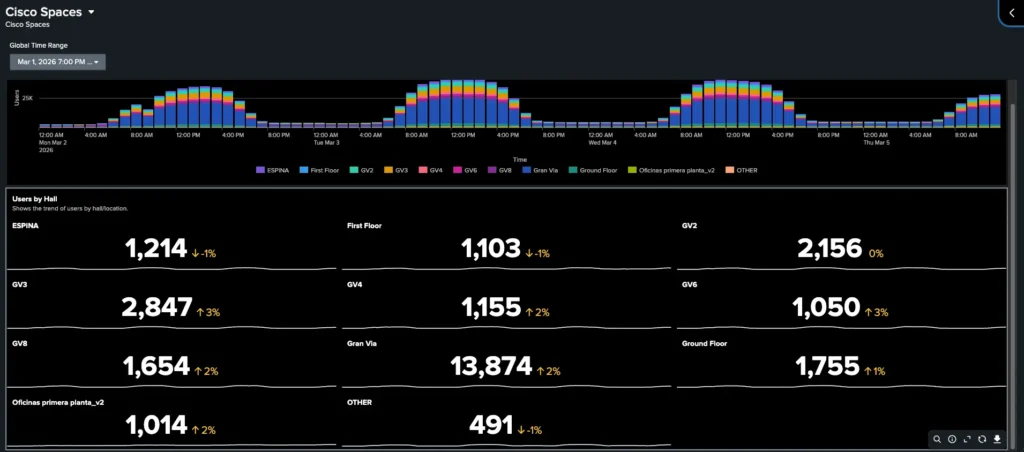
- Cisco Spaces – location analytics and occupancy intelligence
This architecture allowed us to converge traditionally siloed operational domains into a single analytics layer, enabling faster correlation between network events and security incidents.
Building NOC Dashboards in an Afternoon
One of the most impactful outcomes was how quickly we were able to deliver operational visibility following various requests from other teams present at the event.
Using Splunk’s data platform and visualization capabilities, we were able to build a fully functional NOC dashboard in just a few hours. The dashboard provided:
- Real-time network usage and availability
- Client connectivity metrics across wireless and wired environments
- Application usage indicators
Because all telemetry was collected within Splunk, creating meaningful dashboards required minimal transformation work. This highlights a key advantage of using a unified data platform: once ingestion is solved, insights can follow quickly.
Bridging SOC and NOC: From Visibility to Context
Traditionally, SOC and NOC teams operate in parallel, often using separate tools and datasets. At MWC, we intentionally broke down that barrier.
By leveraging Splunk as the common platform:
- NOC events (e.g., latency spikes, usage trends) could be correlated with
- SOC signals (e.g., anomalous traffic patterns, threat detections)
This convergence enabled faster root cause analysis and reduced mean time to resolution (MTTR), particularly in scenarios where performance issues or traffic anomalies had potential security implications.
A First: Deploying the Cisco 6160 Firewall in a Public Event
A standout aspect of this deployment was the use of the Cisco Secure Firewall 6160—marking its first deployment in a public event environment.
Bringing this data into Splunk required a bit of engineering:
Data Pipeline Design
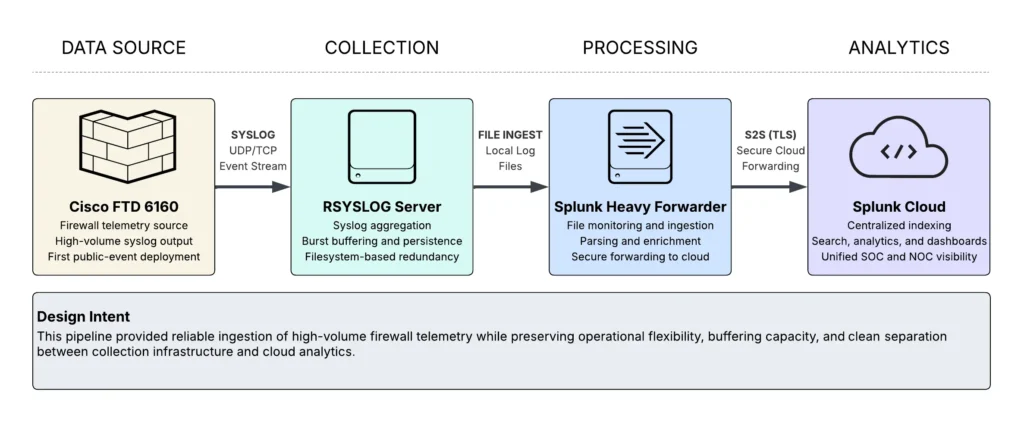
Because of the scale and performance characteristics of the firewall, we implemented a structured ingestion pipeline:
- RSYSLOG Server
- Acted as the initial log aggregator source for the firewall
- Handled high-throughput syslog ingestion from the 6160
- Provided buffering and normalization capabilities
- Saved data on the file system, providing another layer of redundancy
- Splunk Heavy Forwarder (HF)
- Consumed logs from files produced by RSYSLOG
- Applied parsing, filtering, and metadata enrichment
- Forwarded processed data securely to Splunk Cloud using the S2S protocol
- Splunk Cloud
- Centralized indexing and analytics
- Enabled both SOC and NOC use cases
The following diagram illustrates the ingestion pipeline used to reliably transport high-volume firewall telemetry into Splunk Cloud:
Why This Approach Worked
- Scalability & Resiliency: RSYSLOG absorbed burst traffic without dropping events and created a local copy of log files
- Flexibility: The Heavy Forwarder allowed us to control parsing/filtering before ingestion, should we need to
- Cloud Integration: Clean separation between on-prem data collection and cloud analytics
This pipeline ensured reliable ingestion of high-volume firewall telemetry while maintaining performance and data integrity.
Lessons Learned
A few key takeaways from the deployment:
- Unification accelerates operations
Bringing SOC and NOC data into a single platform improves operations and makes new insights possible - Data onboarding is the hardest—and most important—step
Once data is flowing and normalized, building dashboards and detections becomes significantly easier. - Edge engineering still matters in cloud-first architectures
Components like RSYSLOG and Heavy Forwarders remain critical for handling real-world data ingestion challenges. - Speed is achievable with the right abstractions
Building a production-grade NOC dashboard in hours—not days—is realistic when the platform is designed for it.
Check out the lessons learned from the Event SOCs we deploy around the world, with the white paper and latest blogs.
We’d love to hear what you think! Ask a question and stay connected with Cisco Security on social media.
Cisco Security Social Media