Part 3 of the four-part series – Cloud Monitoring for Cisco Catalyst Switches
Welcome back to the third blog in our series about cloud monitoring for Cisco Catalyst 9000 switches.
My last blog was about network visibility through the Meraki dashboard. In this blog, we’re going to take it a step further and talk about how cloud monitoring for your Catalyst switches will help with network troubleshooting.
I worked in customer support back in the day.
Most of our calls went something like this: “Hi, this is Pat, I can’t access my files” or “My internet isn’t working.” Classic, right?
Speaking of classic, here are some typical approaches to troubleshooting Pat’s problem:
- Top-down: Dig through every screen and every management console you’ve got
- Bottom-up: The same as above, but starting with the user
- Divide and conquer: All hands on deck; split out your management consoles and areas of the network
- Follow the path: Where did it come from and where is it going?
- Spot the differences: Take a long time to look through logs to see if you can gather enough information
- Move the problem: Pat called back and said they’re connected—no problem and no longer MY problem! Kick that issue down the road as a future me problem.
Whether you’re feeling nostalgic or breaking into a cold sweat like me, there’s a better way!

How about a more modern approach that includes:
- A unified organization view
- Event logging
- Network health status
- Packet captures
- CLI show commands
Go refill your coffee and take a quick Meraki dashboard troubleshooting journey with me.
Unified Network View
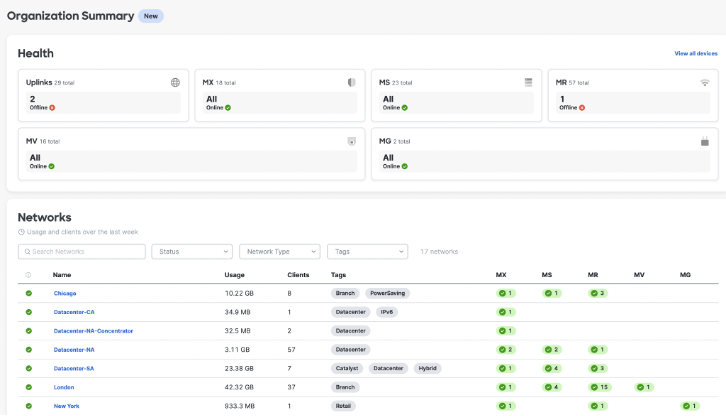
The BEST view in the dashboard is the organizational summary. This is a quick way to see your entire org—not just network—from one screen, looking at the overall health. It’s so easy to see where a problem may be and get to it immediately. Rather than flipping between management interfaces and networks, you can get to the root cause almost immediately, from anywhere in your org.
Event Logging
While we don’t enjoy event storms and getting notifications every second of every day, it’s nice to log in to your dashboard instance and be able to look at events and add notifications if you’d like. I’m a fewer-is-better kind of gal myself.
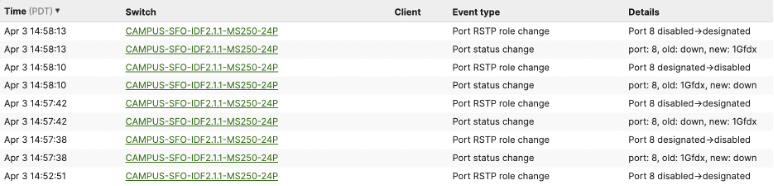
Our event-logging screen makes it easy to navigate and search for events by device or networking hardware. You can even include and ignore event types.
Network Health Status
My favorite page specific to switches is the new overview—one status page to rule them all!

If we want to get to a network-level issue, we can get there from the organizational alerts page or from the network topology. That monitored switch, while it’s not having a serious issue, shows as yellow. Let’s see why it’s unhappy.
As easy as one click, here’s the culprit:

We know VLAN mismatches aren’t a huge deal, but with a single click you can see the issue, and one more click gets you to documentation that shows how to easily fix it. Shameless plug: If this switch were Meraki managed, you’d see a link that asks if you’d like to fix it. Click the link and it’s fixed. Machine learning for the win!
Another of my favorite new dashboard offerings is the Switching Overview page:
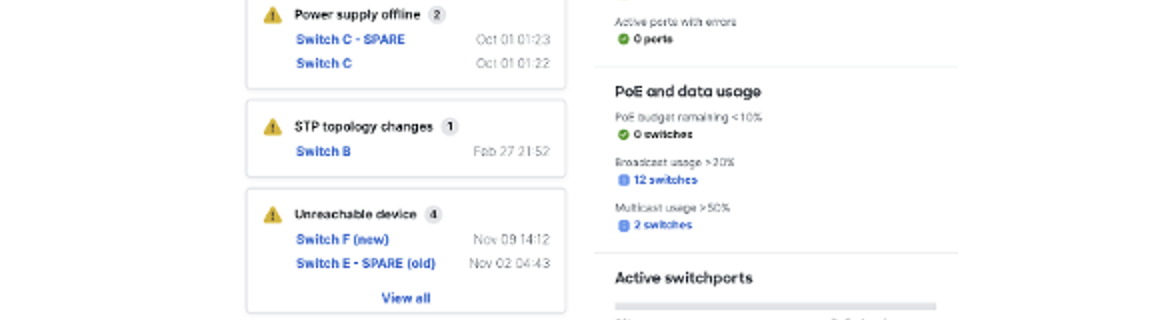
This is still from a network level and shows you the status of all of your switches, alerts, clients on the switches, events, Power over Ethernet (PoE)/data usage, and switch port information.
Packet Capture
It’s almost here—packet capture for your Catalyst switches! I don’t think I need to tell you how packet capture works and helps diagnose network issues, but I can show you a screenshot of how to set it up:
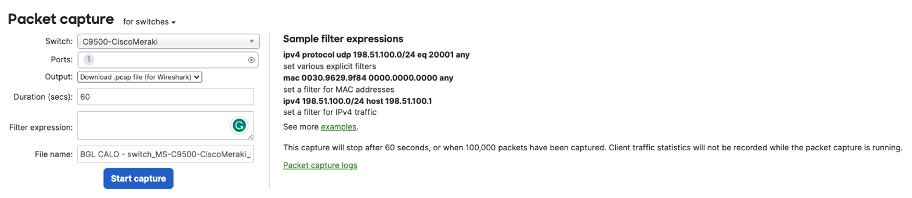
For switches, the following options are available:
- Switch: Select the switch to run the capture on
- Ports: Select the ports to run the capture on
- Output: Select how the capture should be displayed: view output or download .pcap
- Verbosity: Select the level of packet capture
- Ignore: Optionally ignore capturing broadcast/multicast traffic
- Filter expressions: Apply a capture filter
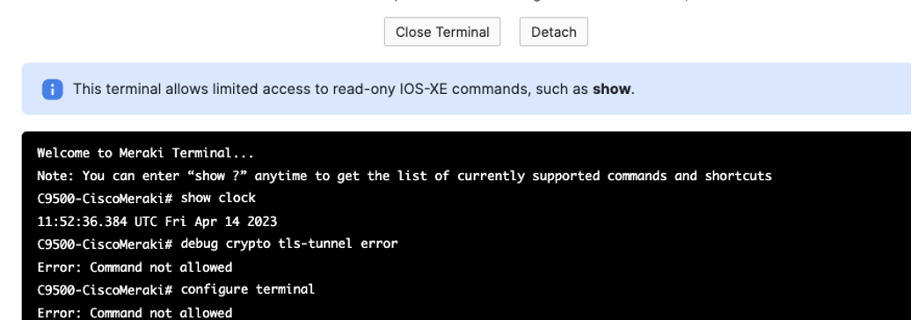
CLI Show Commands
No context switching or management console changing to troubleshoot issues? You’re welcome. Command-line interface (CLI) shows commands via the Meraki dashboard that are a great way to enable remote validation of configuration and troubleshooting, without having to get direct access to the device via Secure Shell Protocol (SSH) or console.
Interest Piqued?
Check out our easy-to-follow onboarding documentation. All of the functionality I’ve mentioned in this post is either already released or coming shortly, so onboard your switches soon to take advantage of all this troubleshooting goodness.
If you’re a Cisco Prime customer who is moving away from Prime but not quite ready for full cloud management, this is a great way to get your feet wet with an introduction to cloud operations through your Cisco DNA licenses associated with your Catalyst switches.