In light of the recent announcement of MSE Release 7.4 and Advanced Location Analytics Availability, we thought it would be timely to pick up where we left off on our MSE blogs series. In the first two, my colleague Anshul Tyagi covered how the MSE optimizes the CleanAir experience and discussed other MSE enhancements. Now that we have expanded the MSE to cover advanced location analytics, let’s use this blog to dive deeper into how to monetize your Wi-Fi infrastructure using our new functionality.
So you have a Cisco Wi-Fi network: what can you do to get more insight into the people using it? Do you know which part of your venue is more crowded? Ever wondered where people spend the most of the time in your venue? Where have people been before they arrived at your venue?
Whether it is in retail, leisure, travel or manufacturing, anytime there are people interacting with a Wi-Fi environment, there is also potential to improve the user experience–that is, if you can first visualize that interaction.
With the acquisition of ThinkSmart technologies, a leading data analytics company proficient in location data mining, Cisco opens up a new customer base – that of customer oriented marketing. Cisco ThinkSmart Location Analytics solution leverages your existing WLAN infrastructure and can help you gain insight on customer behavior, giving you an opportunity for better sales and operations.
How does the Cisco+ThinkSmart Analytics work?
Cisco’s Mobility Services Engine (MSE) computes real time location of Wi-Fi devices using triangulation through receiving the RSSI from WLAN controllers. ThinkSmart’s Analytics engine has been integrated within the MSE, resulting in what is now the integrated Cisco Analytics solution. The MSE can now aggregate location data and prepares it for different kinds of behavioral analysis, such as dwell time, device counts, alternative flows, typical paths, average trip times, etc. This analysis helps venue operators understand their customers’ behavior, which can help them enhance the customers’ experience. It also helps venue owners to develop strategies for better sales, positioning of better signage, and evaluation of campaigns, right up to identifying situations of potential visitor safety. For example, in case of a retail store, if a vendor notices that there is one point in the store that everyone stops, they will optimize product placement in that area.
Crowding and dwell time
In the retail market, the longer a customer dwells in a store, the more likely he or she will make a purchase. Similarly, in the case of airports, the amount of waiting time at certain points, such as security checkpoints, could indicate the need for more staff, especially if Service Level Agreements are to be satisfied. Analytics solution also allows you to define custom zones and provide a graphical view of the number of people and average wait time in that specific zone. Analytics data not only shows visibility of how many customers are visiting your store/venue, but also provides information on how many are passing by, where they came from and where they are going to. This allows a retailer to try engaging with those potential customers increase sales.

Figure 1 Showing the dwell time and distribution of Wi-Fi users in a retail mall
Path analysis
It is important to understand where and when the users flow occurs around a building, so you could make some sales decisions to better utilize the heavy traffic areas. For example, in case of an airport, if you know that more people are going from security check towards terminal 1 rather than to terminal 2 or 3, you could charge more to the stores located towards terminal 1. You could also see the most typical paths taken by the users at different times of day.
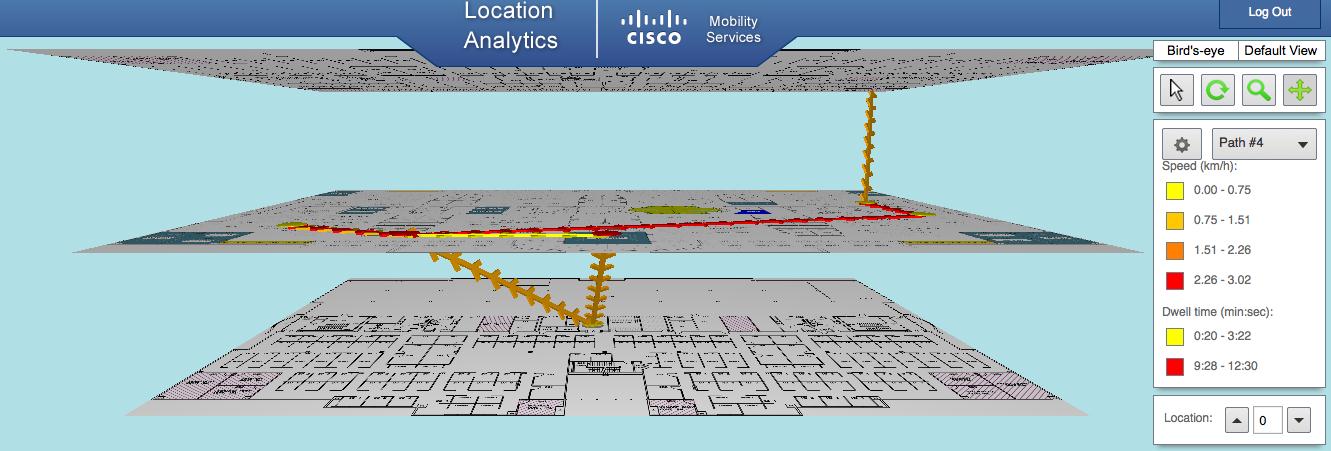
Figure 2 Showing a common path and breakout in an airport
Other Information about customers
Wouldn’t you be interested in knowing the customers who are visiting again and again? Perhaps a loyalty program could be developed for that target audience, if there were patterns of arrival times and destinations? MSE ThinkSmart analytics solution gives you this opportunity to help improve customer experience by providing different kinds of reports including historical trend reports, which would help understand the business trends and measure the effectiveness of campaigns.

Figure 3 Reporting in Location Analytics
Understanding the customer behavior is an area of growing interest to retail, airports, hotels, conference centers who have installed Wi-Fi to provide better communication with their users and wish to now understand how their users are interacting with their building or environment. With this acquisition, MSE ThinkSmart Analytics Solution can provide detailed analysis of businesses, on the back of Cisco WLAN equipment.
For more information on MSE, check out our product page and stay tuned for the next MSE blog.
Questions? Ask us on our community–we’ll have a member of the engineering team get back to you.