
Cisco’s Connected Mobile Experience (CMX) solution employs data from the Wi-Fi network to generate information about devices visiting a venue, which in turn can be used by businesses to gain greater insight into the behavior of their customers and improve customer experience. At the center of the CMX product is the Mobility Service Engine (MSE), version 10 of which was announced at Cisco Live! Milan.
Mobile World Congress 2015 was another great opportunity to demonstrate the scale at which MSE 10 can now operate. The MSE 10 installation for MWC 2015 was entirely cloud-based and the week’s visitor data was captured using only a single box setup.
In the this blog, we’ll show how MSE 10 was used to generate custom reports during the event to give some interesting insights into how the conference unfolded.
Registration area
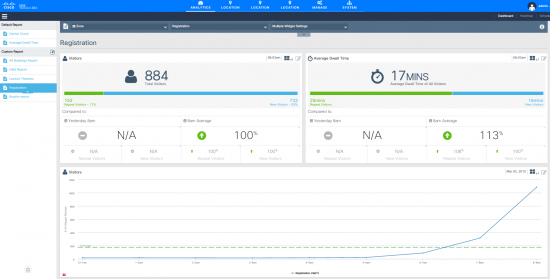
Day 1 of MWC begins at 9:00am, when the main doors open for the first time. People begin arriving well before then and waited patiently to be allowed into the halls. We were able to witness this using a custom report focused on the registration area showing a graph of the number of visitors increasing as opening time approached (Figure 1)
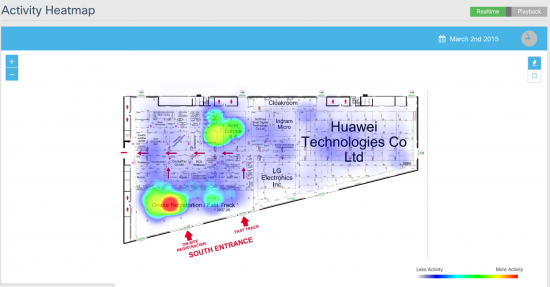
This was also reflected in the heat map report, where a bright red spot can be observed representing the increasing number of visitors waiting to gain entrance (Figure 2)
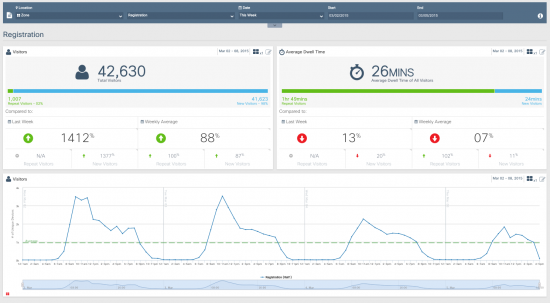
Finally, by looking at data for the entire week, we can clearly see that days 1 and 2 were the busiest for the registration area (Figure 3).
Visitor numbers
MSE 10.0 allows us to filter visitors based on their dwell time. This means that we were able to distinguish between conference visitors and conference/exhibitor staff based on how long they spent at the venue.
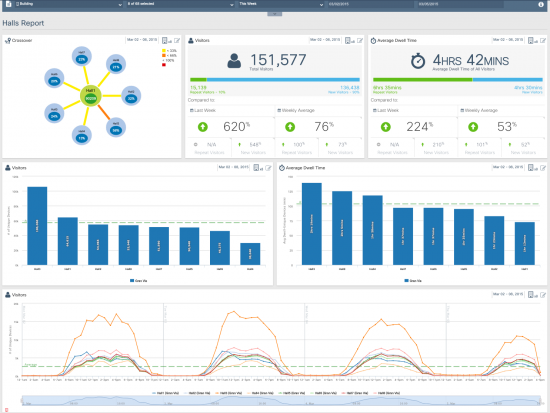
We chose a threshold of 8 hours to separate the two categories, so that devices seen for more than 8 hours were filtered out as belonging to exhibitors or staff, allowing us to focus on event visitor numbers.
Figure 4 shows a report for the 8 main halls of the conference venue over the week. In all, 151,577 visitors were detected at MWC during the week and these can be clearly seen arriving and leaving the venue each day in the bottom line graph.
Keynotes
A number of keynote speeches were delivered throughout Mobile World Congress 2015, and we generated some custom reports to measure the relative popularity of each keynote delivered.
Figure 5 shows a custom report focused on the lecture theatres for the first 2 days of the conference. Lecture hall 1 was the main lecture hall where the big keynotes were given and we can see that the first 2 keynotes pulled in similar number of visitors on day one (see the orange graph in Figure 4) and these were more popular than the keynote given the next day.
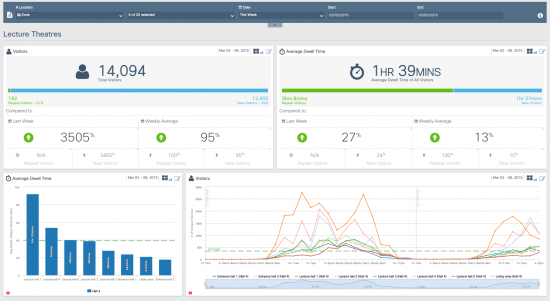
Another nice feature of MSE 10 is the heat map playback feature which allows you to view heat map data for a floor played as an animation. Figure 6 shows the animated heat map for the lecture hall floor on day 1 of the conference. Visitors can be seen arriving and gathering in lecture hall 1 for the two keynotes that day.
Popular restaurants
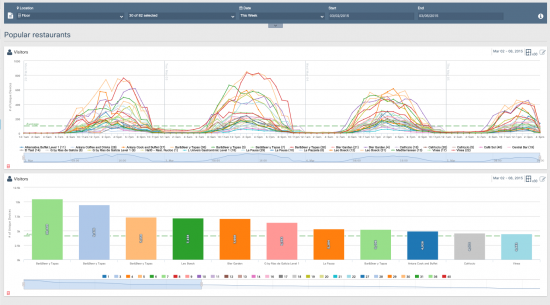
One burning question once the conference kicked off and the venue began to get busy was: where do we go for lunch? We created a custom report showing the popularity of each restaurant and café at the venue to help determine which places were busiest. Figure 7 shows the report for the week of the conference.
System performance
MSE 10 provides a wealth of metrics that are used to determine how well the system is dealing with traffic levels. These were used extensively during the week of MWC to monitor the system.
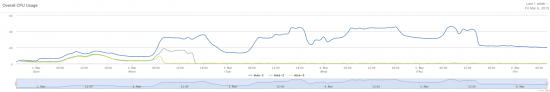
The installation performed extremely well. CPU usage (Figure 8) never went above 45% for the entire show, meaning that we could have run the system on half the number of CPUs we employed.
Summary
In conclusion, MWC 2015 was a resounding success for MSE 10. The system was comfortably able to cope with the large number of visitors and was stable throughout the event. I feel enthusiastic about championing this product and proud to have been part of its development.
Please feel free to comment, share and connect with us on Facebook, Google+ and @Cisco_Mobility!


nice