
Cisco is a longtime partner of the Black Hat NOC and 2023 was our seventh year supporting Black Hat Europe. Cisco is the Official Mobile Device Management, Malware Analysis and DNS (Domain Name Service) Provider.
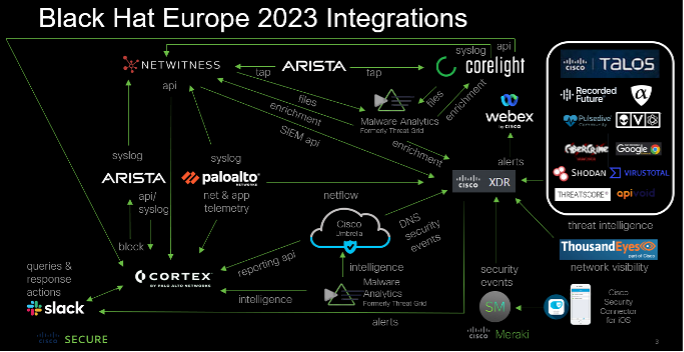
We work with the other official providers to bring the hardware, software and engineers to build and secure the network, for our joint customer: Black Hat.
- Arista: Wired and Wireless Network Equipment
- Corelight: Network Analytics and Detection
- NetWitness: Threat Detection & Response, Identity
- Palo Alto Networks: Network Security Platform
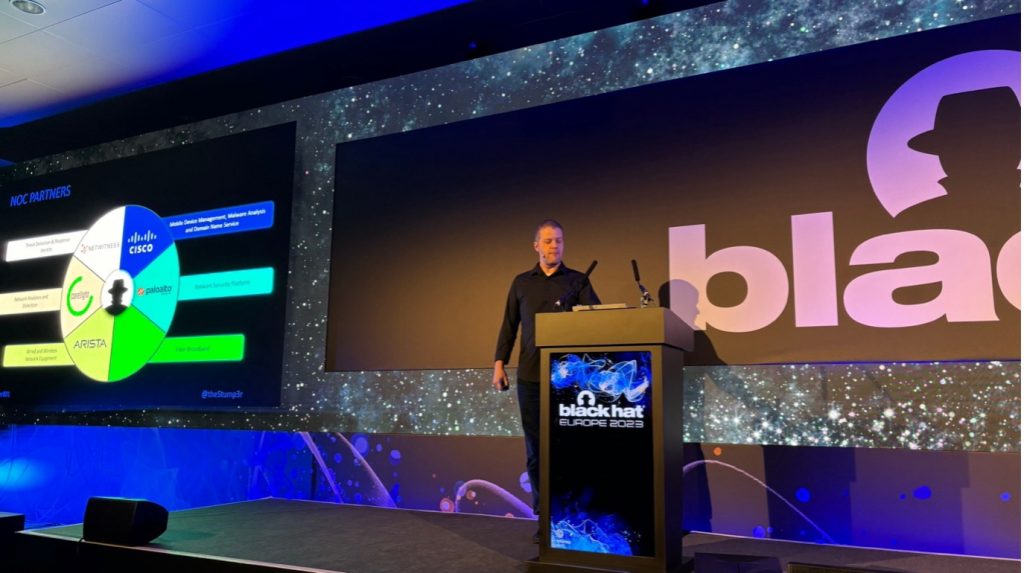
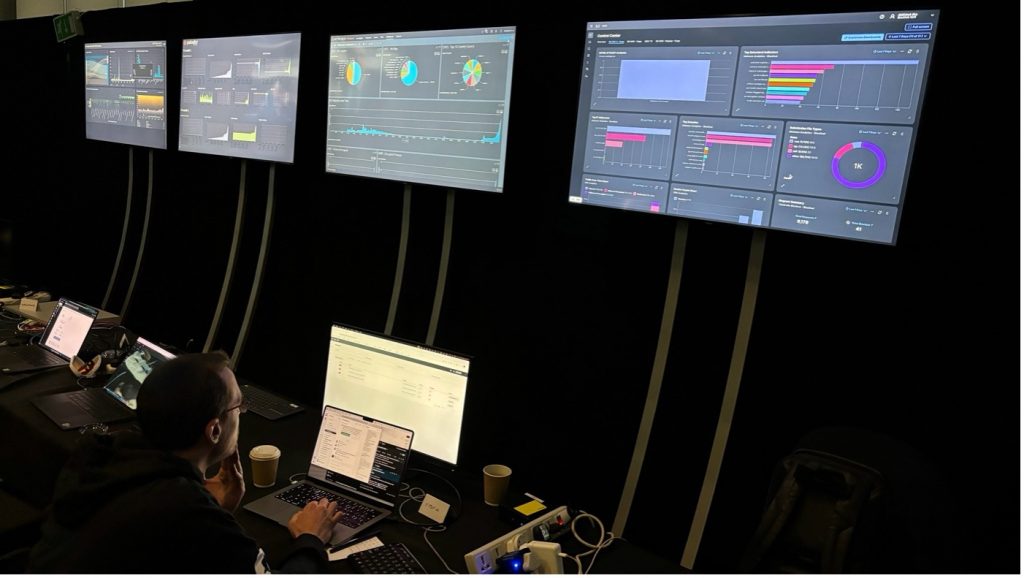
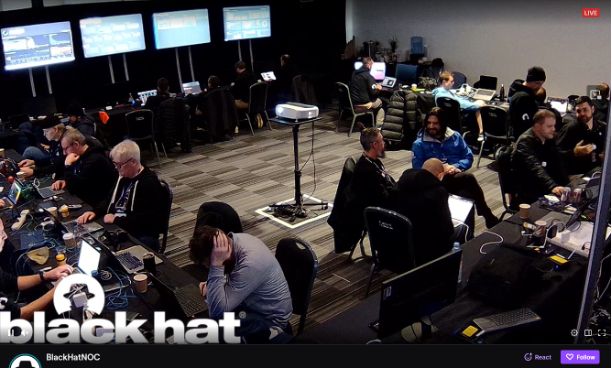
The primary mission in the NOC is network resilience. The partners also provide integrated security, visibility and automation, a SOC inside the NOC.
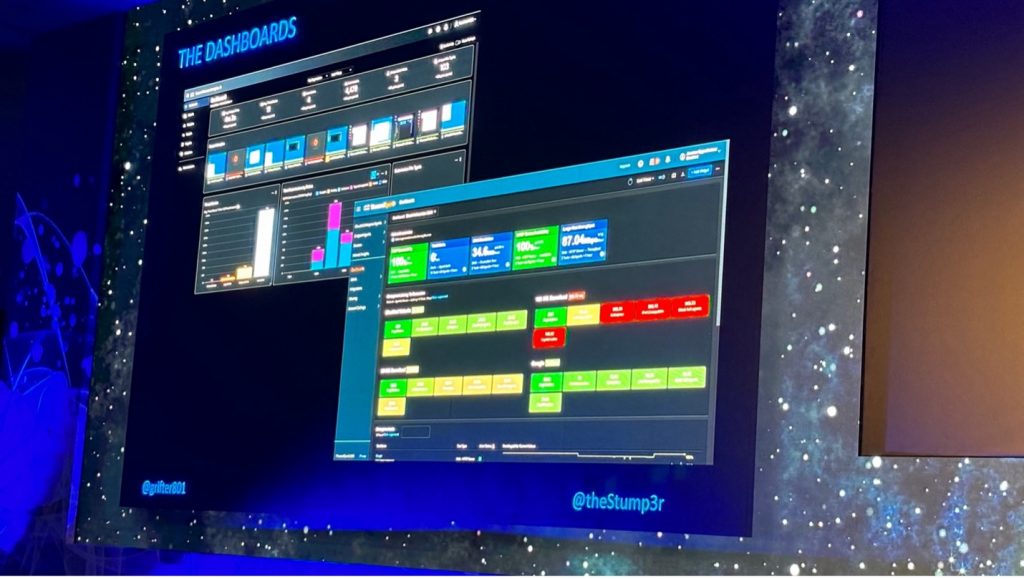
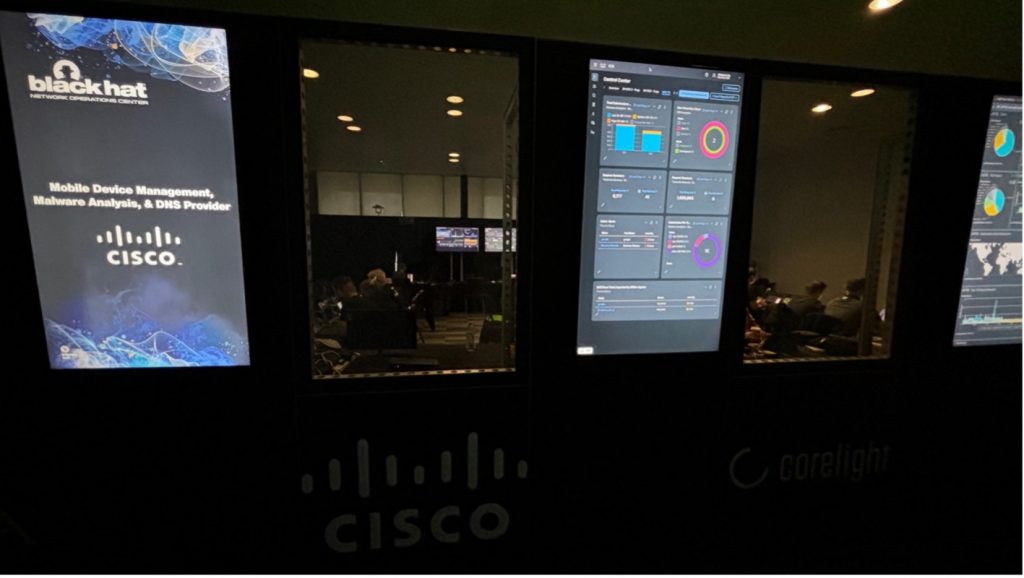
Outside the NOC were partner dashboards for the attendees to view the volume and security of the network traffic.
From Malware to Network Visibility
Cisco was first asked to provide automated malware analysis, back in 2016. Our contributions to the network and security operations evolved, with the needs of the customer.
- Cisco Secure Malware Analytics (Formerly Threat Grid): sandboxing and integrated threat intelligence
- Cisco Umbrella: DNS visibility for the conference network and protection for iOS devices
- Cisco Security Connector: iOS device security and visibility, managed with Meraki Systems Manager
- ThousandEyes: Network visibility
The NOC leaders allowed Cisco (and the other NOC partners) to bring in additional software to make our internal work more efficient and have greater visibility; however, Cisco is not the official provider for Extended Detection and Response, Network Detection and Response or collaboration.
- Cisco XDR: Threat Hunting / Threat Intelligence Enrichment / Executive dashboards / Automation with Webex
- Cisco XDR Analytics (Formerly Secure Cloud Analytics / Stealthwatch Cloud): network traffic visibility and threat detection
- Cisco Webex: Incident notification and team collaboration
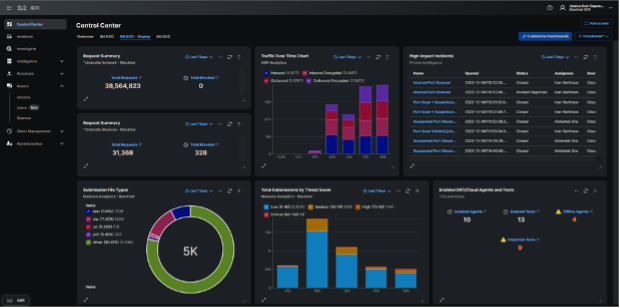
The Cisco XDR Command Center dashboard tiles made it easy to see the status of each of the connected Cisco Secure technologies, and the status of ThousandEyes agents.
When the partners deploy to each conference, we set up a world class network and security operations center in a few days. Our goal remains network up time and creating better integrated visibility and automation. Black Hat has the pick of the security industry tools and no company can sponsor/buy their way into the NOC. It is invitation only, with the intention of diversity in partners, and an expectation of full collaboration. As a NOC team comprised of many technologies and companies, we are continuously innovating and integrating, to provide an overall SOC cybersecurity architecture solution.
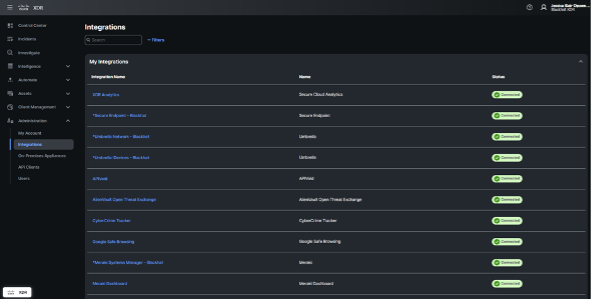
Below are the Cisco XDR integrations for Black Hat Europe, empowering analysts to investigate Indicators of Compromise (IOC) very quickly, with one search.
We appreciate alphaMountain.ai, Pulsedive and Recorded Future donating full licenses to Cisco, for use in the Black Hat Europe 2023 NOC.
| Cisco Networking and Security | Third Party | |
| 1 | Meraki System Manager | alphaMountain.ai |
| 2 | Secure Endpoint for iOS | APIVoid |
| 3 | Secure Malware Analytics | AlienVault OTX |
| 4 | ThousandEyes | CyberCrime Tracker |
| 5 | Umbrella DNS | Google Safe Browsing |
| 6 | Webex | NetWitness / Custom relay |
| 7 | XDR Analytics | Pulsedive |
| 8 | Cisco Telemetry Broker | Recorded Future |
| 9 | Shodan | |
| 10 | Threatscore | Cyberprotect | |
| 11 | VirusTotal | |
| 12 | Slack | |
| 13 | urlscan |
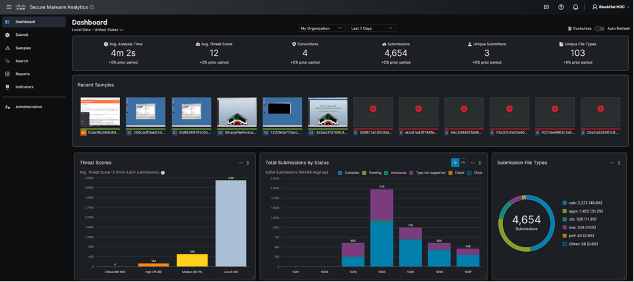
A core integrated technology in the Black Hat NOC for Cisco is NetWitness sending suspicious files to Threat Grid (now Secure Malware Analytics). We expanded this in Black Hat Asia 2023 with Corelight also submitting samples. Over 4,600 samples were submitted.
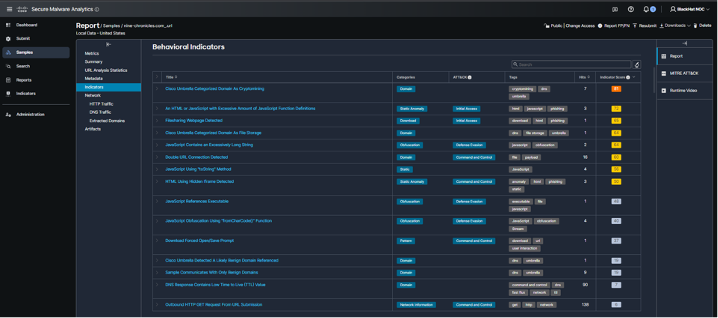
The NOC analysts also used Malware Analytics to investigate suspicious domains, without the risk of infection. An example was an alert for cryptomining on the network by Umbrella, accessed by a student in a Black Hat training course.
Rather than going to the website on a corporate or Black Hat assets, we were able to interact with the website in the glovebox, including downloading and installing the website payload.
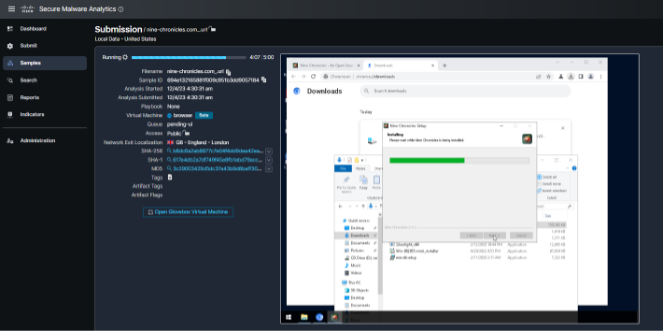
We allowed the payload to make the changes on the virtual machine, as the user experienced.
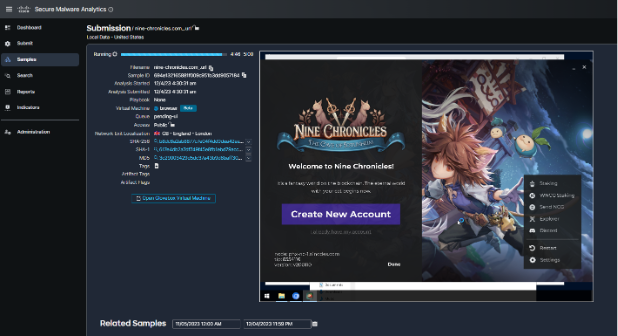
For cryptomining, we allow the activity to occur, but alert the user that their device is being used for that purpose.
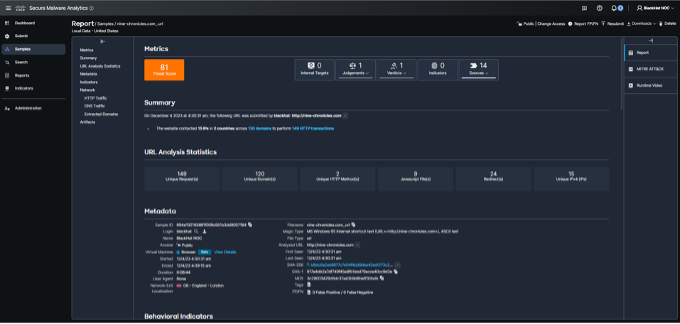
As the payload was not malicious, we did not notify the user of an infection.
XDR Analytics, by Abhishek Sha
XDR Analytics (formerly Secure Cloud Analytics, or Stealthwatch Cloud) allows you to gain the visibility and continuous threat detection needed to secure your public cloud, private network and hybrid environment. XDR Analytics can detect early indicators of compromise in the cloud or on-premises, including insider threat activity and malware, policy violations, misconfigured cloud assets, and user misuse. These NDR (Network Detection and Response) capabilities are native functionality within Cisco XDR. Cisco XDR was available starting July 31st 2023, so we had some experience under our belt for employing its capabilities.
XDR Analytics equipped us with the capability to identify a range of alerts, significantly enhancing our cybersecurity measures at Black Hat.
Deciphering Cyber Threats: A Black Hat Case Study in XDR Analytics
While scanning internet hosts is a common practice in cybersecurity, it’s important to note that the context and target of these scans can significantly impact the seriousness of the situation. If these scans were to shift focus towards other conference participants or, more critically, towards the network infrastructure itself, it would prompt a more serious response.
This scenario underscores the need for continuous vigilance and a proactive approach in monitoring and responding to potential cyber threats. This is the essence of effective cybersecurity management – a process that is constantly tested, improved, and fortified in the face of potential threats.
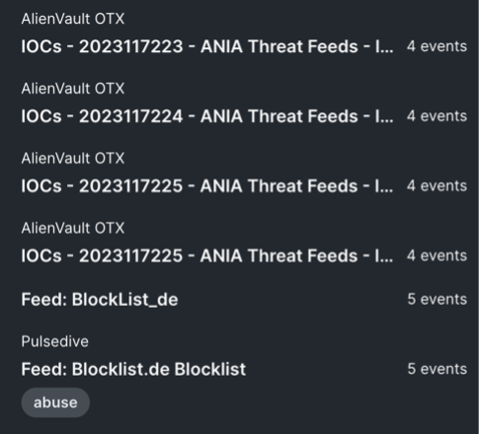
During our network vigilance at Black Hat, Ivan and I encountered a scenario that clearly highlighted the crucial role of XDR Analytics. XDR Analytics raised an alert when it detected that several internal IP addresses were communicating with certain external IP addresses. Intriguingly, these external IP addresses were on our blocklist for production security environments.
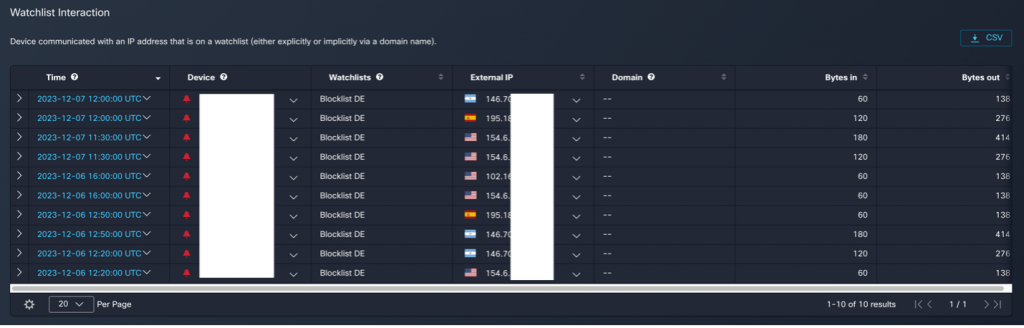
Leveraging the netflow telemetry we were receiving, we employed the Event Viewer feature on XDR Analytics to discern the type of traffic being transmitted to those addresses. On all observed logs, the only protocol was ICMP.
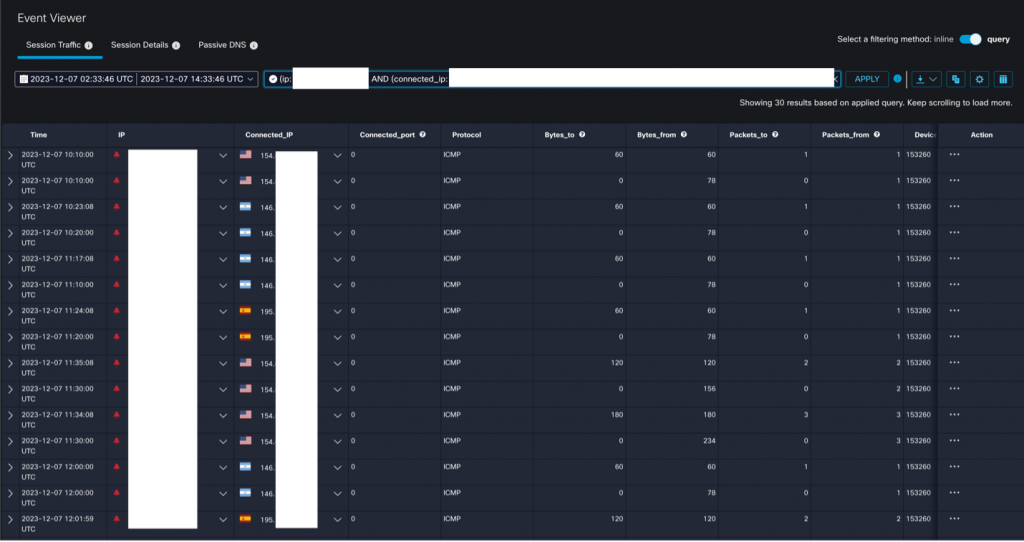
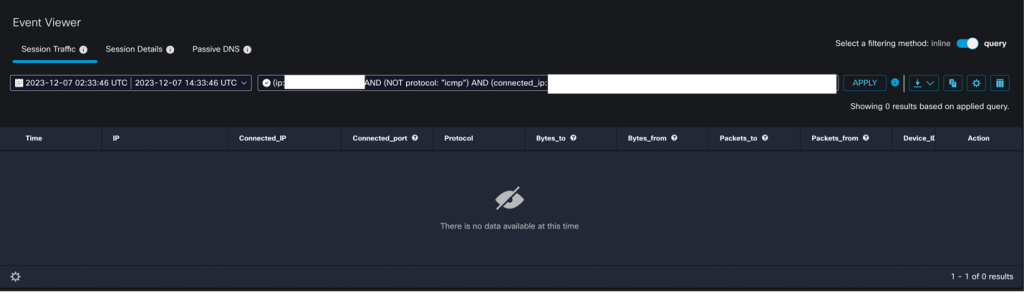
A full search confirmed that no traffic aside from ICMP connected to the external IPs.
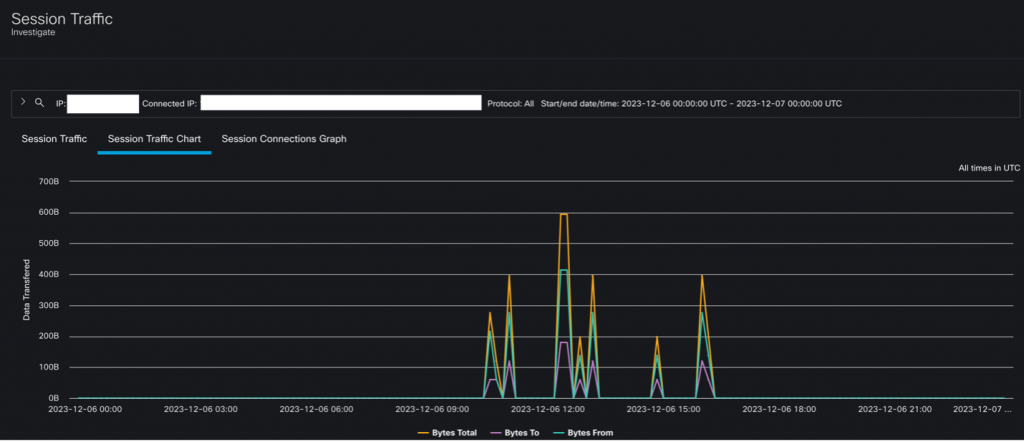
By utilizing graphs in XDR Analytics, we gained insights into the volume of traffic sent to the external IP addresses. This proved instrumental in determining whether any potential ICMP tunneling was taking place, based on the size of the overall traffic.
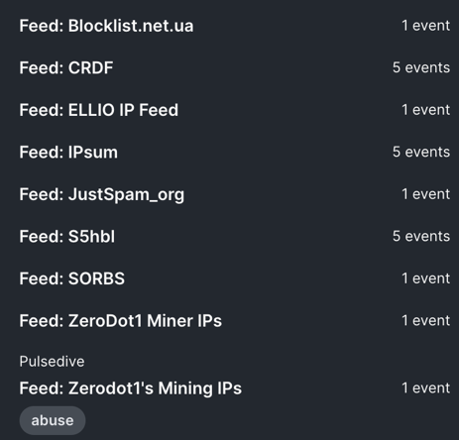
We then focused our investigative efforts on these suspicious external IP addresses using Cisco XDR. The examination revealed that this IP was flagged on other blocklists as well.
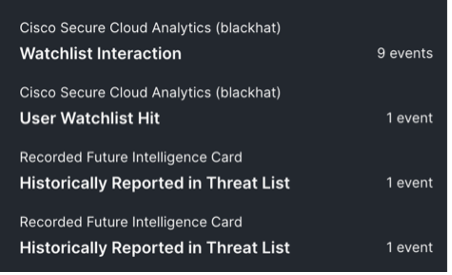
Further analysis on the Cisco XDR graph disclosed a network of other endpoints that had also been interacting with these dubious IP addresses. This revelation exposed the far-reaching influence of these IPs and enabled us to visualize the various interconnected activities.
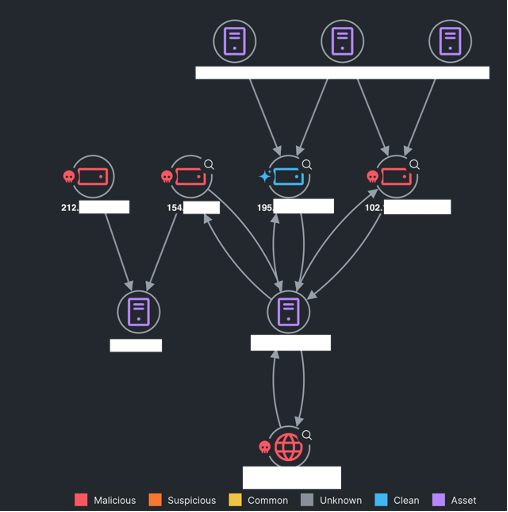
Lastly, we resolved the IP addresses on Umbrella and deduced that these IP addresses were associated with a “Private Internet Access VPN”. It appeared that the endpoint was testing the reachability of all these relays hosted in different locations.
Despite this traffic being innocuous, we capitalized on XDR and XDR Analytics to gain a better understanding and context of this incident. This experience underscores the efficacy of these tools in enhancing cybersecurity defenses.
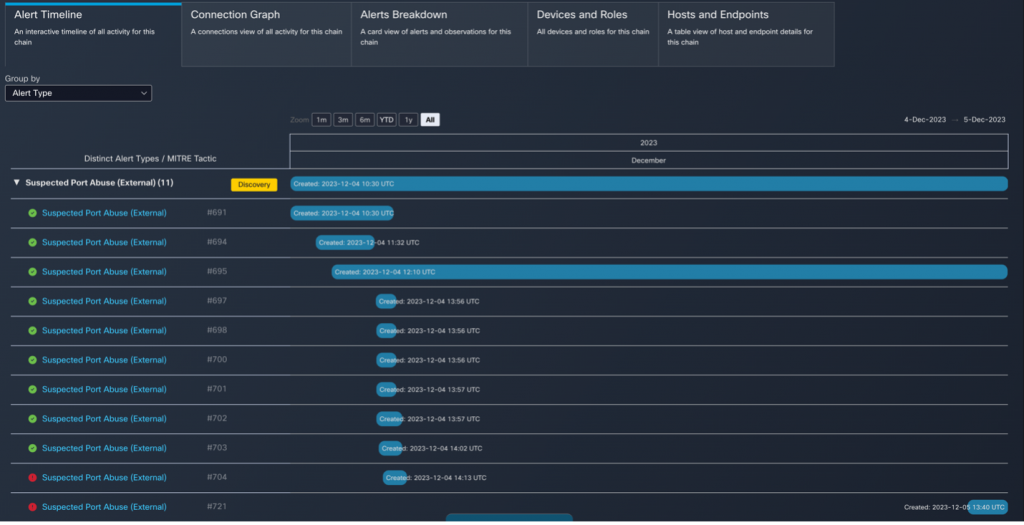
Mastering Threat Detection with Attack Chains
XDR Attack Chain is a feature that allows us to correlate multiple alerts into a larger investigation. We use extracted alert meta data to determine what the alerts have in common, which we refer to as common indicators. Common indicators include devices, IP addresses, host names, and usernames. We then follow the MITRE ATT&CK® framework to further identify the tactics, techniques, and procedures (TTPs) to model the sequencing of actions and threat behaviors which could be early indications of an attack.
In this instance, we’re observing an attack chain comprising several “Suspected Port Abuse (External)” events. Typically, without an attack chain, each of these events would need to be investigated individually, a process that could be time-consuming and potentially less effective.
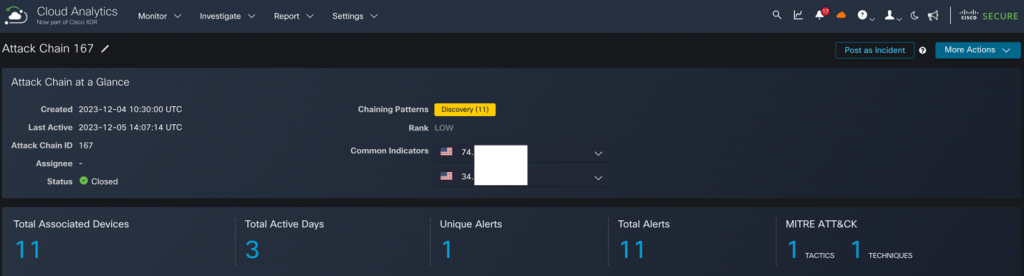
However, the beauty of an attack chain lies in its ability to consolidate multiple alerts into a singular, interconnected event. This method provides a holistic overview of the various alerts, the devices involved, and their respective roles, all within the framework of a single combined event.
The power of this approach is that it eliminates the need for an exhaustive investigation of each separate alert. Instead, it presents a comprehensive, contextualized view of the situation, enabling a more efficient and effective response to potential threats.
With this information, we were able to work with the threat hunters of NetWitness, Palo Alto Networks and Corelight, to determine the risk to the network and attendees. Activities involving malware what would be blocked on a corporate network must be allowed, within the confines of Black Hat Code of Conduct.
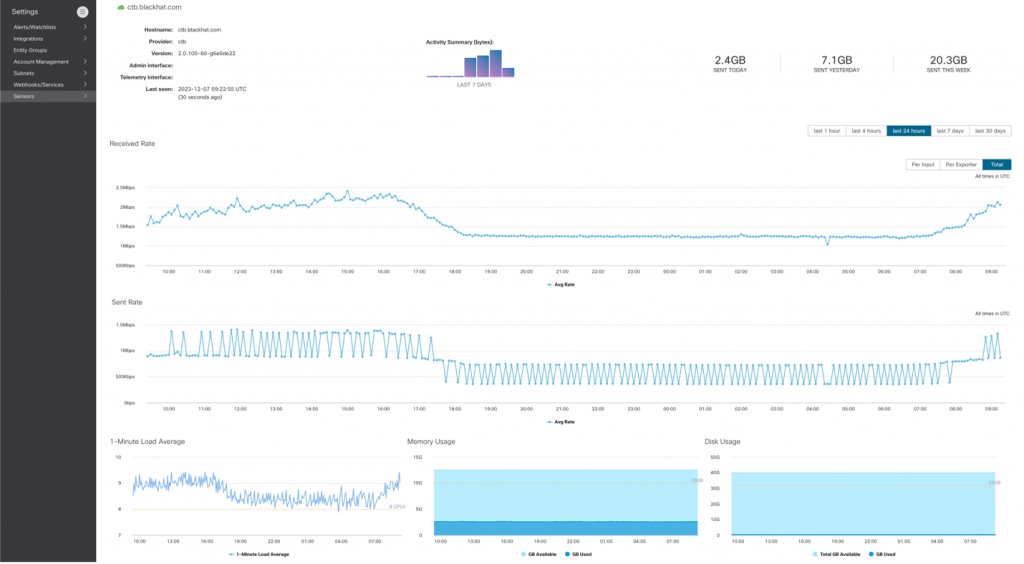
Black Hat Insights: Cisco Telemetry Broker
Cisco Telemetry Broker (CTB) acts as a foundational pillar for the intelligent telemetry plane, thereby future-proofing the telemetry architecture. It enhances visibility and context into the telemetry that drives the products that rely on it, facilitating telemetry brokering, filtering, and sharing. The Telemetry Broker is the culmination of years of management, troubleshooting, transforming, and sharing telemetry to empower Security and Network Analytics products.
At the Black Hat event, we employed the Telemetry Broker to process a SPAN (Switched Port Analyzer is a dedicated port on a switch that takes a mirrored copy of network traffic from within the switch to be sent to a destination) of all network traffic, along with the Netflow generated from Palo Alto Networks firewalls. This was part of our NOC collaboration and integrations. We then made all this data available to the threat hunters in Cisco XDR.
A typical Telemetry Broker deployment necessitates both a broker node and a manager node. To minimize our on-premises footprint, we chose to manage the broker node through XDR Analytics. This functionality was activated by the XDR Analytics Engineering team on our Black Hat XDR Analytics portal from the backend, as it is currently in beta. This enabled us to manage the broker node and review the metrics directly from the cloud.
We also installed an additional plugin known as the Flow Generator Plugin. This plugin enabled us to generate Netflow telemetry from the ingested SPAN traffic. With the beta code, we were fortunate to have the support of the engineering team to test the latest and most advanced technology Cisco has to offer. A special shoutout to the engineering team for their invaluable support.
Unleashing the Power of Cisco XDR Automate at Black Hat Europe
With the ever-evolving technological landscape, automation stands as a cornerstone in achieving XDR outcomes. It’s indeed a testament to the prowess of Cisco XDR that it boasts a fully integrated, robust automation engine.
Cisco XDR Automation embodies a user-friendly, no-to-low code platform with a drag-and-drop workflow editor. This innovative feature empowers your Security Operations Center (SOC) to speed up its investigative and response capabilities. You can tap into this potential by importing workflows straight from Cisco or by flexing your creative muscles and crafting your own.
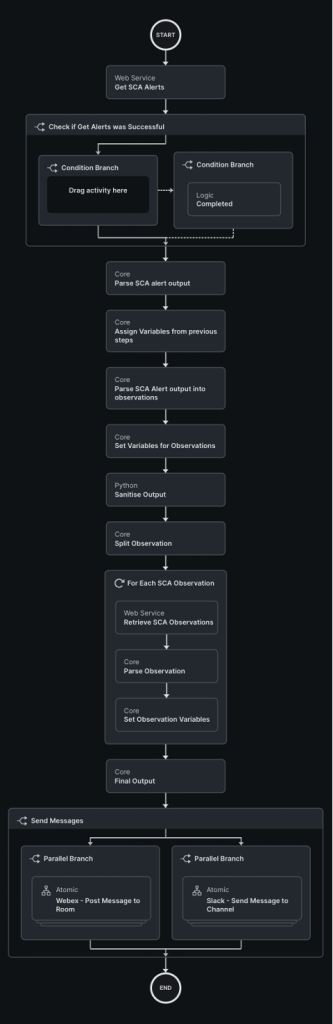
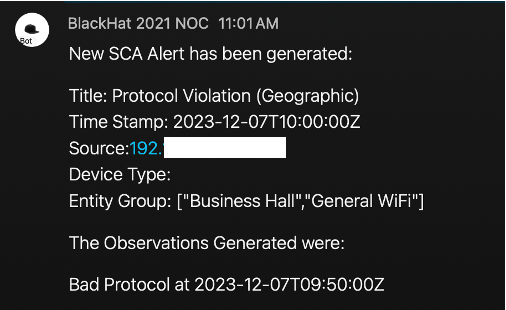
Cisco XDR introduces a trailblazing concept known as Automation Rules. This fresh take on automation promises to revolutionize the way you interact with the system. During the Black Hat Europe event, we flexed our inventive muscles and brought to life an XDR Automate workflow. This workflow was designed to spring into action whenever XDR Analytics posted an incident. The workflow would delve into the heart of the alert, extracting crucial details such as the alert description, publish time, entity groups, and observations. The parsed results were then broadcasted on Webex Teams via a message and simultaneously posted on Slack. This ensured that other threat hunters could readily consume the information. Furthermore, the workflow will be shared on GitHub, encouraging a wider audience to understand and appreciate the automation process.
The automation output is below. In the realm of cybersecurity, Cisco XDR Automate is pushing the boundaries, redefining how we perceive automation and its limitless possibilities.
“Collaboration” and “Continuity” – for successful threat hunting, by Ivan Berlinson
During Black Hat, the NOC opens early before the event and closes later after the trainings/briefings complete for the day. This means that every analyst position must be covered by a physical, uninterrupted presence for about 11 hours per day. Even with the utmost dedication to your role, sometimes you need a break, and a new potential incident doesn’t wait until you’ve finished the previous one.
Abhishek and I shared the role of Cisco XDR analyst, with morning and afternoon shifts. We have worked closely together to handle incidents or alerts from Cisco XDR analytics and to actively hunt threats. It was a great collaboration! It was important that we didn’t work in silos and that we acted as a team to make sure we maximized all our efforts. To do this, we of course needed good communication, but we also needed a platform that would support us and enable us to document and share information quickly and easily (the incident we’re currently working on, what we’ve found, what we’ve done…).
The Cisco XDR incident manager and ribbons (with its browser extension) were a great help and saved us a lot of time. Let’s quickly see how we used them in a typical investigation.
While I was performing a threat hunt based on a Malware Analytics (Threat Grid) report showing phishing indicators, XDR analytics alerted us about multiple communications to destinations on a list of countries to be monitored and using a non-standard protocol/port combination.
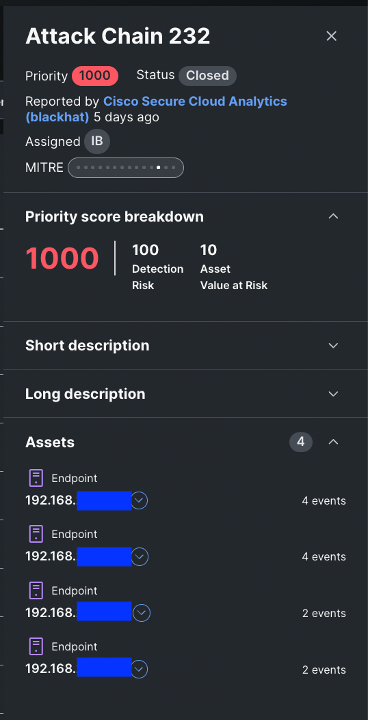
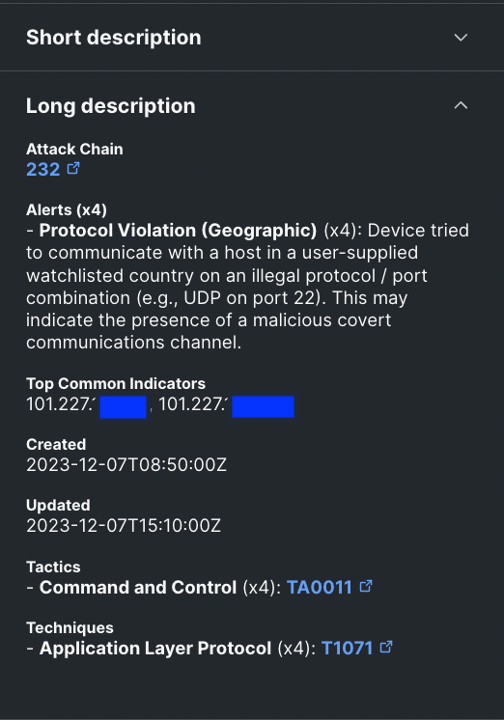
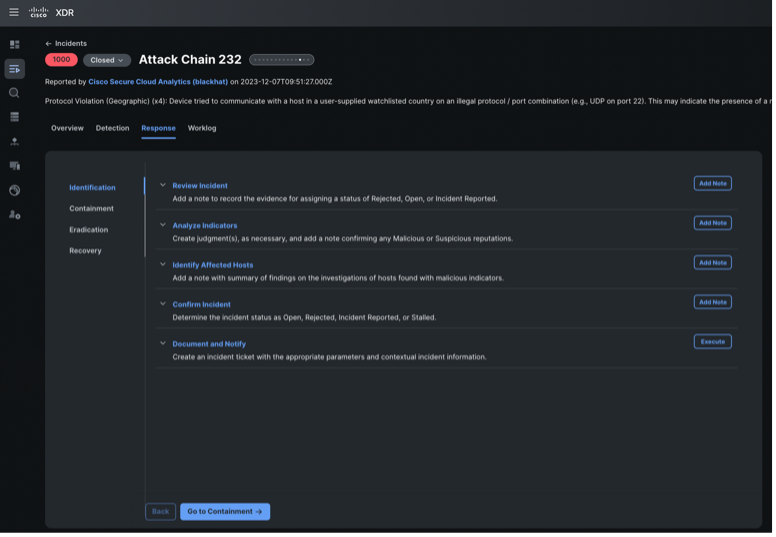
Cisco XDR – Incident summary
I took a quick look at the incident, and thanks to XDR attack chain and automatic enrichment, I had an instant view of the assets impacted and the multiple destinations involved.
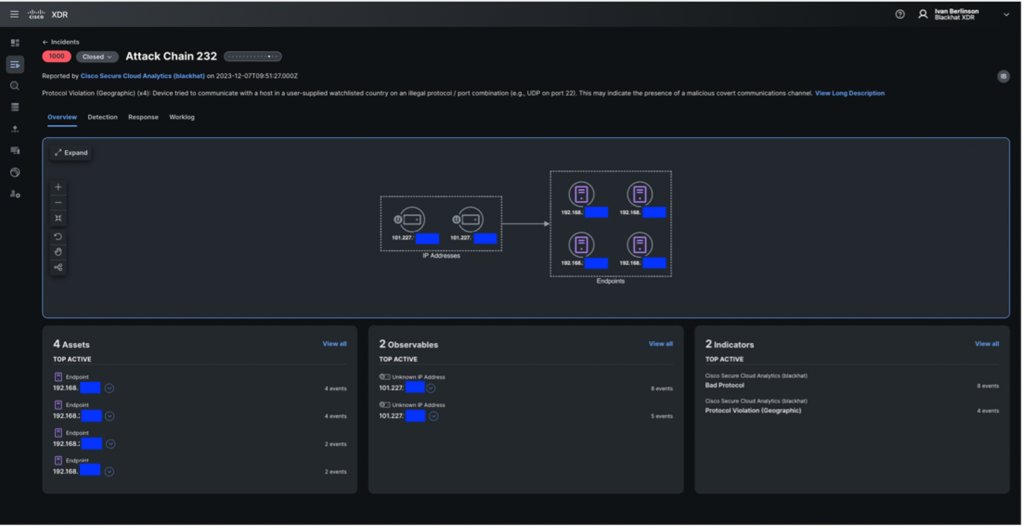
Cisco XDR – Incident main view (with auto-enrichment)
Telemetry from the NetWitness integration enriched the incident and confirmed the traffic, but the integrated threat intelligence sources did not provide any malicious verdicts or threat indicators related to these IP addresses. Further investigation was required to confirm this potential incident.
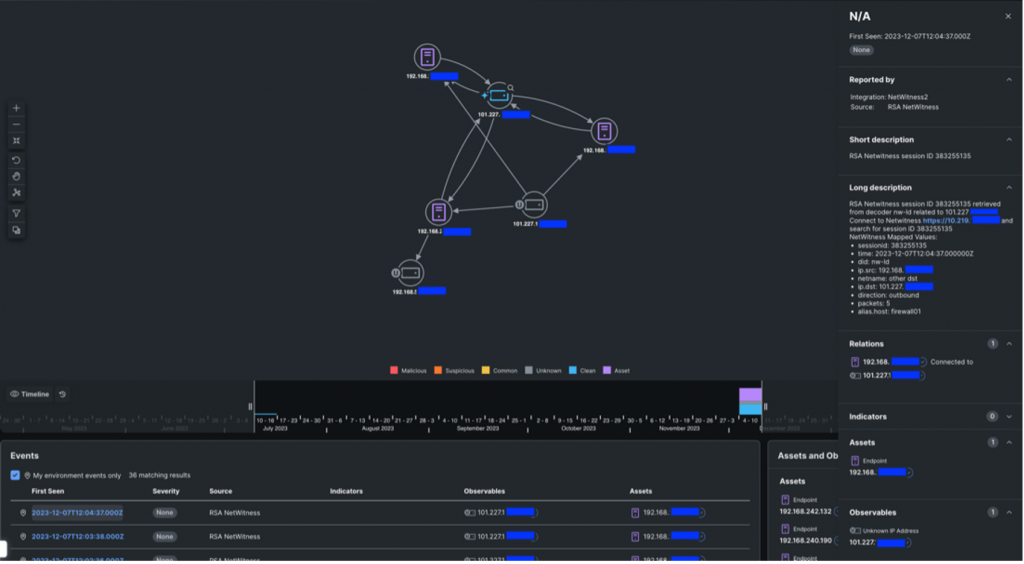
Investigation with telemetry from NetWitness
I added a note to the incident as part of the “Confirm Incident” step of the response plan, but as I was already on another activity, I asked Abhishek to get into the game.
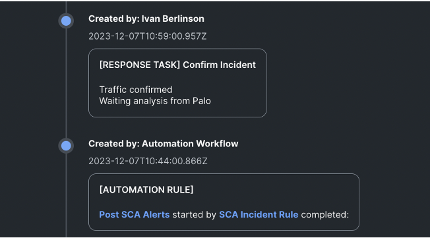
Cisco XDR – Guided Response
Abhishek was able to further investigate communication to those IPs in the raw network flows collected by XDR analytics and collaborate with the NetWitness team, who can look deep inside packet. But he doesn’t need to write down the IPs on paper or memorize them, we can use the Cisco XDR ribbon integrated in our browser to in one-click extract any observables in a web page.
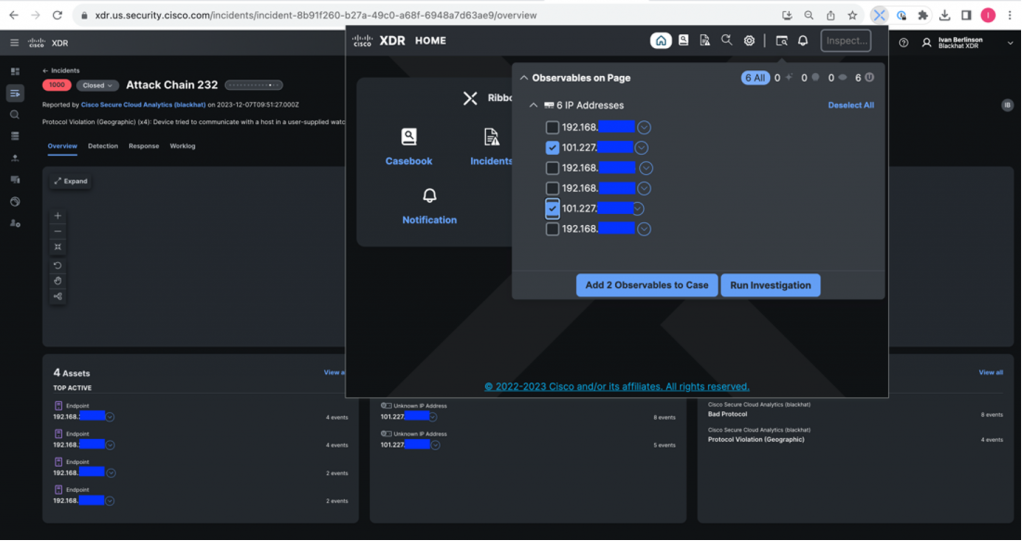
Add observables to casebook using Cisco XDR ribbon (browser-plugin)
We can then add them to a casebook shared automatically between us and available everywhere.
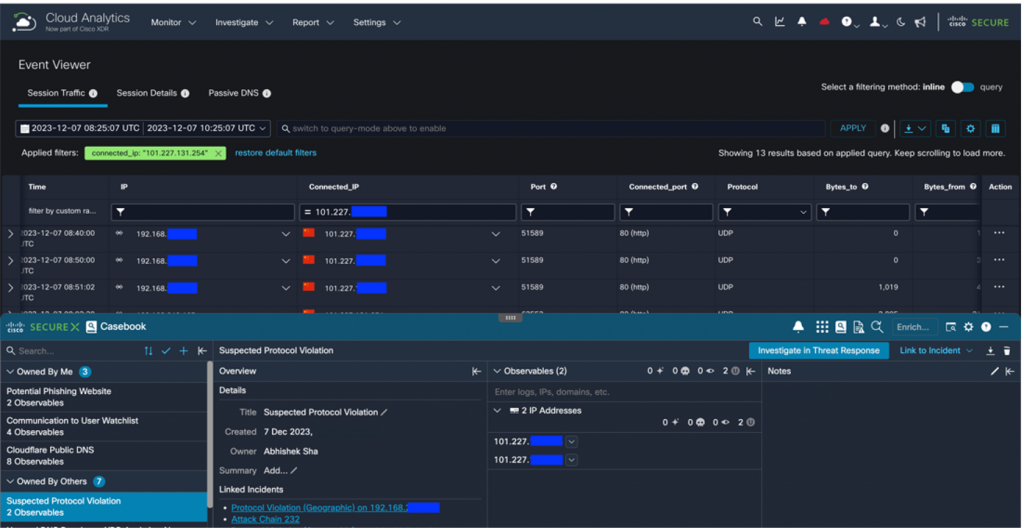
Casebook available for Abhishek in the XDR Analytics console
A few minutes later, I had finished with my previous file and was confident about going to lunch, knowing that Abhishek was on the case and had all the information he needed.
With the help of the Palo Alto analyst, it was confirmed that the traffic was legitimate (QUIC – HTTP/3).
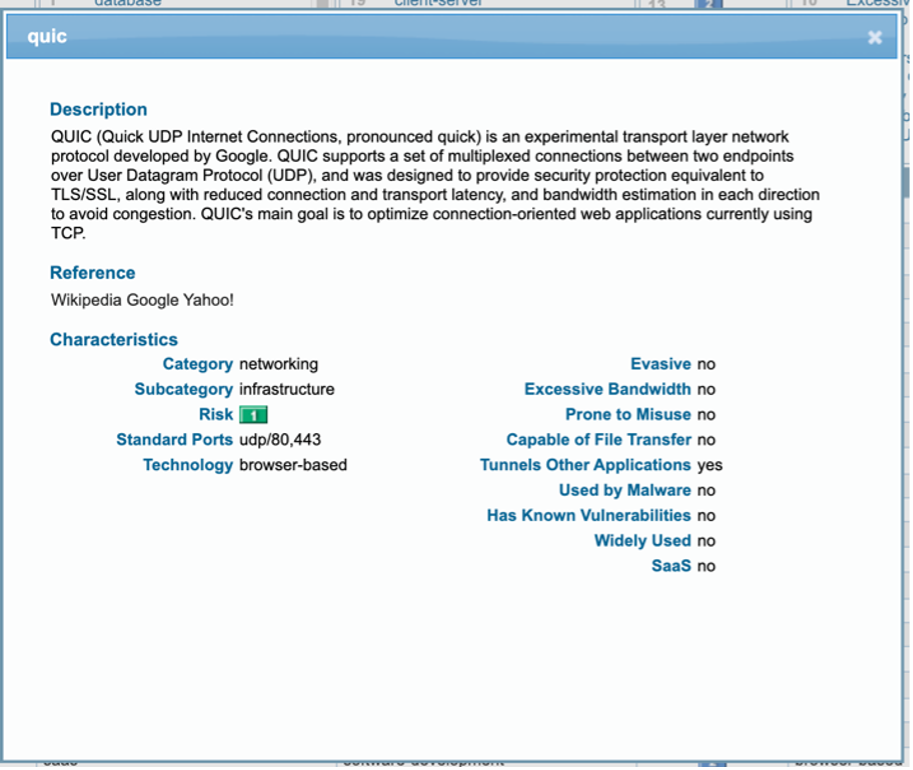
Confirmation from Palo Alto
Here are the browser extensions for your own SOC use:
- Firefox: https://cs.co/CiscoXDR_Firefox
- Chrome: https://cs.co/CiscoXDR_Chrome
Network Visibility with ThousandEyes, by Adam Kilgore and Alicia Garcia Sastre
Black Hat Europe 2023 is the third consecutive conference with a ThousandEyes (TE) presence, following a proof of concept in Black Hat Asia 2023 and an initial deployment at Black Hat USA 2023. Building upon our first full deployment in Vegas, we were focused on making improvements to deployment process, data baselining, and monitoring procedures.
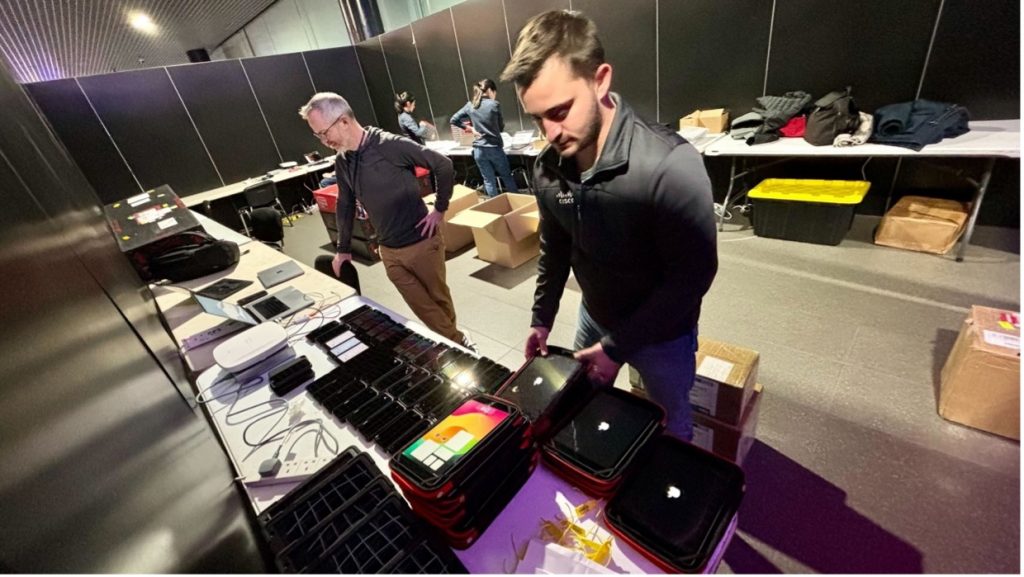
Hardware and Deployment Process
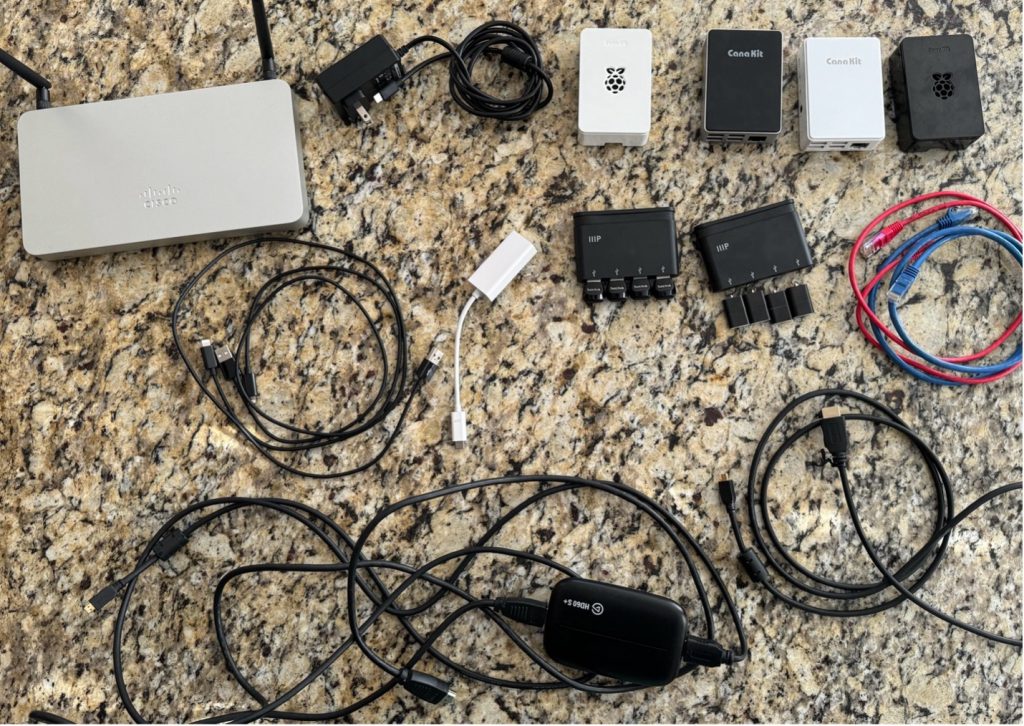
Some of the hardware we brought to the conference
Just like Black Hat USA 2023, we deployed 10 TE agents on Raspberry Pi’s. However, since ExCel London is a smaller venue, we had the same number of agents to spread across a smaller area—we still didn’t feel like we had a full Thousand Eyes, but definitely more visibility. We spread that visibility across core switching, Registration, the Business Hall, two- and four-day training rooms, and Keynote areas.
We also added a few accessories from lessons learned in Vegas. Deploying TE agents on micro-SDs is a time-consuming process which requires connecting the micro-SD to a laptop using a USB adapter. We invested in two adapters that can connect four USB adapters at once for more streamlined deployment and scaling.
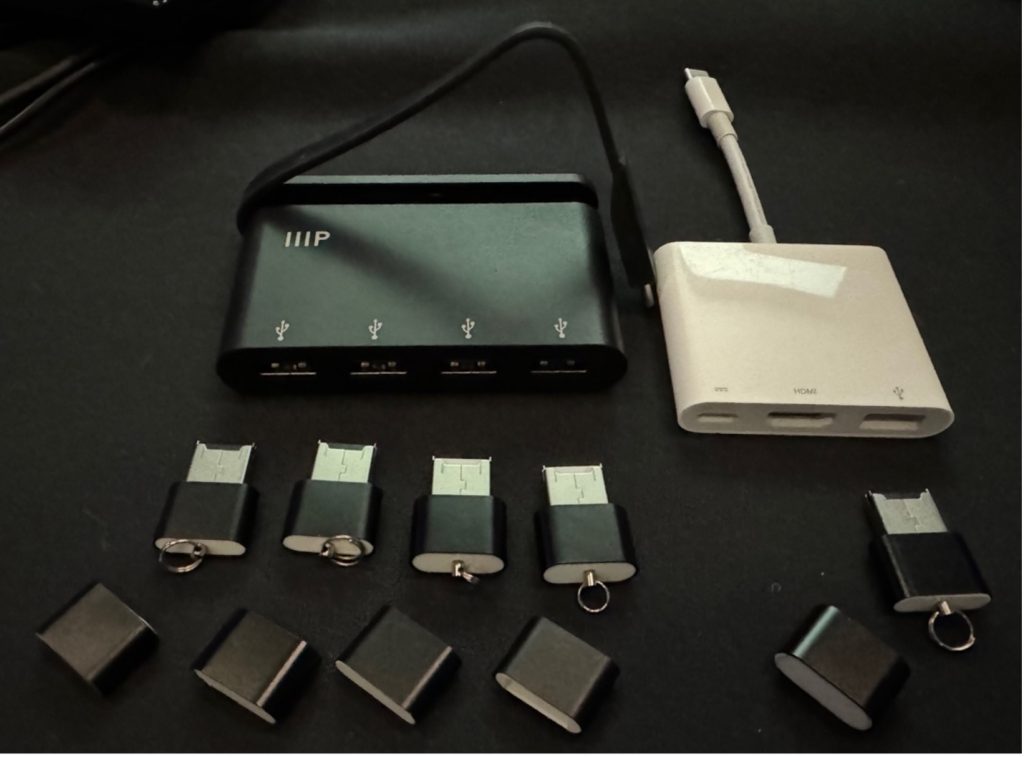
Economies of scale
At BH USA, we also developed a method for deploying TE agents wirelessly on Raspberry Pi (as covered in this blog post), even though this functionality isn’t technically supported. At BH Europe, our intention was to rely on wired Pi agents for the bulk of the monitoring; however, the wireless access points shipped to the conference did not have a free ethernet port. Because of this we ended up doing a primarily wireless deployment again, plus two wired agents connected to switching infrastructure. The new wireless deployment revealed some documentation and process improvements to roll into the prior blog post.
Enabling wireless on the ThousandEyes Pi image also makes the Pi more susceptible to overheating. The server room in London ExCel where we did our initial provisioning had a cooling problem and reached 28 degrees Celsius (82 F) at one point. The heat in the room caused a very fast failure of the wireless adapter, which initially made it appear that the wireless was not working at all. However, we eventually untangled the documentation and heat related problems and got all the Pi’s deployed, where they functioned stably throughout the conference, with only a few overheating incidents.
Changes in available personnel and hardware also necessitated a change in the Linux platform for configuring the scripts for persistent wireless deployment. We went with Ubuntu via VMWare Fusion on Mac laptops, which provided a smooth deployment sequence.
Monitoring, Alerting, and Baselining
The wireless network at BH Europe had less latency variation than BH USA, which required tuning of alert thresholds to reduce noise. At BH USA, we deployed a rule that fired when the latency on any agent exceeded two standard deviations above baseline. However, in BH Europe this alert was firing on latency changes that were statistically significant, but very minor in real world terms. For example, the alert below fired when latency increased 5.4ms+ above a 7.3ms baseline.
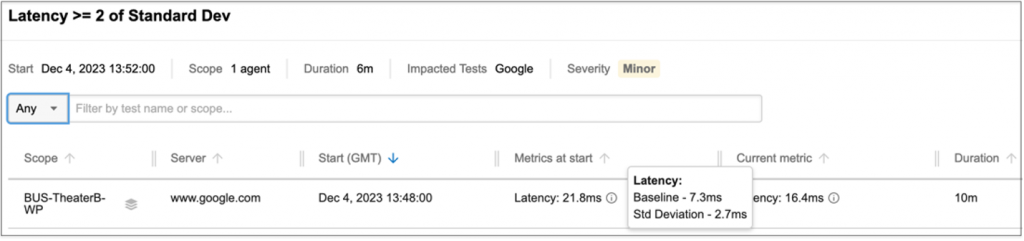
To control for smaller variations, we added a minimum threshold of 30ms change above baseline. This resulted in a much smaller set of more useful alerts, while still maintaining visibility into changing latency conditions before latency reached noticeably degraded levels.
Trains, Planes, and Wireless Access Points
On the last day of the conference, NOC morning staff found the wireless network was inaccessible 30 minutes before the conference opened for the day. Nothing gets the blood pumping like a network failure right before business hours. However, an expedited investigation revealed that only the NOC was affected, and not the broader conference wireless infrastructure.
Troubleshooting revealed that the SSID was available, but most of the endpoints could not detect it. A quick collaboration with our friends at Arista revealed that the endpoints trying to connect to 5 GHz were having issues, while the endpoints that were connected at 6 GHz were all fine—an important detail.
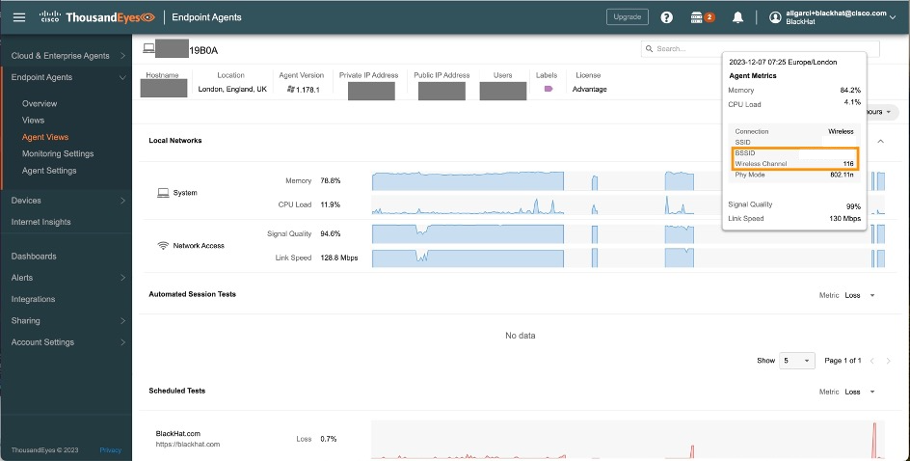
This was consistent with what we saw in the ThousandEyes portal. There was one engineer with a ThousandEyes endpoint agent running before the outage occurred. We jumped to agent views to check Wi-Fi stats.
While we were investigating, the SSID came back at 5 GHz.
Reviewing the TE endpoint logs, we found that the endpoint was connected to wireless channel 116 before the outage.
After recovery the endpoint was connected to channel 124.
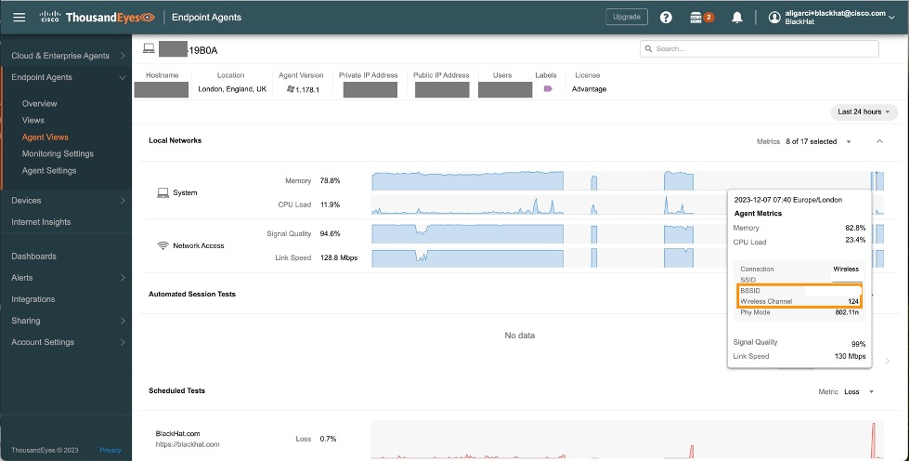
During the outage the endpoint was not capable of connecting to the Wi-Fi, creating a gap in the logs where no channel or signal strength was available. The channel change was indicative of the SSID coming back up and recalculating the best channel to advertise the SSID.
So why did the wireless channel of the SSID change and what was the trigger? Here comes the interesting part: The Black Hat conference is hosted at ExCeL London, less than four km away from the London City airport. Remember the initial channel of the SSID? It was 116, which is a Dynamic Frequency Selection (DFS) channel. These channels share the spectrum with weather radar and radar systems.
To share the use of these channels in Wi-Fi, a mechanism was put in place by regulators to prioritise radar usage, and this is exactly what DFS does. Wi-Fi devices will listen for radar events and either stop using the channels or automatically move off these channels when they detect radar events.
As we are so close to the airport, is not rare that one DFS event occurred. We are just lucky it didn’t happen more often.

Do you want to see the whole analysis for yourself? Thanks to a very handy feature of ThousandEyes, you can. All the information of this mini outage was captured in a web accessible report. Feel free to click around and find all the relevant information for yourself. The outage started at 7.31 am. The most insightful view can be found at Scheduled tests -> Network -> Click on the dotted lines to expose all the nodes in the path visualization and see metrics more clearly.
Meraki Systems Manager, by Paul Fidler and Connor Loughlin
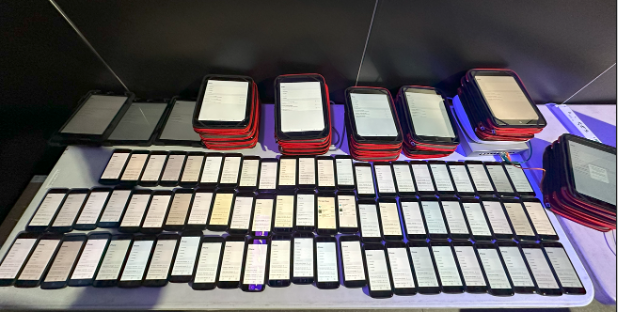
Our eighth deployment of Meraki Systems Manager as the official Mobile Devices Management platform went very smoothly, and we introduced a new caching operation to update iOS devices on the local network, for speed and efficiency. Going into the event, we planned for the following number of devices and purposes:
- iPhone Lead Scanning Devices: 68
- iPads for Registration: 9
- iPads for Session Scanning: 12
- Number of devices planned in total: 89
We registered the devices in advance of the conference. Upon arrival, we turned each device on.
Then we ensured Location Services enabled, always on.
Instead of using a mass deployment technology, like Apple’s Automated Device Enrollment, the iOS devices are “prepared” using Apple Configurator. This includes uploading a Wi-Fi profile to the devices as part of that process. In Las Vegas, this Wi-Fi profile wasn’t set to auto join the Wi-Fi, resulting in the need to manually change this on 1,000 devices. Furthermore, 200 devices weren’t reset or prepared, so we had those to reimage as well.
Black Hat Europe 2023 was different. We took the lessons from US and coordinated with the contractor to prepare the devices. Now, if you’ve ever used Apple Configurator, there’s several steps needed to prepare a device. However, all of these can be actions can be combined into a Blueprint.
For Black Hat Europe, this included:
- Wi-Fi profile
- Enrollment, including supervision
- Whether to allow USB pairing
- Setup Assistant pane skipping
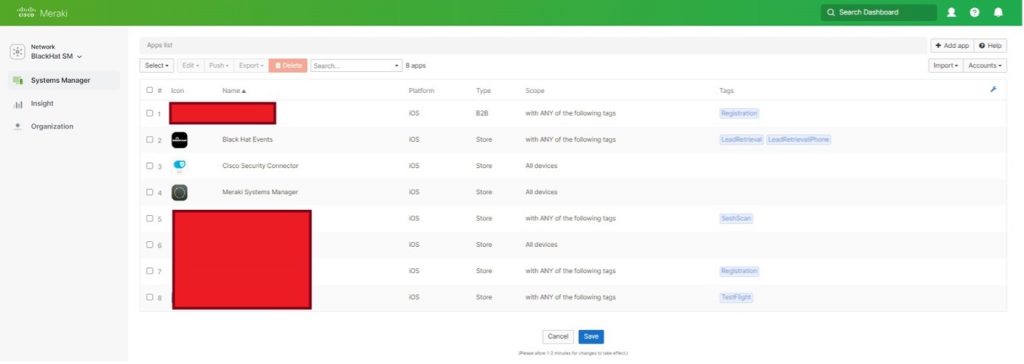
In Meraki Systems Manager, we controlled the applications by the assigned use, designated by Tags. When we came in on the first morning of the Briefings, three iPhones needed to be changed from lead scanning in the Business Hall, to Session Scanning for the Keynote, so the attendees could fill the hall faster. Reconfiguring was as simple as updating the Tags on each device. Moments later, they were ready for the new mission…which was important as the Keynote room filled to capacity and had to go to an overflow room.
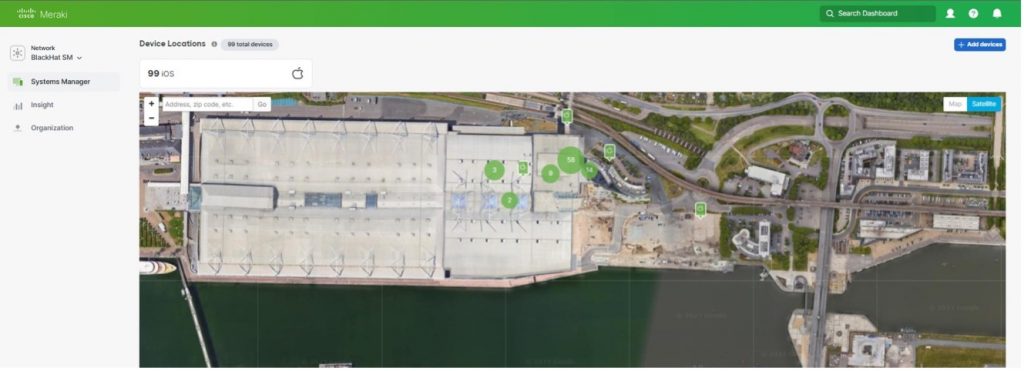
We also were able to confirm the physical location of each device, if wiping was required due to loss or theft.
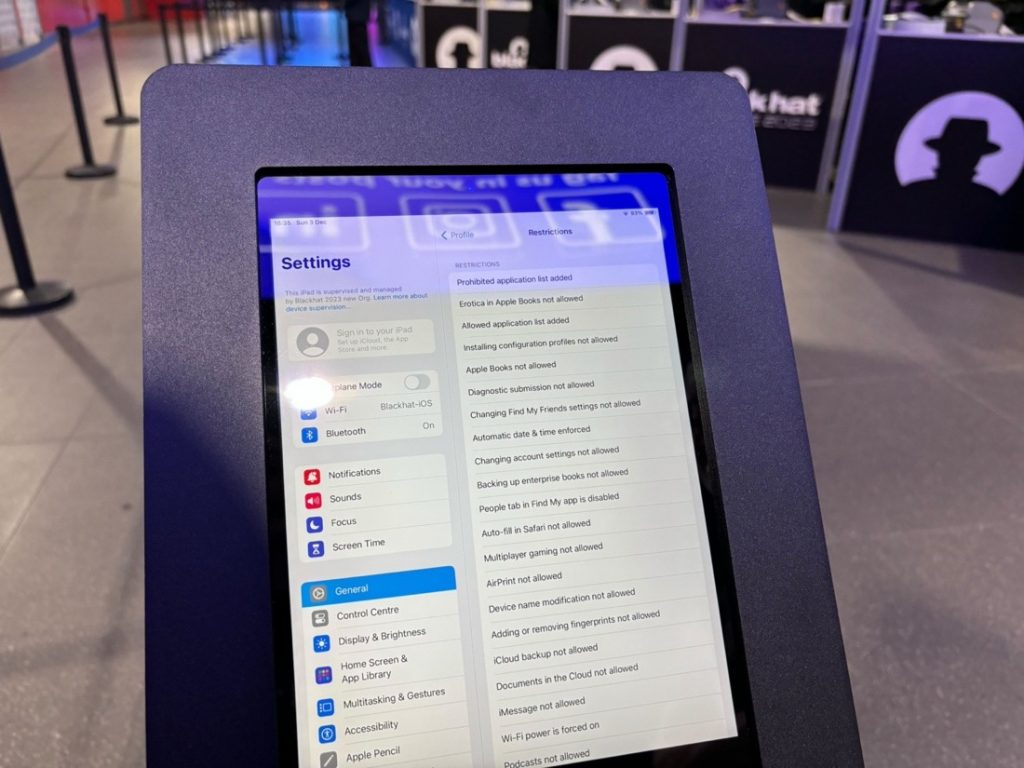
Below you can see page one of four pages of Restrictions imposed by Meraki Systems Manager.
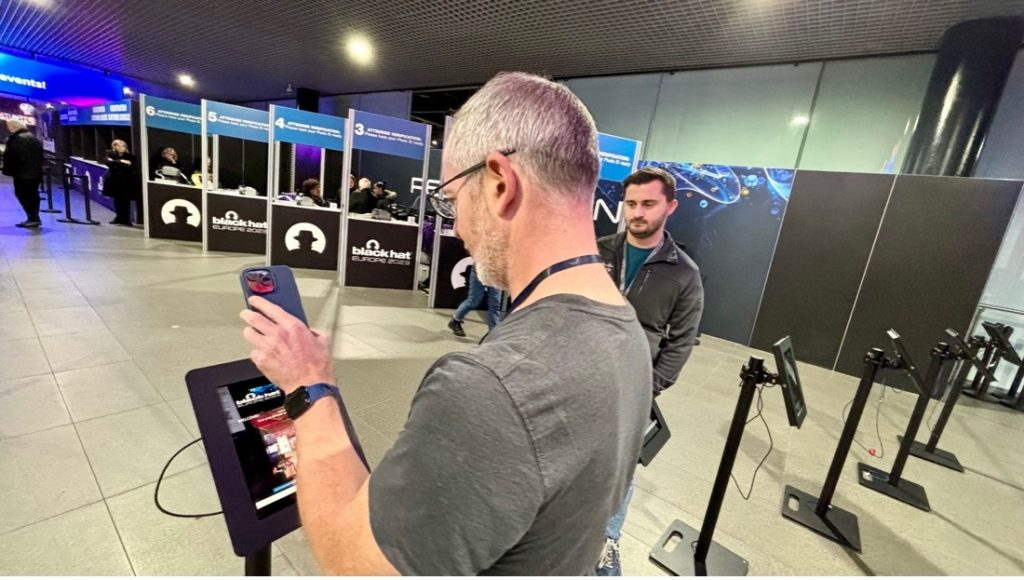
When it was time for the attendees to register, they just displayed their QR code from their personal phone, as received in email from Black Hat. Their badge was instantly printed, with all personal details secured.
This goes without saying, but the iOS devices (Registration, Lead Capture and Session Scanning) do have access to personal information. To ensure the security of the data, devices are wiped at the end of the conference, which can be completed remotely through Meraki Systems Manager.
Content Caching
One of the biggest problems affecting the iOS devices in BH USA 2023 was the immediate need to both update the iOS device’s OS due to a patch to fix a zero-day vulnerability and to update the Black Hat iOS app on the devices. There were hundreds of devices, so this was a challenge for each to download and install. So, I took the initiative into looking into Apple’s Content Caching service built into macOS.
Now, just to be clear, this wasn’t caching EVERYTHING… Just Apple App store updates and OS updates.
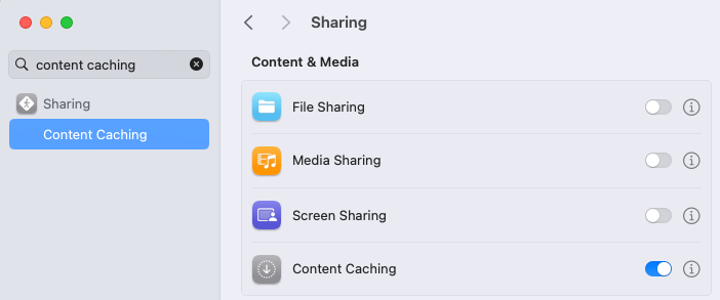
This is turned on withing System Setting and starts working immediately.
I’m not going to get into the weeds of setting this up, because there’s so much to plan for. But, I’d suggest that you start here. The setting I did change was:
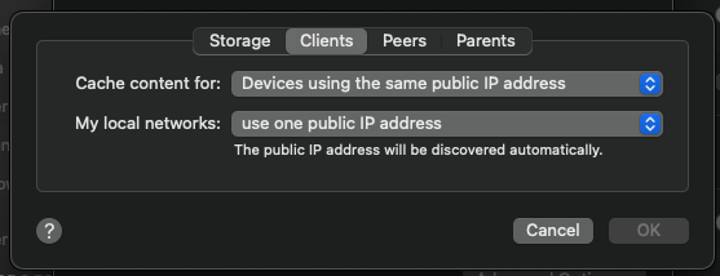
I checked to see that we had one point of egress from Black Hat to the Internet. Apple doesn’t go into too much detail as to how this all works, but I’m assuming that the caching server registers with Apple and when devices check in for App store / OS update queries, they are then told where to look on the network for the caching server.
Immediately after turning this on, you can see the default settings and metrics:
% AssetCacheManagerUtil settings
Content caching settings:
AllowPersonalCaching: true
AllowSharedCaching: true
AllowTetheredCaching: true
CacheLimit: 150 GB
DataPath: /Library/Application Support/Apple/AssetCache/Data
ListenRangesOnly: false
LocalSubnetsOnly: true
ParentSelectionPolicy: round-robin
PeerLocalSubnetsOnly: true
And after having this run for some time:
% AssetCacheManagerUtil settings
Content caching status:
Activated: true
Active: true
ActualCacheUsed: 528.2 MB
CacheDetails: (1)
Other: 528.2 MB
CacheFree: 149.47 GB
CacheLimit: 150 GB
CacheStatus: OK
CacheUsed: 528.2 MB
MaxCachePressureLast1Hour: 0%
Parents: (none)
Peers: (none)
PersonalCacheFree: 150 GB
PersonalCacheLimit: 150 GB
PersonalCacheUsed: Zero KB
Port: 49180
PrivateAddresses: (1)
x.x.x.x
PublicAddress: 86.28.74.239
RegistrationStatus: 1
RestrictedMedia: false
ServerGUID: xxxxxxxxxxxxxxxxxx
StartupStatus: OK
TetheratorStatus: 1
TotalBytesAreSince: 2023-12-01 13:35:10
TotalBytesDropped: Zero KB
TotalBytesImported: Zero KB
TotalBytesReturnedToClients: 528.2 MB
TotalBytesStoredFromOrigin: 528.2 MB
Now, helpfully, Apple also pop this data periodically into a database located at:
Library/Application Support/Apple/AssetCache/Metrics/Metrics.db in a table called ZMETRICS
Visualising this data: Reading from macOS Metrics.db
Inspired by a blog I read (inspired because I couldn’t get the ruby script to work) I set off to try and create a front end to this using Grafana. After installing a SQLIte plug in into Grafana, I could eventually see data in Grafana, which was great, but the Unix date seemed VERY from 1993. I spent two hours trying to wrangle the data into something usable and viewable on a graph to no end, so I gave up.
However, it’s amazing the difference a day makes. I went back to Grafana and the SQLite db, and had some success:
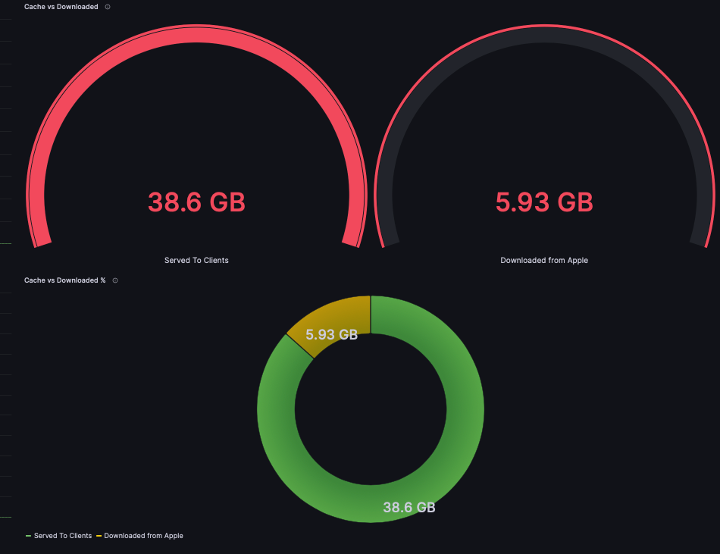
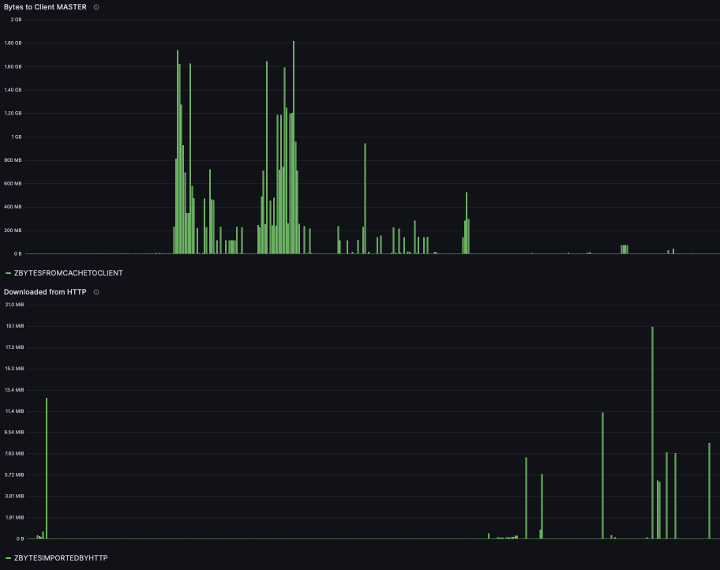
This diagram shows the cache vs usage of cache. Bear in mind that there was a single OS update, and only a handful of applications on the managed iOS devices (as well as updates for the Mac Mini that caching server is running on).
I also perservered with a history of cache usage:
Try as I might, I could not find a way to show the dates across the X Axis. I will persevere with this for Black Hat Asia 2024.
Visualising this data: Reading from my own database
Firstly, I reused some of the simple code to manipulate the data from the AssetCacheManagerUtil settings command. I then created a script that first created a SQLite database, and then, every 900 seconds, put the data into it. The code to do this is here on GitHub.
After working with the data in here, it seems incomplete. I’ll endeavor to work on this so that the data is more believable for Singapore. In principal, however, this looks like a better way to store the data. Cache Pressure, for example, does not appear in the database.
Domain Name Service Statistics and Streamlining NOC Threat Hunting by Alex Calaoagan
Since 2017, we have been tracking DNS stats at the Black Hat conferences, and year over year (except over the course of the pandemic), the show has continued to grow. That growth is reflected in the DNS traffic that we capture.
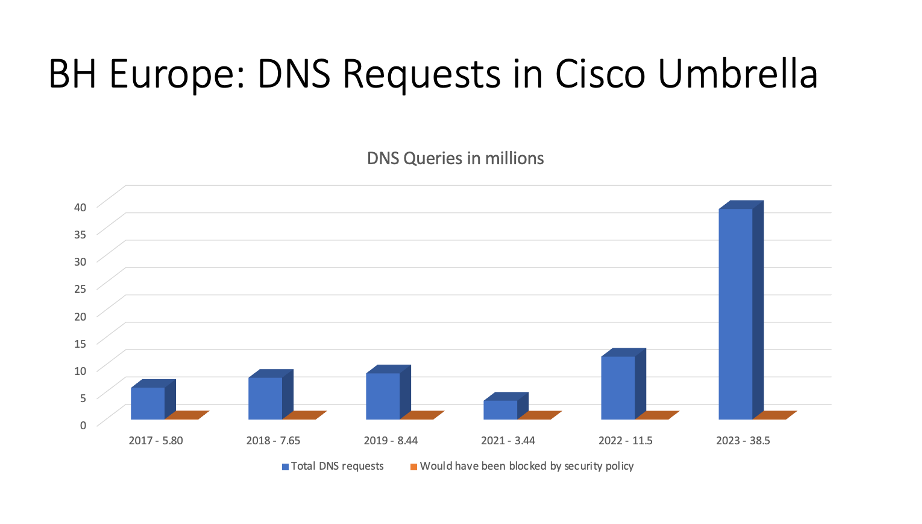
With over 38M DNS requests made, BH Europe 2023 has been, by far, the largest London show on record. The huge jump in DNS requests can be attributed not just to growth, but also to the visibility advancements we made at BH Asia 2023, earlier this year in Singapore.
*Quick reminder from Singapore: Working with Palo Alto Networks, we forced attendees, via a firewall redirect initiated by Palo Alto Networks, to use our resolvers. Without this change, Umbrella would not see the traffic at all, as these machines with hardcoded DNS, whether it was 1.1.1.1 (Cloudflare) or 8.8.8.8 (Google), were able to bypass our Virtual Appliances.
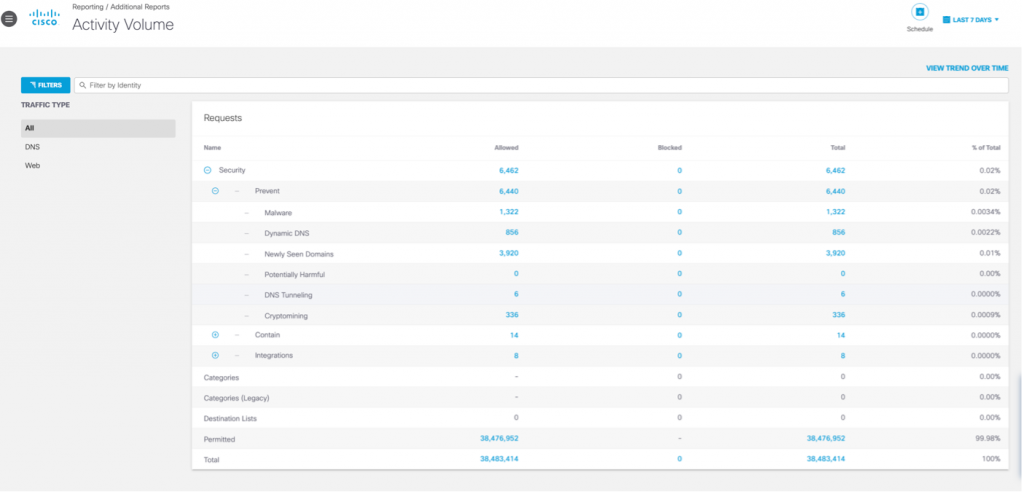
The Activity volume view from Umbrella gives a top-level level glance of activities by category, which we can drill into for deeper threat hunting. On trend with the previous BH Europe events, the top Security categories were Malware and Newly Seen Domains.
In a real-world environment, of the 38M requests that Umbrella saw, over 6,000 of them would have been blocked by our default security policies. However, since this is a place for learning, we typically let everything fly (more on that later).
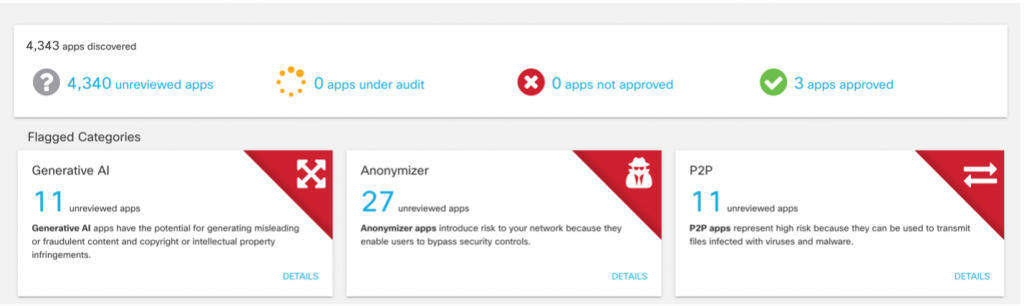
App Discovery in Umbrella gives us a quick snapshot of the cloud apps in use at the show. In line with Black Hat’s growth over the years, the number of cloud apps in play has steadily risen. This number tends to follow attendance levels, so no surprise here.
2021: 2,162 apps
2022: 4,159 apps
2023: 4,340 apps
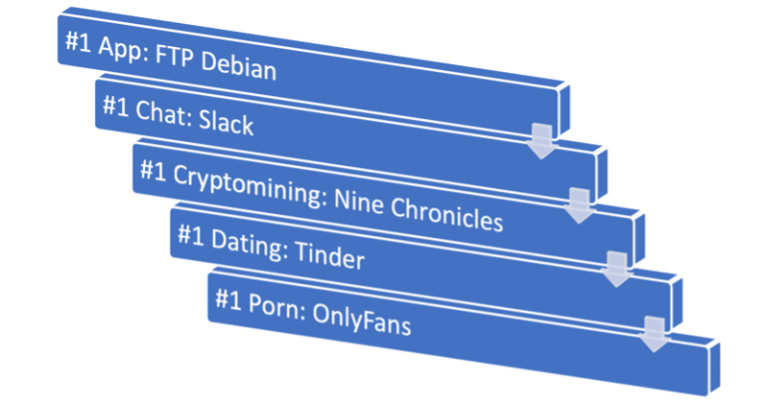 Interested in what apps attendees hit the most? Here you go. The only surprises were Slack (WhatsApp being the incumbent…we are in Europe, right?) and Nine Chronicles (who knew Block Chain MMORPG gaming was a thing? I certainly did not).
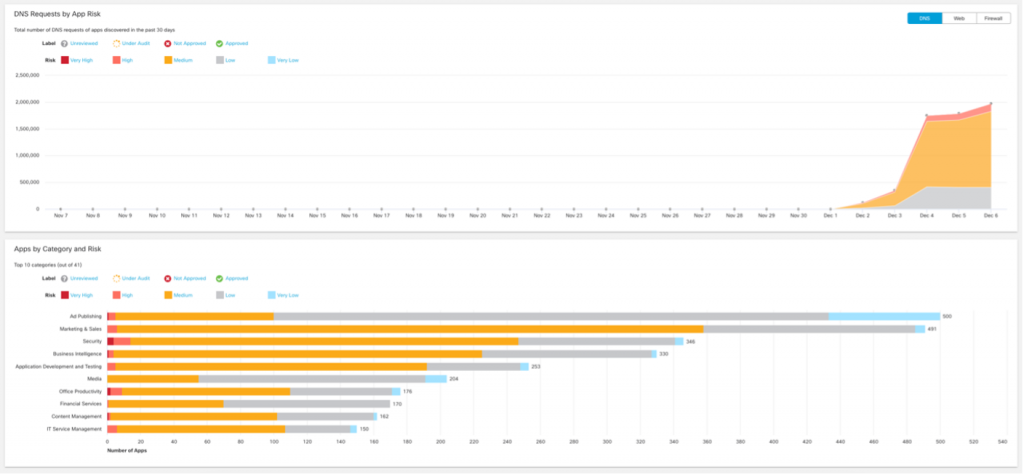
Umbrella also identifies risky cloud applications. Should the need arise, we can block any application via DNS, such as Generative AI apps, Wi-Fi Analyzers, or anything else that has suspicious undertones. Again, this is not something we would normally do on our General Wi-Fi network, but there are exceptions. For example, every so often, an attendee will learn a cool hack in one of the Black Hat courses or in the Arsenal lounge AND try to use said hack at the conference itself. That is obviously a ‘no-no’ and, in many cases, very illegal. If things go too far, we will take the appropriate action.
A useful Cisco XDR Automate workflow, deployed by Adi Sankar and updated by Abhishek Sha (as mentioned in a post above), helps streamline our threat hunting efforts via a Webex plugin that feeds alerts into our collaboration platform, significantly improving threat response times. Do you have several product user interfaces and threat intelligence sources to log-in to? Integration and enhancing intelligence delivery helps ease the overhead of combing through mountains of data.
Applying this plug-in to our NOC threat hunting duties, we were able to quickly identify a device that was beaconing out to multiple known malicious sites.
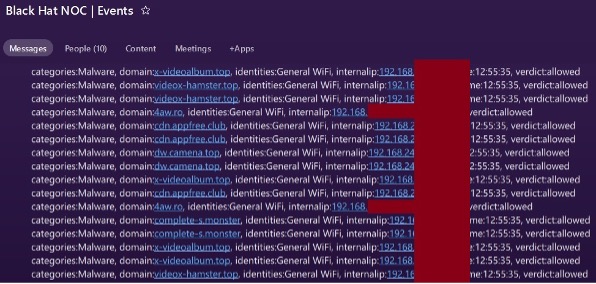
After further investigation and searching DNS records for *hamster*, we found that another user was a little distracted on their device during the conference. You can also see below how we allow Training rooms to connect to new (and potentially malicious) domains for educational purposes.
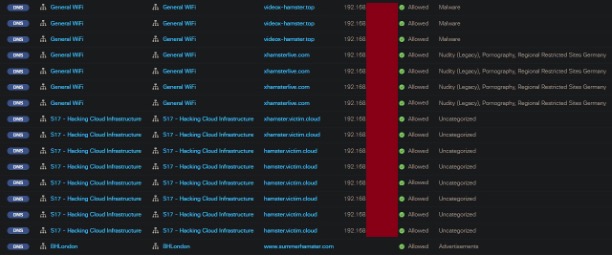
Digging into the issue of the user repeatedly connecting to several known malicious sites, using yet another visibility enhancement we made at Black Hat Singapore 2023, we identified each network zone the user traversed during the show. Again, if this were a corporate environment and a real threat was identified, this data could be used to zero on specific compromised devices, giving the network team a map of how to respond and potentially quarantine in the event a threat has spread. We can even use this to help determine “Patient Zero,” or the origin of the compromise itself.
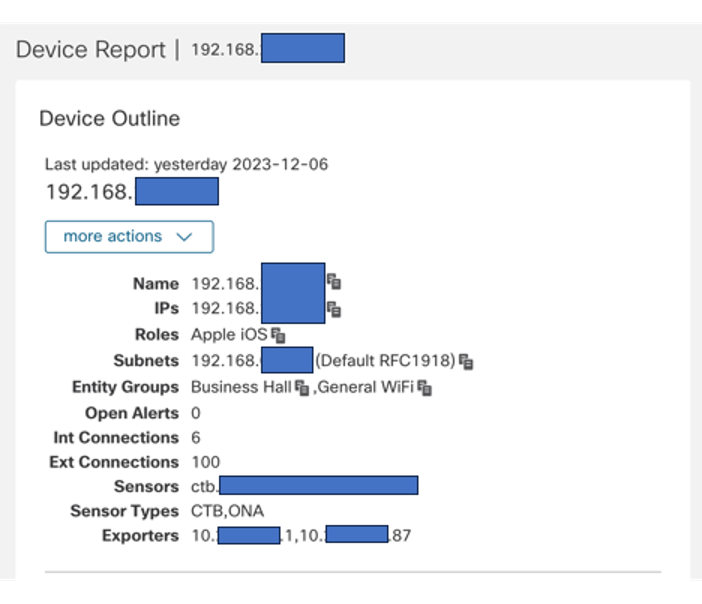 *Quick reminder: We mapped out every Black Hat network zone at the ExCel center in Umbrella to help us identify what areas of the show floor requests originated from.
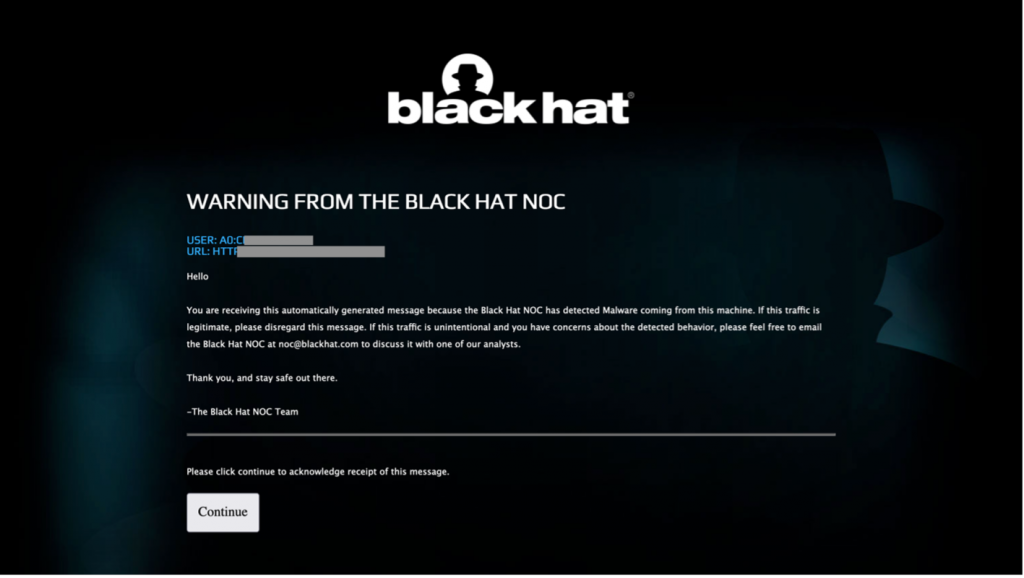
Going even deeper, using Cisco Secure Cloud Analytics, we found the device to likely be an iPhone. With this new information in hand, it is a safe assumption that the device was already compromised before the attendee walked in the building. The NOC leaders authorized Palo Alto Networks to put up a captive portal to warn the user that the machine was infected.
As I mentioned above, Umbrella would normally block these known malicious requests and porn visits (if your network admin deemed necessary) in the real world, right off the bat. Here at Black Hat however, because this is a learning environment, we normally allow all requests. To help educate and serve the conference attendees better, rather than kicking them off the network, we give them notification via a captive portal. If the attendee disregards our warning (such as conducting unlawful activities), we will again take the appropriate action.
All in all, we are very proud of the collaborative efforts made here at Black Hat Europe by both the Cisco team and all the participating vendors in the NOC. Great work everybody!
Black Hat Asia will be in April 2024, at the Marina Bay Sands, Singapore…hope to see you there!
Acknowledgments
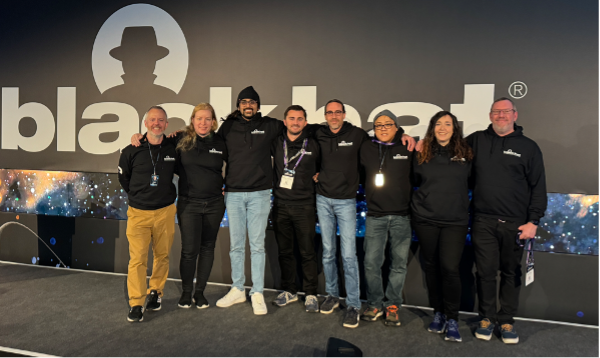
Thank you to the Cisco NOC team:
- Cisco Security: Ivan Berlinson, Abhishek Sha, Alejo Calaoagan, Adam Kilgore and Alicia Garcia Sastre
- Meraki Systems Manager: Paul Fidler and Connor Loughlin
- Additional Support and Expertise: Adi Sankar, Ryan Maclennan, Robert Harris, Jordan Chapian, Junsong Zhao, Vadim Ivlev and Ajit Thyagarajan
Also, to our NOC partners NetWitness (especially David Glover, Iain Davidson and Alessandro Zatti), Palo Alto Networks (especially James Holland), Corelight (especially Dustin Lee), Arista Networks (especially Jonathan Smith), and the entire Black Hat / Informa Tech staff (especially Grifter ‘Neil Wyler’, Bart Stump, Steve Fink, James Pope, Michael Spicer, Jess Stafford and Steve Oldenbourg).
About Black Hat
For over 25 years, Black Hat has provided attendees with the very latest in information security research, development, and trends. These high-profile global events and trainings are driven by the needs of the security community, striving to bring together the best minds in the industry. Black Hat inspires professionals at all career levels, encouraging growth and collaboration among academia, world-class researchers, and leaders in the public and private sectors. Black Hat Briefings and Trainings are held annually in the United States, Europe and USA. More information is available at: Black Hat.com. Black Hat is brought to you by Informa Tech.
We’d love to hear what you think. Ask a Question, Comment Below, and Stay Connected with Cisco Security on social!
Cisco Security Social Channels


Abhishek Sha, I am so so so proud of you. ❤️ u.