We recently concluded another successful Cisco Live! event in San Diego which showcased some of the most innovative and exciting technologies in our industry. One of the most exciting solutions present at Cisco Live was in fact running in the background the whole time. CMX Analytics leverages the WLAN network to analyze how people move around the venue, where they spend their time, and when they visited different parts.
So what can we tell about Cisco Live from looking at CMX Analytics? First of all we can see how people moved around the venue throughout the week. Here we are seeing three days of data showing us where people were throughout the day.
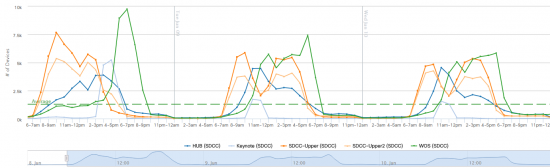
We can notice several things:
- People like happy hour – If you look at the data for WoS (World of Solutions – the green line) we can see that there is a spike in attendance at the end of every day – this corresponds to Happy Hour when visitors could get a beer to cap off a long day at the show. You can clearly see that at the end of the day, most of the visitors congregate in the World of Solutions.
- The Hub was a huge success – Within the venue there was a zone called the Hub which was where visitors could meet with Cisco engineers for more casual technical discussions. The Hub is represented by the blue line and what is immediately visible is that people came to the hub after the morning sessions around lunch time. In both the Tuesday data as well as the Wednesday data it’s clear that the Hub traffic peaks at the same time the Upper Floor attendance ebbs.
- John Chambers keynote was very popular – the Keynote area (the light blue line) shows a massive spike during the keynote peaking at more than 5000 unique devices
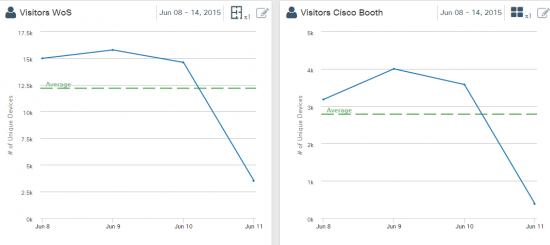
Another interesting question is how many people came to the Cisco booth in the World of Solutions. Looking at the data we can see that on average around 25% of the visitors to the WoS came to the Cisco Booth. Should be noted that to get more accurate data we are filtering out visitors that spent less than 20 minutes in the Cisco Booth (‘walking through’) as well as devices that were seen for more than 4 hours (which we assume are the booth staff).
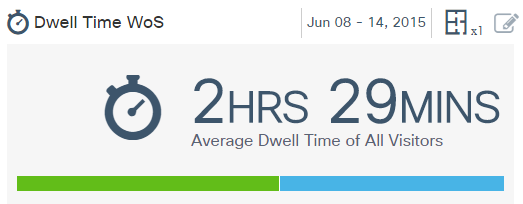
Another interesting metric is how long did people spend in the World of Solutions and particularly in the Cisco booth. Looking at the data we can see that on average people spent nearly two and a half hours in the WoS.
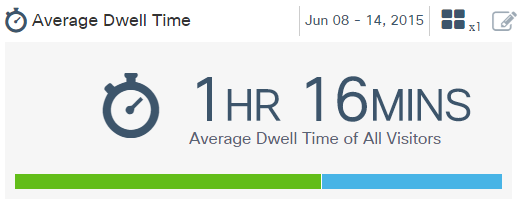
And about an hour and fifteen minutes in the Cisco Booth:
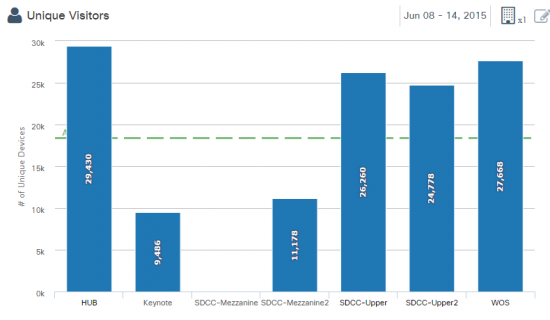
Finally let’s look at the number of unique visitors to different parts of the venue. Overall the zone that saw the most visitors was the hub, followed by the WoS.
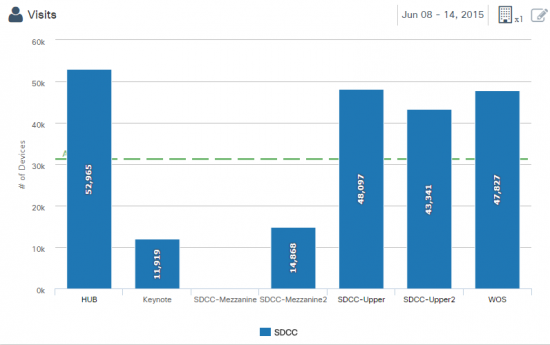
Over 27,000 visitors to the WoS is great, but doesn’t tell the whole story, because many people visited the WoS more than once during the event. To account for that we can look at the number of visits throughout the event. This shows the WoS had nearly 50,000 visits (of more than 20 minutes) throughout the week.
 Make sure to check out more at Cisco.com/go/cmx
Please feel free to comment, share and connect with us on Facebook, Google+ and @Cisco_Mobility!