
In this blog post we will discuss how to add visibility, threat detection, security analytics, and alerting inside of your Kubernetes cluster using Cisco Secure Cloud Analytics (formerly known as Stealthwatch Cloud). This is the fourth blog post in a series. In case you have missed the first three parts, you can check them out here:
- Part 1: Cisco Cloud Native Security – Going Up the Stack from Infrastructure to Application
- Part 2: Cisco Cloud Native Security – Provisioning the Infrastructure
- Part 3: Cisco Cloud Native Security – GitOps and CI/CD
At the bottom of this blog post, we have a demo video that walks through everything discussed in this blog post. As always, check out the DevNet Security Dev Center for other cool demo videos and use cases! Also, we have a dedicated page for Secure Cloud Analytics, which you definitely want to checkout…
Let’s walk through the steps that we will take in this section
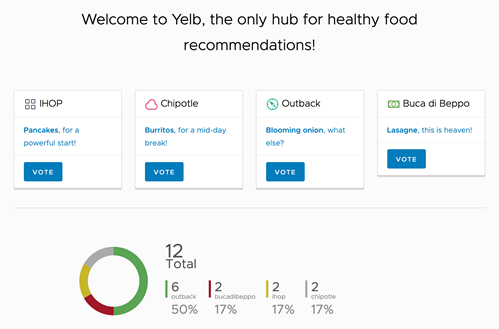
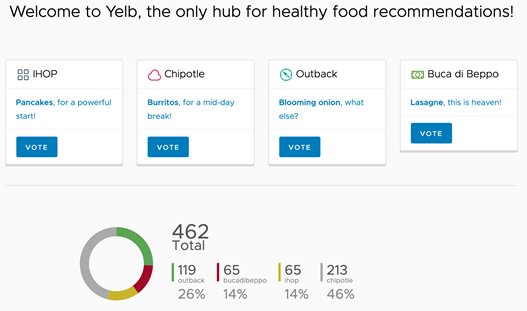
Remember, we also have a video walkthrough at the bottom of this page. First, we will deploy a cloud native application named Yelb, which is a 3 tier demo app with a Redis caching service. Yelb allows users to vote on a set of alternatives (restaurants) and dynamically updates pie charts based on number of votes received. Next, we will use the Kubernetes CLI (kubectl) to validate the cluster is up and running with an active worker node. Then we will use kubectl to deploy the cloud native Yelb app to the cluster. Once the app is up and running, we will deploy Cisco Secure Cloud Analytics into the Kubernetes cluster using Terraform. Finally, we will generate traffic to our application using Locust, which is an open source, easy to use, scriptable and scalable performance testing tool. Also, we will use netshoot, which is a used for debugging which we will use to run Nmap scans (think insider threat).
Building apps may or may not be your thing but having demo apps available at the push of a button is always nice to have. In the next blog post, we will go through building our own apps and APIs just so we can expose some vulnerabilities to secure, but for now we are going to use the power of automation and orchestration to deploy our apps instantaneously using a Kubernetes Manifest file.
Earlier in this blog post series, we learned how to deploy our cloud resources using Infrastructure as Code and GitOps. We deployed an AWS VPC, EKS Cluster, and two EC2 instances using Terraform. One instance is hosting the Cisco Secure Firewall and the other instance hosting the EKS worker node. We then used Ansible to configure the Cisco Secure Firewall access control policies. We verified that everything was deployed correctly by going to the AWS Dashboard and Firepower Device Manager.
Before we get into the step-by-step explanation of how to do all of the above, let’s elaborate a bit more on what Cisco Secure Cloud Analytics brings to the table. Secure Cloud Analytics provides comprehensive visibility and high-precision alerts with low noise, without the use of agents. Organizations can also monitor their cloud security posture to ensure configuration best practices and adherence to internal policies, thereby limiting potential risk and exposure of their cloud infrastructure. Secure Cloud Analytics is a cloud-based, Software-as-a-Service (SaaS)-delivered solution. It detects ransomware and other malware, data exfiltration, network vulnerabilities, system, event and configuration risk, and role changes that indicate compromise.
As always, you have a choice now… You can watch the demo video, or read through the detailed instructions below. (You can also do both!)
Detailed Instructions
If you are reading this, it means you are interested to learn the details of this set up. Let’s jump right in! First, let’s make sure the Kubernetes cluster is ready by using CLI tools such as the AWS CLI and KUBECTL. Remember the Terraform output from Jenkins, we will use the outputs to access our EKS environment.
First, we need to set our Kubernetes context by running aws eks –region us-east-2 update-kubeconfig –name <cluster-name>:
![]()
This will update the .kube/config context on the local host so we can access the EKS cluster. In this example the name of the cluster is SPOT_ON_Prod and the region is US-EAST-2.
Next, let’s check out if we have any worker nodes active by doing a kubectl get nodes.

We see that one of the EC2 instances is assigned to EKS cluster as a worker node and the status is showing Ready.
Great! We can deploy our Yelb app very easily now by running kubectl create –f <file.yaml>. The YAML file we will be using to deploy our app is yelb_app.yaml, which can be found HERE.
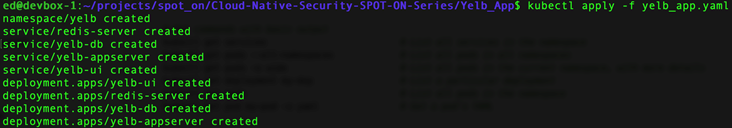
Well, that was super easy and fast. Let’s check out what was just created. We have a namespace which is a container for the app, there are 4 pods running our containers, and 4 services that front end the pods. Notice the yelb-ui service, which is TYPE = NodePort. This indicates that service port for this pod will be exposed on the EKS worker node. The container runs on port 80, but it is mapped to port 30001 on the worker node. This means our app will be available to the internet on port 30001. Normally our apps run behind a network or application load balancer, but since this is just a demo using one worker node, the node port will work fine for now.

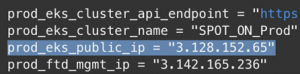
We can access the application using the prod_eks_public_ip from the Terraform output and port 30001, for example, http://3.128.152.65:30001.
The application is now up and running and we can access it from the internet. In the previous blog we deployed a Cisco Secure Firewall to the edge of the VPC, which provides us access control, intrusion prevention, and anti-malware protection for traffic coming in and out of the VPC. This is no doubt very important to have, but what about traffic inside of the EKS cluster? How do we get visibility, analytics, and alerting into the micro-service environment?
Cisco Secure Cloud Analytics (SCA) detects early indicators of compromise within the cluster, including insider threat activity and malware. SCA consumes telemetry and logs to find abnormal behavior or signs of malicious activity and triggers alerts so you can investigate quickly.
We deploy SCA into the Kubernetes cluster using a DaemonSet. A DaemonSet ensures that all (or some) worker nodes run a copy of a pod. As worker nodes are added to the cluster, pods are added to them. As worker nodes are removed from the cluster, those pods are garbage collected. We will be deploying our SCA DaemonSet using Terraform within our Jenkins pipleline.
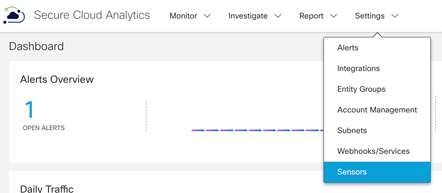
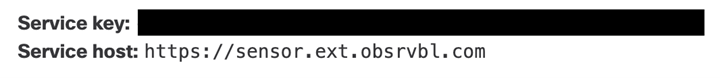
First, we need to get the service key from the Cisco Secure Cloud Analytics portal. From the dashboard, go to Setting > Sensors.
Scroll down to the bottom of the page and copy/save the Service key.
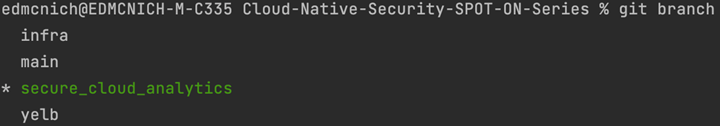
Let’s go back to our code. First, we add new branch called secure_cloud_analytics to our repository.
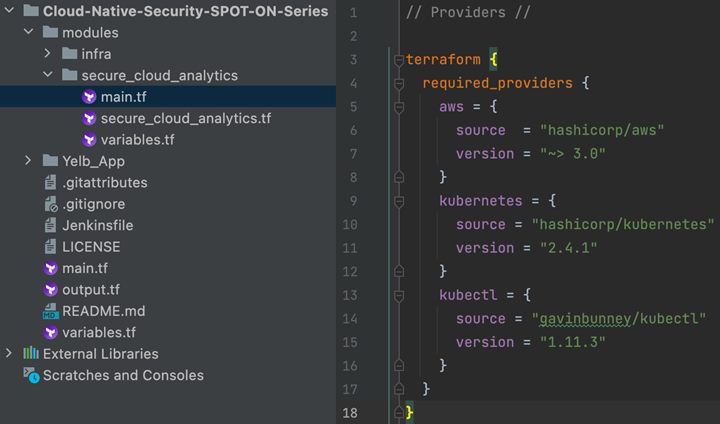
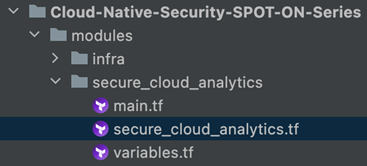
We add a new module called secure_cloud_analytics. In the main.tf file we set the required providers needed for the module.
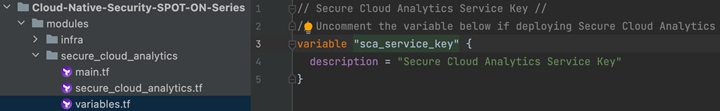
We also create a variables.tf file that will reference the Cisco Secure Cloud Analytics Service Key. We will pass this secure variable from Jenkins.
Then we have the secure_cloud_analytics.tf file which will create the Kubernetes Secret, Service Account, Cluster Role Binding and the SCA DaemonSet.
Check out the full file HERE.
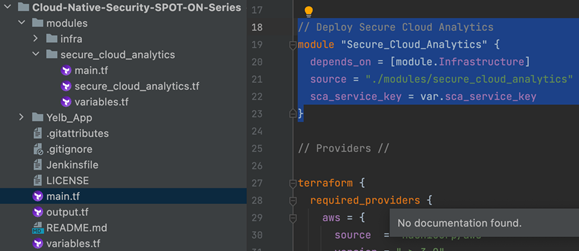
In the root module main.tf file we add the Secure Cloud Analytics module configuration.
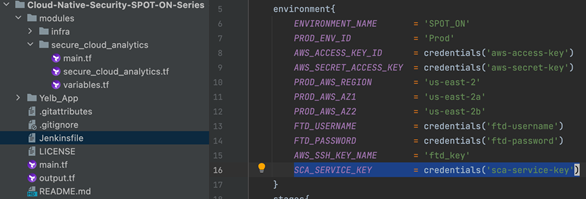
Finally, we add the SCA Service Key to our Jenkinsfile environment variables.
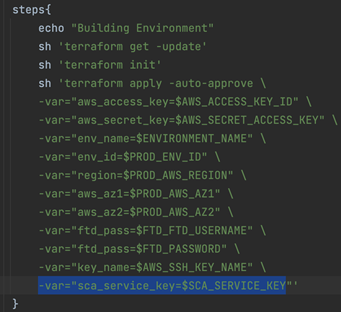
Then pass the variable to the Terraform Apply in the Jenkinsfile build stage.
Now it is time to commit our changes to the secure_cloud_analytics branch and create a pull request to the main branch.
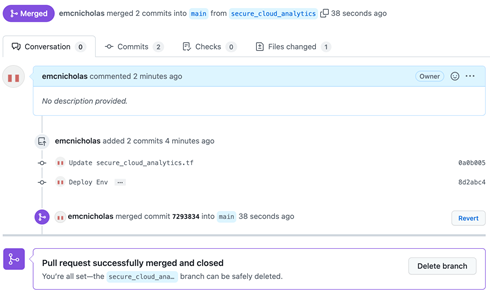
Once the merge has been completed it will trigger a build job in Jenkins.
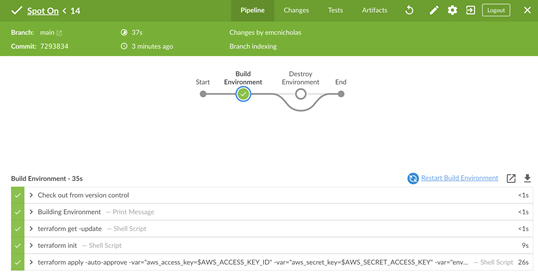
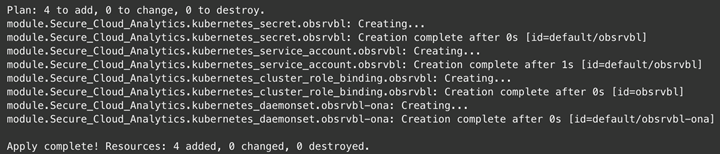
If we look at the Terraform apply, we see that the SCA resources have been created.
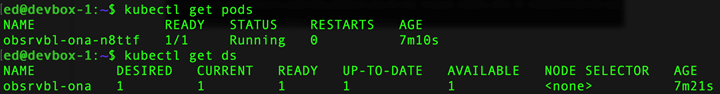
Using kubectl, we can see the SCA pods and daemonset running in our Kubernetes Cluster.
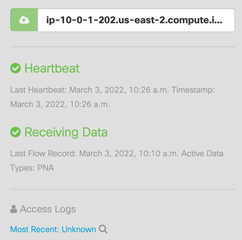
Go back to the Cisco Secure Cloud Analytics portal and select Settings > Sensor again. There will be a sensor with the name of the AWS EC2 instance of our worker node.
Now that we have a micro-services app and Cisco Secure Cloud Analytics is installed and monitoring in our Kubernetes cluster, it is time to generate some traffic and show the value and visibility that SCA provides in a cloud native environment.
First let’s generate some traffic using Locust. Locust is an easy to use, scriptable and scalable performance testing tool. In the repo there is a directory named Locust with a python file named locustfile.py. Locust is written in Python and can be installed by running pip3 install locust. Instructions can be found HERE.
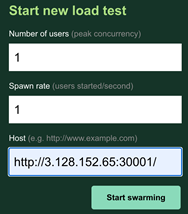
Run Locust locally from your IDE or terminal. This program will run on port 8089 on your localhost.
![]()
Go to http://0.0.0.0:8089 and start a new load test to the public IP address and port of the Yelb App.
Go to the web interface of your Yelb app and make sure the votes are incrementing.
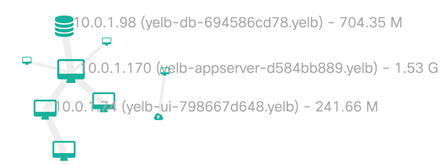
Here is a diagram of the Yelb app. We see that the UI is running on port 80 (mapped to port 30001 on the worker node), the app server on port 4567, the database on port 5432, and cache on port 6379.

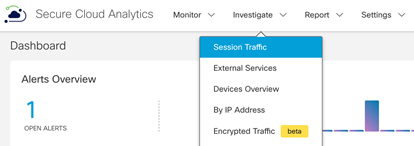
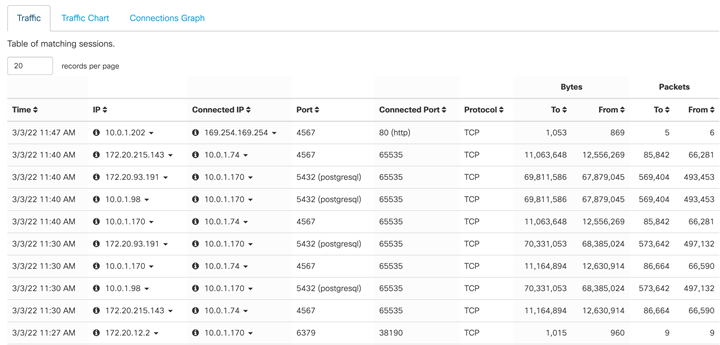
Let’s look at what visibility SCA provides. From the Cisco Secure Cloud Analytics dashboard let select Investigate > Session Traffic.
In the Session Traffic filter add the ports of all the Yelb micro-services (4567, 5432, and 6379) and select Update. We will see all the traffic flow within the Yelb app.
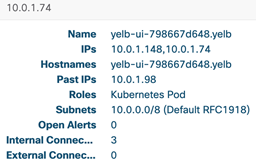
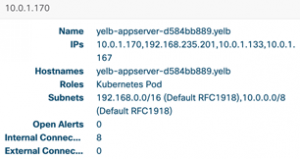
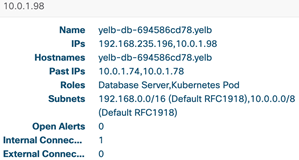
If we dive a little deeper into each IP address, we will see more information about the Kubernetes Pod such as pod hostname, past IP addresses, roles, and the number of internal and external connections.
If we select the Connections Graph, it will map out the application and its services.
Now let’s generate some security alerts. We are going to use a tool called Netshoot to run some internal scans and try to move laterally within the cluster. From our Devbox we run kubectl run tmp-shell –rm -i –tty –image nicolaka/netshoot — /bin/bash. This will spin up a pod named tmp-shell in the default namespace of the cluster and drop us into an interactive shell. Netshoot comes packed with a bunch of troubleshooting tools, but we are going to use the NMAP tool to generate some abnormal behavior.
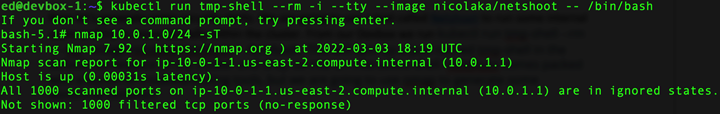
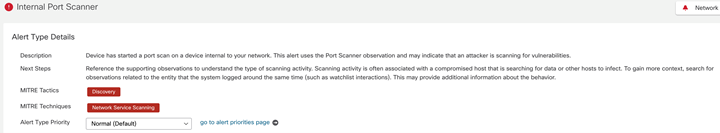
First, we do some recognizance by running a port scan inside the cluster (nmap 10.0.1.0/24 -sT). This generates an Internal Port Scanner Alert in Secure Cloud Analytics.
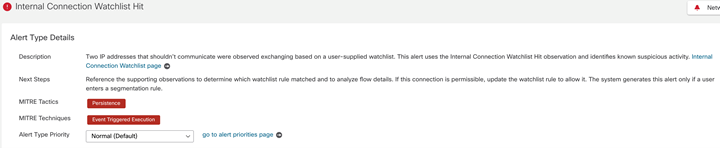
In the SCA portal, if we go to Monitor > Alerts, we see the alert shows a description, next steps, and what MITRE tactics and techniques are being used.
There are over 120 alerts enabled out of the box, and you can create your own custom watchlists.
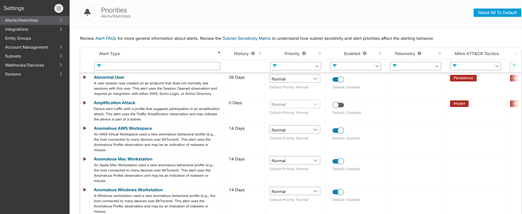
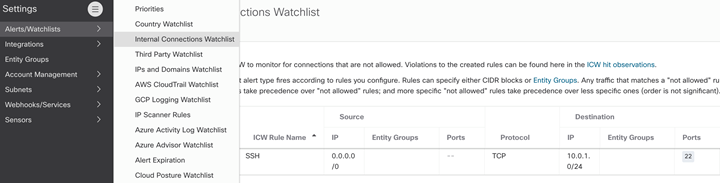
For example, if you go to Settings > Alerts/Watchlists > Internal Connections Watchlist, we have created a watchlist that will alert us anytime an SSH connection is made to any host inside the cluster.
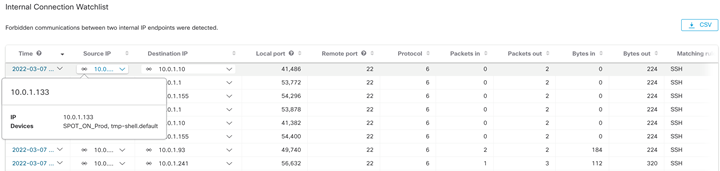
If we run another Nmap from the Netshoot pod to SSH to all hosts on the cluster network (nmap 10.0.1.0/24 -p22), we will get an Internal Connection Watchlist alert.
This concludes the detailed instructions! Please let me know if you have any questions in the comments section below, or via the GitHub issues. In the next episode of this series, we will discuss Cloud Workload Protection Platform (CWPP) and how we deploy and use CWPP in our cloud native environment. Hope to see you then!
We’d love to hear what you think. Ask a question or leave a comment below.
And stay connected with Cisco DevNet on social!
LinkedIn | Twitter @CiscoDevNet | Facebook | Developer Video Channel


