
 With the World Cup games recently finished, I’m reminded of how rampantly soccer has swept across the U.S. in the last few years. Kids often start quite young — there are leagues for even five and six year olds! One element that helps younger kids enjoy their first soccer experience is that the balls are sized smaller in line with their height, making it easier for them to kick and control the ball. It’s an everyday example of how there can be better results when a tool is well matched with “entry-level” requirements.
Deploying an entry-level desktop virtualization solution follows similar logic. For a deployment to be successful, there must be a balance between the solution, its cost, and its ease of implementation, especially when the number of users is small. For large corporate environments with a few thousand users, it’s much easier to defray CAPEX costs across a large number of users, realize a low cost-per-seat, and rely on IT administrative staff to deploy and manage the solution. For smaller environments like branch offices or SMBs, deploying and managing a comprehensive desktop virtualization solution has generally been too complex and cost-prohibitive — until now.
Cisco and Citrix have collaborated on a new reference architecture that removes the barriers to smaller deployments, making it easy to deliver Microsoft Windows apps and desktops to a variety of client and mobile devices. Based on Cisco and Citrix technologies, the architecture creates a self-contained, easy-to-deploy, and centrally managed solution that supports 500 seats cost-effectively. This is a new Cisco and Citrix solution designed for fault-tolerant deployments of less than 1000 users, opening the door to new desktop virtualization opportunities in branch offices, SMBs, pilot projects, and test and development environments.
Citrix and Cisco test engineers validated the reference architecture and conducted a series of sizing tests using Login VSI. The testing demonstrated how the architecture can support up to 500 Medium/Knowledge Workers or 600 Light/Task Workers while delivering an outstanding end user experience. This blog gives a brief synopsis of the architecture, its benefits, the testing we conducted, and the test results. For more details, you can read the full reference architecture paper and test report here.
Architectural Overview
Figure 1 shows key solution components. Three Cisco UCS C240 M3 Rack Servers combine industry-standard, x86 servers with networking and storage access into a single converged system. The C-Series servers are part of the Cisco Unified Computing System (UCS) family of products. They have a compact 2RU form factor and use the same stateless, streamlined provisioning and operations model as Cisco UCS B-Series Blade Servers. Cisco UCS 6248UP 48-Port Fabric Interconnects supply 10-GigabitEthernet, Cisco Data Center Ethernet, Fibre Channel, and FCoE connectivity needed for the solution.
Figure 1. 500-User Architecture for Citrix XenApp 7.5 on Cisco UCS C240 M3 Rack Servers
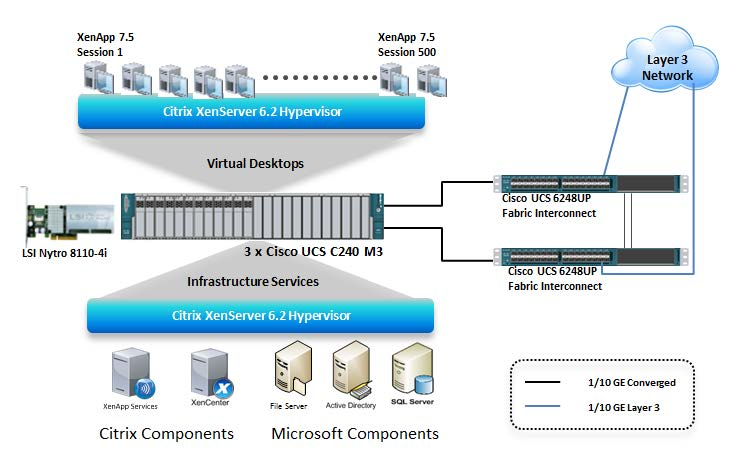
The Citrix XenApp 7.5 release delivers a Windows OS and applications to mobile devices (including laptops, tablets, and smartphones) with a native-touch experience and high performance. In this architecture, the XenApp software delivers 500 Hosted Shared Desktop (HSD) sessions using Remote Desktop Services (RDS). Citrix XenServer 6.2 is the hypervisor that supports virtual machines (VMs) running Microsoft Windows 2012 Server for XenApp and infrastructure services.
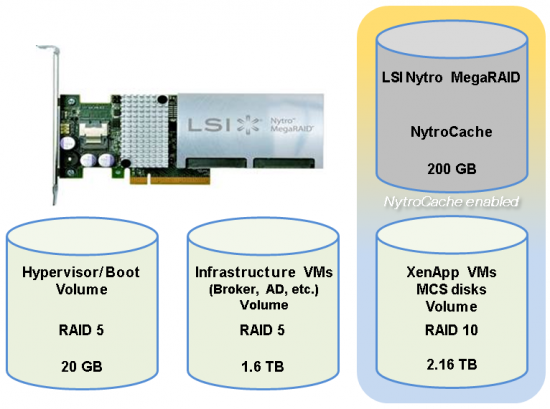
Using local storage is essential to achieving an entry-level price point. To make that possible with just twelve 10,000RPM SAS drives, each server includes an LSI Nytro MegaRAID card containing two 100GB flash memory cards for caching I/O operations. Using the LSI Nytro flash cache in conjunction with local storage is a key differentiator for this solution, allowing it to deliver responsive performance while conserving cost.
Why the Buzz?
The reference architecture is an exciting breakthrough for these reasons:
- Self-contained, all-in-one solution. The architecture defines an entirely self-contained “in-a-box” solution with all of the infrastructure elements required for a XenApp 7.5 deployment, including Active Directory, DNS, SQL Server, and more. This takes the complexity out of deploying a desktop virtualization solution especially for small standalone environments.
- Fault-tolerant architecture. The architecture locates redundant infrastructure virtual machines across two Cisco UCS C-Series servers to optimize availability. The solution also configures N+1 XenApp servers to maintain service levels even if a XenApp server failure occurs. In addition, Microsoft Distributed File System services are used across multiple servers to protect user data on local storage.
- Easy to build, deploy, grow, and maintain. The compact design of Cisco UCS C-Series Rack Servers keeps the footprint small, making the solution easy to deploy in a small business or branch office setting. Since the C-Series servers are part of the Cisco UCS product family, they can be managed as standalone systems or alongside existing blade and rack servers using Cisco UCS Manager.
By adding Cisco UCS Central Software to the solution, companies can extend Cisco UCS Manager capabilities, allowing administrators to manage multiple Cisco UCS domains (such as domains for satellite offices) in conjunction with centrally defined policies. Both the C-Series Rack Servers and B-Series Blade Servers can be managed using the same set of management tools.
- Low cost per seat. The architecture avoids expensive flash drives, instead caching IOPs in flash memory on the LSI Nytro cards. The choice of less expensive SAS drives helps to rein in solution costs while providing excellent end user experience.
Test Configuration
Figure 2 shows the virtual machines deployed across the three physical servers in the test configuration. Infrastructure VMs were hosted on two of the Cisco UCS C240 M3 Servers, and each server also hosted eight XenApp 7.5 HSD VMs. The redundancy across physical servers yields a highly available design.
Figure 2. Test Configuration
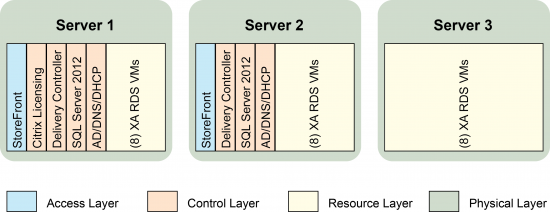
Table 1 lists specific components in the test configuration.
|
Hardware components |
Software components |
| 3 x Cisco UCS C240-M3 Rack Servers (dual Intel Xeon E5-2697v2 Processors @ 2.7 GHz, 256GB of memory, one Cisco VIC1225 network adapter) | Cisco UCS Manager 2.2(1d) |
| 1 x LSI Nytro MegaRAID Controller NMR 8110-4i card per server | Citrix XenApp 7.5 |
| 12 x 600-GB 10,000 RPM hot-swappable hard disk drives | XenServer 6.2 Hypervisors and XenCenter 6.2 |
| 2 x Cisco 6248UP 48-port Fabric Interconnects | Microsoft Windows Server 2012 R2, 64-bit Remote Desktop Services (5vCPU, 24GB of memory per VM) |
Local storage was organized into drive groups to create RAID 5 and 10 volumes for the hypervisor, infrastructure services, and XenApp VMs. The XenApp 7.5 VMs were provisioned with Machine Creation Service (MCS) differencing disks. MCS differencing disks are virtual hard disks that store desktop changes during Hosted Shared Desktop sessions and they incur a high number of IOPS. The LSI Nytro cards are specifically configured to accelerate IOPs for the I/O-intensive volumes that contain the MCS differencing disks.
Test Methodology
To generate load, we used the Login VSI 3.7 software to simulate multiple users accessing the XenApp 7.5 environment and executing a typical end user workflow. Login VSI 3.7 tracks user experience statistics, looping through specific operations and measuring response times at regular intervals. Collected response times determine VSImax, the maximum number of users the test environment can support before performance degrades consistently. Because baseline response times can vary depending on the virtualization technology used, using a dynamically calculated threshold provides greater accuracy for cross-vendor comparisons. For this reason, Login VSI also reports VSImax Dynamic.
At the start of the testing, we executed performance monitoring scripts to record resource consumption for the hypervisor, virtual desktop, storage, and load generation software. At the beginning of each test run, we took the desktops out of maintenance mode, started the virtual machines, and waited for them to register. The Login VSI launchers then initiated the desktop sessions and began user logins (the ramp-up phase). Once all users were logged in, the steady state portion of the test began in which Login VSI executed the application workload, running applications like Microsoft Office, Internet Explorer (including a Flash video applet), printing, and Adobe Acrobat Reader.
The testing captured resource metrics during the entire workload lifecycle — XenApp virtual machine boot, user logon and desktop acquisition (ramp-up), user workload execution (steady state), and user logoff. Each test cycle was not considered passing unless all test users completed the ramp-up and steady state phases and all metrics were within permissible thresholds.
Test Results
Two test phases were conducted:
- Finding the recommended maximum density for a single physical server. This phase validated single-server scalability under a maximum recommended density with the RDS load. The maximum recommended load for a single server occurs when CPU or memory utilization peaks at 90-95% and the end user response times remain below 4000ms. This phase was used to determine the server N+1 count for the solution.
- Validating the solution at full scale. This phase validated multiple server scalability using the full test configuration.
The first phase was executed under the Login VSI Medium workload and then the Light workload to identify VSImax for each workload type. The validation phase was executed using the Medium workload only.
Phase 1: Single Server Recommended Maximum Density
We first tested different combinations of XenApp 7.5 server VMs and virtual CPU (vCPU) combinations, finding that the best performance was achieved when the number of vCPUs assigned to the VMs did not exceed the number of hyper-threaded cores available on the server. (In other words, not overcommitting CPU resources provides the best user experience.) For the Intel E5-2697v2 processors, 24 cores with hyper-threading equates to 48 vCPUs. The highest density was observed at eight XenApp VMs per physical server, with each VM configured with five vCPUs and 24GB RAM.
The first test sequence determined VSImax for each workload on a single server, indicating the density that a single server can support before the end user experience degrades. Based on this value, we added one additional server to the total number of physical servers needed so that the full-scale configuration achieves optimal performance under normal operating conditions and enable N+1 server fault tolerance.
Medium Workload: Single Server Recommended Maximum Density
For the single server Medium Workload, guided by VSImax scores, we determined that 250 user sessions per host gave us optimal end user experience and good resource utilization. Figures 3 and 4 show end user response times and CPU utilization metrics for the Medium workload.
Figure 3. Single Server, Medium Workload, End User Response Times at 250 Sessions
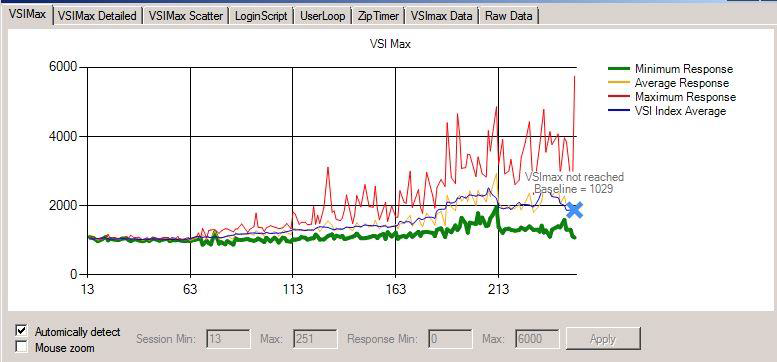
Figure 4. Single Server, Medium Workload, CPU Utilization
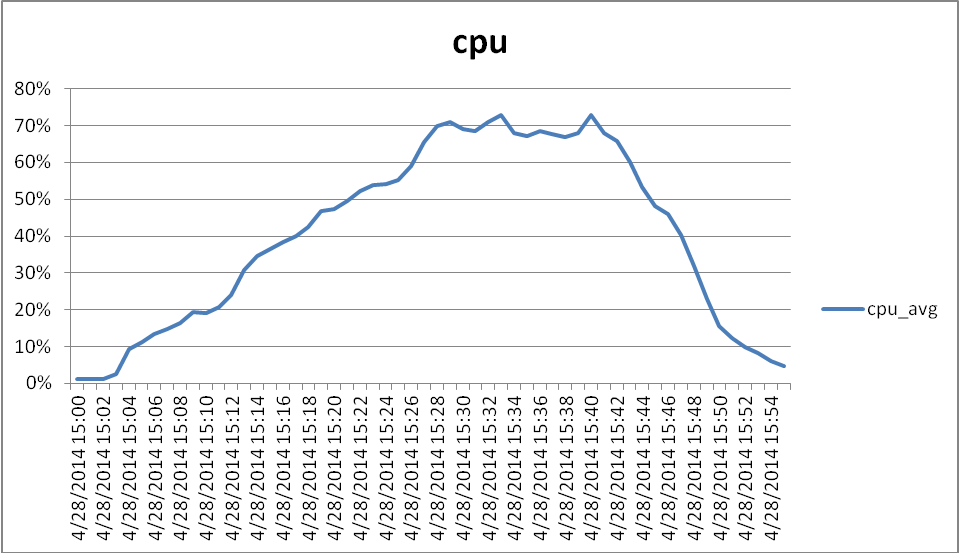
Light Workload: Single Server Recommended Maximum Density
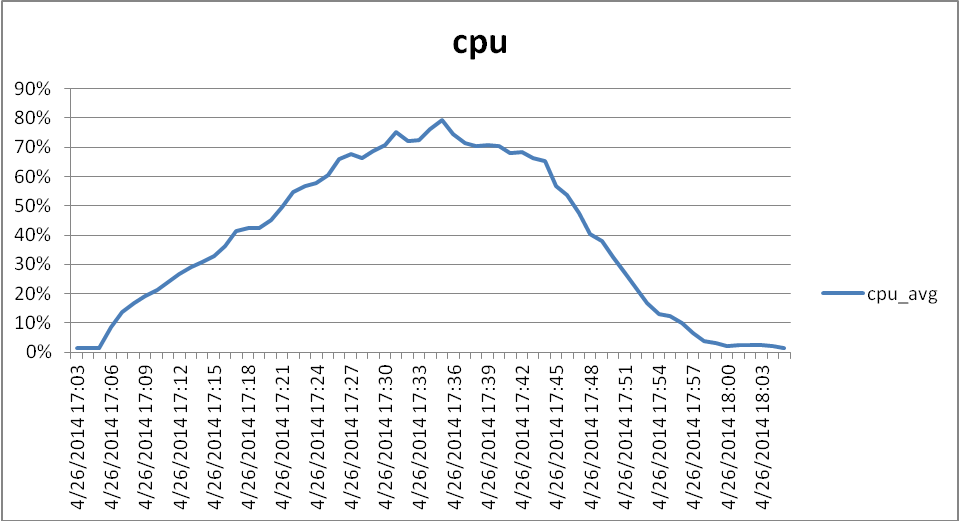
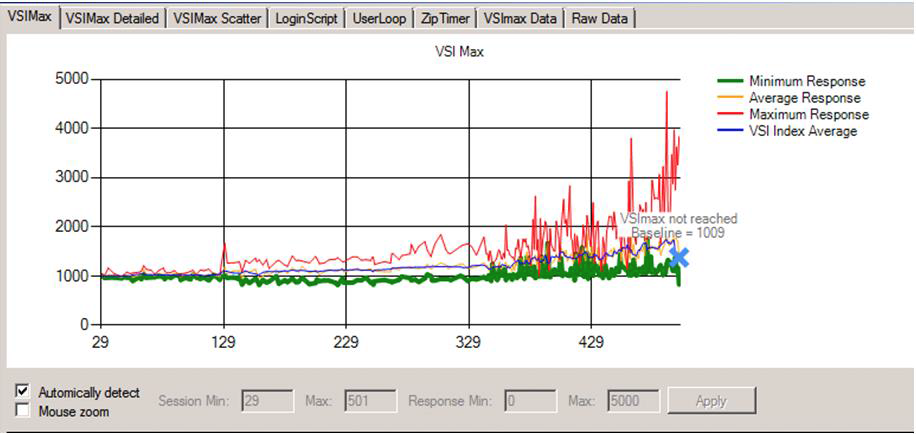
For the single server Light Workload, we determined that 325 user sessions per host gave us optimal end user experience and good server utilization metrics. Figures 5 and 6 show end user response times and CPU utilization metrics for the Light workload.
Figure 5. Single Server, Light Workload, End User Response Times at 325 Sessions
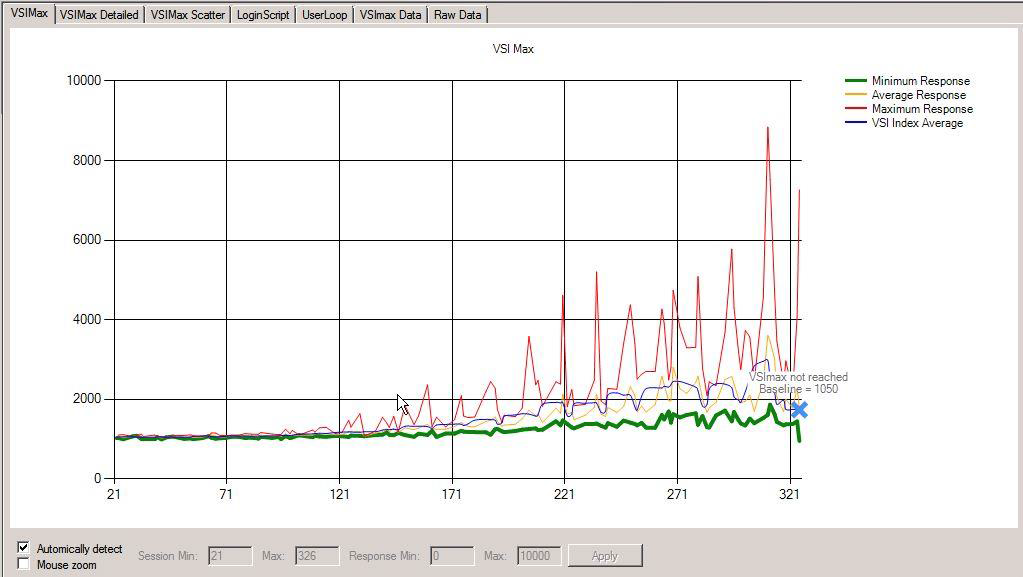
Figure 6. Single Server, Light Workload, CPU Utilization
Phase 2: Full-Scale Configuration Testing
Using all three Cisco UCS C240 M3 Rack Servers, we performed 500-session Login VSI Medium Workload tests to validate the solution at scale, which provided excellent results. The Login VSI Index Average and Average Response times tracked well below 2 seconds throughout the run (Figure 7), indicating an outstanding end user experience throughout the test.
Figure 7. Full-Scale Configuration, Medium Workload, End User Response Times at 500 Sessions
Figures 8 through 13 show performance data for one of the three Cisco UCS C240 M3 servers in the full configuration test. The graphs are representative of data collected for all servers in the three-server test.
Figure 8. Full-Scale Configuration, Medium Workload, CPU Utilization
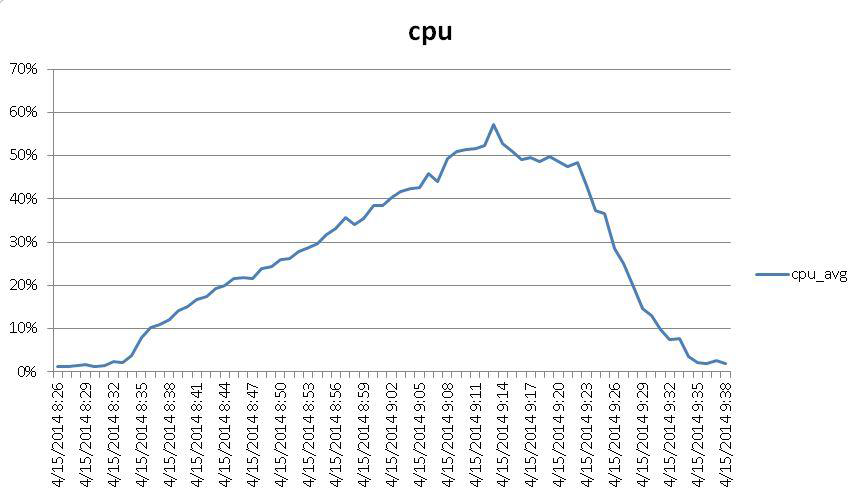
Figure 9. Full-Scale Configuration, Medium Workload, IOPS
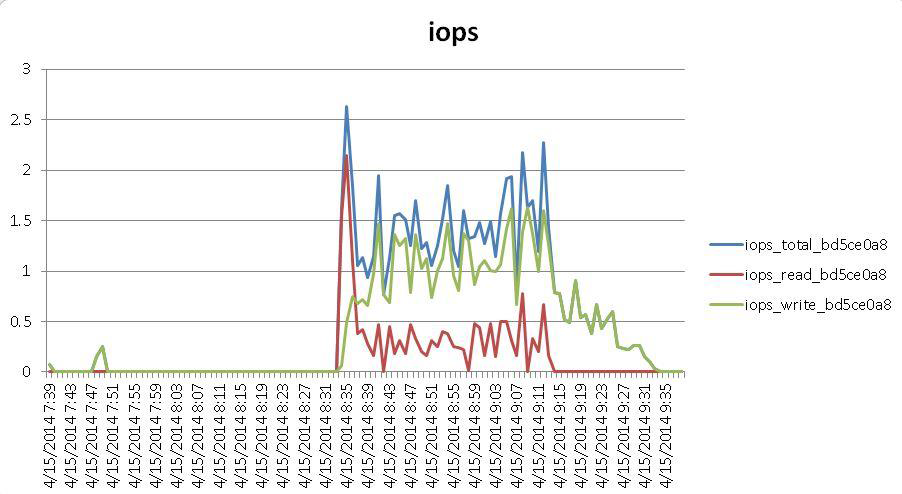
Figure 10. Full-Scale Configuration, Medium Workload, IO Throughput (Mbps)
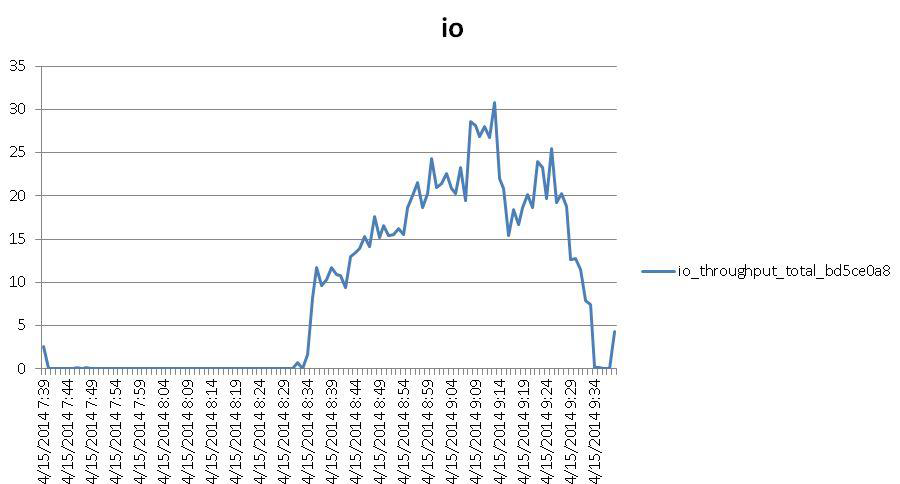
Figure 11. Full-Scale Configuration, Medium Workload, IO Wait
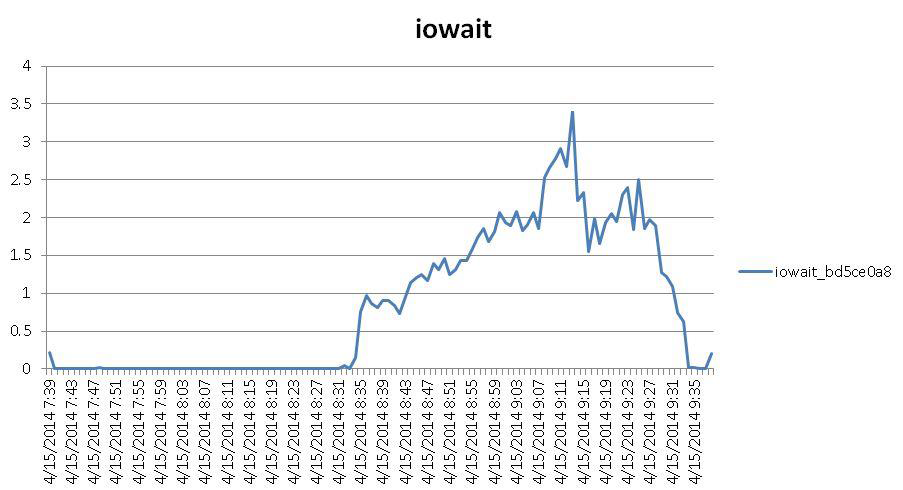
Figure 12. Full-Scale Configuration, Medium Workload, IO Latency

Figure 13. Full-Scale Configuration, Medium Workload, IO Ave. Queue Length

What about XenDesktop?
Given the same hardware configuration, are you curious how well XenDesktop with Windows 7 virtual desktops perform? Or, perhaps, a 500-seat deployment is initially too much and you just want to “kick some tires” with a single UCS server. In either case, here’s a 200-seat XenDesktop reference architecture that provides the same server specifications and configuration as the 500-seat XenApp configuration discussed above: Deploy 200 Citrix XenDesktop 7.1 Hosted Virtual Desktops on Cisco UCS C240 M3 Rack Server with LSI Nytro MegaRAID and SAS Drives.
Conclusion
Desktop virtualization is an efficient way to deliver the latest Microsoft Windows OS and applications not only to traditional client PCs, but also to the user’s choice of mobile device types. At the same time, desktop virtualization centralizes and protects corporate data and intellectual property, simplifying desktop and OS management. Until now, it’s been difficult for small to medium-sized organizations to realize these advantages because of the complexity and up-front costs associated with building out a pilot or entry-level configuration.
Because this low-cost configuration enables a 100% self-contained solution, it overcomes previous obstacles to deploying desktop virtualization in small business or branch office settings. The architecture provides an extremely easy-to-deploy, fault tolerant, Cisco UCS-managed infrastructure for Citrix XenApp 7.5 hosted shared desktops. For many, the solution greatly simplifies the entry point into desktop virtualization, making it easier to build out and manage a 500-seat standalone deployment.
To read more about the 500-seat XenApp 7.5 reference architecture and the validation testing, see the full white paper: Reference Architecture for 500-Seat Citrix XenApp 7.5 Deployment on Cisco UCS C240-M3 Rack Servers with On-Board SAS Storage and LSI Nytro MegaRAID Controller.
— Frank Anderson, Senior Solutions Architect, Cisco Systems, Inc.


Nice work Frank.