
Welcome to a tour of Cisco’s Social Media Listening Center!
Welcome to the Social Media Listening Center (SMLC). We’ve developed this exhibit to show our commitment to the voice of the customer. By being present in the social web the minute we find a conversation about Cisco, or someone in need of customer support, our social media listening center allows Cisco to drive to action.
Contents
Cisco Live!
Global Conversations
Social Media Influencers
Industry Landscape
Social Media Scoreboard
Word Cloud
The Purpose of our Listening Center
There are several reasons for creating the listening center. They are:
- To promote Cisco’s commitment to social media and gain valuable insights from the perspective of the customer
- To demonstrate that we are leveraging Cisco’s industry leadership and innovation to drive a standard of social media listening and engagement across our organization
- To show how Cisco is using our own technology to power the display
- The Cisco Technology
Cisco Interactive Services Platform: It is a combination of hardware and software that allows the display to be centrally configured and manged via the cloud.
Cisco SocialMiner: It is an offering within our Contact Center solution that enables customers to monitor, engage, and gather call center metrics within the social channels.
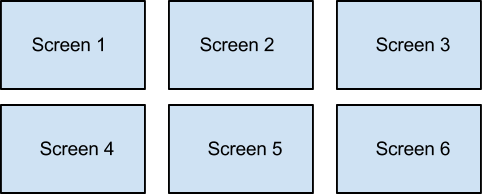
The Screen Arrangement
The screens are numbered as shown in the graphic. These screen numbers will be referenced in the demonstrations that follow.
Cisco Live! (Screen #1)
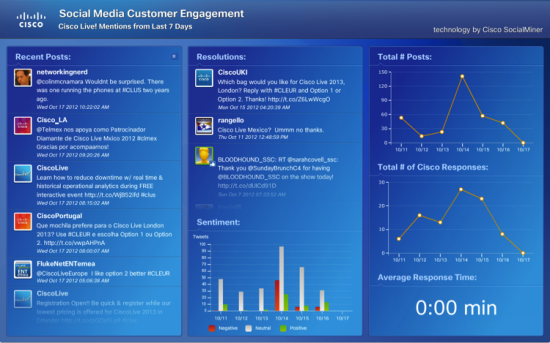
This screen displays data focused on social media mentions specific to the Cisco Live! events. The data is provided by our own Cisco SocialMiner product. Cisco SocialMiner is used by the Cisco Live! team to monitor mentions during the event and engage with attendees.
Column 1 (left column): displays all Twitter posts from attendees and virtual attendees using the Cisco Live! related hashtags, including “#clus”, “#cleur”, and “#clmel”.
Column 2 (middle column): displays interactions between posters and Cisco social properties (including @CiscoLive!).
Column 3 (right column): displays various metrics, including: total number of posts, total number of Cisco responses, and average response time from Cisco to a question posed by a poster.
Data source: Twitter
back to Contents
Global Conversations (Screen #2)
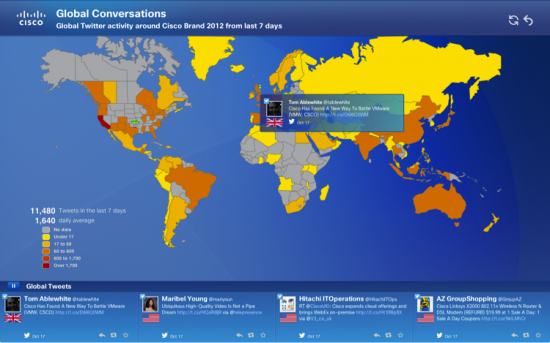
This screen displays where Cisco Twitter conversations are happening, globally. This includes all mentions of Cisco products, brands, properties and trademarks.
This is a Twitter-based heat map. The legend in the lower left corner of the screen identifies the approximate volume of conversations (or mentions) associated with each color. The top most color (gray) has no data. The bottom most color (deep red) has the most data.
Concentric circles denote new tweets in that location. Random posts are highlighted continuously. The bottom ticker bar streams the most current posts. It streams posts from around the globe by default. You can also filter by a particular region.
To filter by a region:
- click on a region (e.g. Australia), a pop-up menu appears
- click on “Filter by Australia”
Australia specific posts now appear in the ticker bar
To remove region filter:
- click on currently filtered region (e.g. Australia), a pop-up menu appears
- click on “Remove Filter”
The ticker bar stream can also be paused at any point. Simply click on the pause icon. click again to resume the stream.
Green pins on the maps denote the most recent tweets at that location. The number of pins ranges from one to three. One pin has the fewest tweets. Three pins has the most tweets. You can view these posts by clicking on the pins. The tweets will appear in a pop-up. To close the pop-up, click on the X icon.
Data source: Twitter
back to Contents
Social Media Influencers (Screen #3)
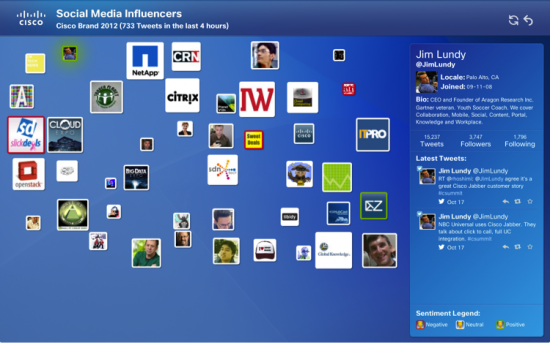
This screen displays who is talking about Cisco the most on Twitter. We define influencer as being a person with the most Twitter followers.
The left (larger) portion of the screen shows the profile pictures of the influencers. The right (smaller) portion of the screen shows the profile details of each influencer, one at a time, in the panel.
The screen automatically scrolls through each proifile by default. You may select a particular profile to view manually. Simply click on a profile picture on the left and the profile details will be shown on the right. To re-activate the automatic scrolling, click on the play icon in the upper right corner of the panel.
Sentiment is automatically being identified by our system. Notice the sentiment legend in the lower right corner of the screen. A red border around a profile picture denotes negative sentiment. White denotes neutral sentiment. Green denotes positive sentiment.
Data source: Twitter
back to Contents
Industry Landscape (Screen #4)
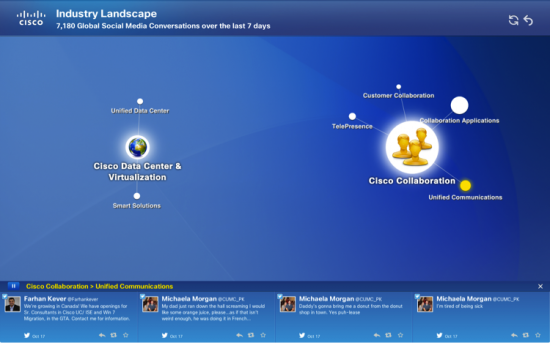
This screen displays conversations surrounding our Cisco Product Families. Up to three product families (or clusters) can be shown on the screen.
Data for this screen comes from multiple sources, including: Twitter, Facebook, blogs, news, forums, and more. You can think of each cluster as a solar system. The sun represents the category of the conversations (e.g. Cisco Collaboration). The planets surrounding the sun represent the various groups of Cisco products related to the category.
Click on a planet to view mentions about a specific Cisco product family. A stream of posts will appear in a ticker bar at the bottom of the screen. You may pause the stream by clicking on the pause icon in the upper left corner of the ticker bar. Click the pause button again to let it play. To remove the ticker bar, click on the X icon in the upper right corner of the ticker bar.
Every so often, you may seen concentric circles appear on some of the product families (planets). These denote the most recent posts involving that product family with regard to the associciated category (sun).
Data source: Twitter, Facebook, blogs, news, forums, and more.
back to Contents
Social Media Scoreboard (Screen #5)
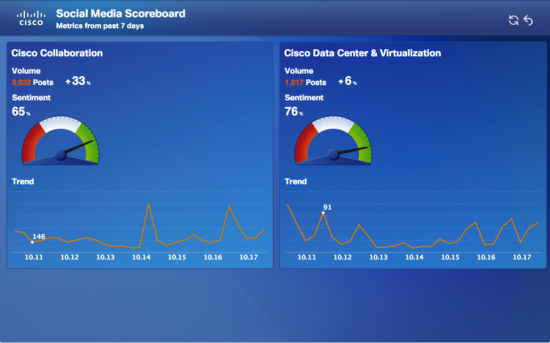
This screen elaborates on the data shown in the Industry Landscape screen. It displays two main product family categories: Cisco Collaboration and Cisco Data Center & Virtualization. Data for this screen comes from multiple sources, including: Twitter, Facebook, blogs, news, forums, and more.
There are three main parts to this screen:
- Sentiment: The gauge displays the overall sentiment of the posts.
- Share of Voice: The pie chart displays the percentage of mentions that each product family contributes, within the related product category.
- Trend Line: The graph at the bottom of the screen displays the change in volume of conversations over the given time period (seven days).
Data source: Twitter, Facebook, blogs, news, forums, and more.
back to Contents
Social Media Word Cloud (Screen #6)
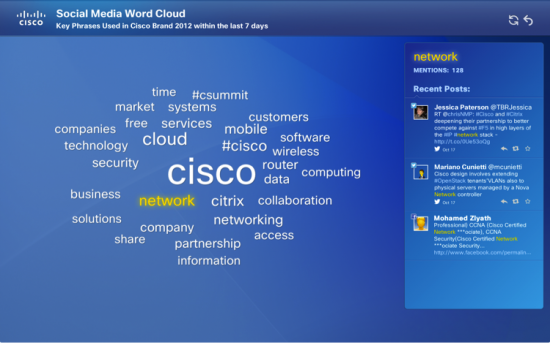
This screen displays the most common words, or what the conversations are about.
The screen automatically highlights each word in yellow, one at a time, and displays posts that include the word in the right panel. You can manually select a word by clicking on any word in the cloud. To reset automatic play mode, click on the play icon at the top right corner of the panel.
Data source: Twitter, Facebook, blogs, news, forums, and more.
back to Contents
Thank you!
We’d like to thank the following Social Media Listening contributors for collaboratively building this guide: Davythe Dicochea http://twitter.com/@davythe, Nancy Rivas http://blogs.cisco.com/author/nancyrivas, Bernadette Koscielniak http://blogs.cisco.com/author/bernadettekoscielniak, George Metrik http://blogs.cisco.com/author/georgemetrik, Michael Hopps http://blogs.cisco.com/author/michaelhopps, and Charlie Treadwell http://blogs.cisco.com/author/charlietreadwell.


