
This post was authored by Jan Kohout, Veronica Valeros and Petr Somol.
Increasing adoption of encryption in web communication significantly contributes to protection of users’ privacy. However, it also brings tough challenges for intrusion detection systems that need to analyze the traffic without actually decrypting it. There is not much information left in encrypted web traffic logs that could be leveraged for malicious activity detection. Information about visited URL, user agent used and other important fields are no longer available. If users’ privacy is to be preserved, a detection system has to rely only on very high-level information. Clearly, simple rule-based solutions can hardly achieve satisfying accuracy in such environment.

However, the situation changes when machine learning algorithms and smart representations of gathered information are called up for duty.
Cisco Cognitive Threat Analytics leverages machine learning to identify malicious behavior even in encrypted traffic. In this blog post, we demonstrate on real-world examples, that even very basic features of communication – just the sizes and timings of transferred information – can bear a lot of useful information if we correlate the observations in the right way. Imagine putting together a complex puzzle: from just one piece of puzzle with few colored dots, one can not say what the final picture is, but when many of those pieces are put together, then the final image appears clearly. Similarly, by observing sizes and timings of communication between two computers, we can have a clear view of the communication patterns.

Fight Infections with Connection Fingerprints
The challenge we face is how to differentiate encrypted malicious traffic over HTTPs from benign communication, when the only source of data is a log from web proxy. The roots of success of our methods are in putting many small pieces of information together. If we repeatedly observe simple behavioral characteristics of some object (e.g., a web server or a communication session) for a certain period of time, we will collect enough information to discover the behavioral pattern which is typical for the given object. We see this problem of information gathering as the problem of capturing probability distributions based on limited number of observations. We work with so called fingerprints of connections, formed by histograms capturing properties of the communication. The communication belonging to one server is treated as determined by some unknown probability distribution over the observed quantities. Each observation – for example, quantities extracted from one request-response pair to the given web server – is treated as one realization of that probability distribution. Under this setting, the server can be represented by a histogram which models the unknown probability distribution by capturing frequencies of the observed values. On top of the histograms, it is easy to train a classifier for some specific malicious behavior or use unsupervised techniques such as clustering to discover new behavioral patterns. In the following examples, you will see that with the help connections fingerprinting, CTA is capable of:
- training a classifier which detects data exfiltrations
- finding a structure of an unknown service to improve detection of its misuses
- linking together servers contacted by similar malware
Detection of data exfiltration
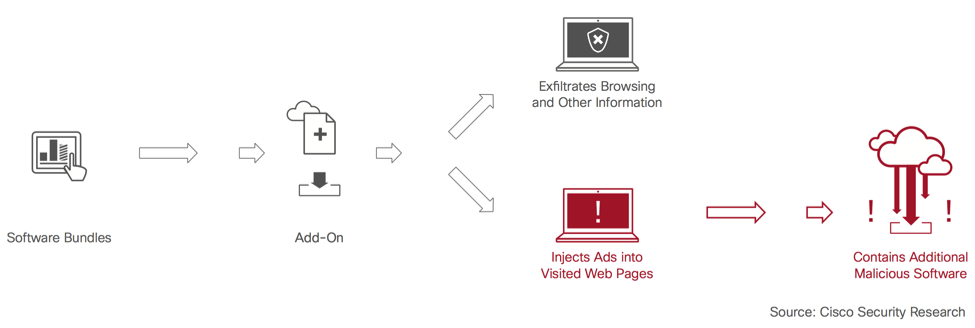
In Cognitive Threat Analytics, the connections fingerprinting and a classifier trained on top the fingerprints are used to detect possible exfiltrations of data via encrypted connections, as shown in Figure 1 (see the related blog here). With this representation, the only features extracted from web traffic logs by the classifier are the timings and sizes of the connections. In this way it is able to identify suspicious exfiltrations without relying on any features that would be hidden by TLS encryption.
Sub-Service Identification
Understanding the structure of a service helps to model users’ behavior more accurately and, thus, significantly increases our chance to detect anomalies and misuses. The modeling of probability distributions can be successfully used to discover functional parts of a complex but possibly unknown web service, such as on-line file storage or even more complex cloud platforms. This decomposition can be done even if the target service is accessed via encrypted connections, because – as we showed in the previous example – the fingerprinting technique can work even with very basic features that can be extracted even from encrypted traffic without decryption.
As an example, we show how the servers under the dropbox.com top level domain can be clustered into groups that represent individual functional parts of the Dropbox service. We observed the behavior of totally 188 servers for a couple of days and created their fingerprints capturing frequencies of the observed values. As most of the servers are accessed by HTTPs, the only observed quantities were:
- Bytes sent in one request
- Bytes received in the corresponding response
- Duration of the request-response loop
- Inter-arrival time between two consecutive requests from the same client
After the fingerprints of servers were created, they were clustered according to their pairwise similarities. The result of the clustering can be seen in Figure 4 below in a form of a similarity graph:
![Figure 4 - Clustering of servers under the dropbox.com TLD visualized by a similarity graph. Each node of the graph represents one server, the servers with similar fingerprints are close to each other while servers with dissimilar fingerprints are repulsed. Colors mark different clusters discovered be a clustering algorithm which uses the fingerprints' similarities (grey color marks unclustered servers - 9 out of 188 - that are not members of some dedicated sub-service). Clusters are annotated with the type of service they provide (the annotations were obtained from the work [4]).](https://blogs.cisco.com/gcs/ciscoblogs/1/cta4.png)
Relationship Modeling for Malicious Campaign Discovery
Relationship modeling is the topmost layer of data processing in Cognitive Threat Analytics which correlates information from detected incidents to discover new threat campaigns (see this blog). Relationship modeling in CTA uses the fingerprinting technique to find malicious servers that are contacted by the same family of malware. Malware typically uses multiple servers for its C&C communication. If not all of them are blacklisted (often they won’t be), the malware is still able to contact the C&C server on the remaining ones. Our method of fingerprinting can help to find those additional servers. Malware usually uses the same communication protocol to contact the C&C servers. Therefore, their histogram fingerprints will be very similar to each other due to the similar patterns in the communication. The C&C servers used by the same malware can be thus viewed as members of one specific sub-service on the Internet. If we apply the clustering algorithm on a set servers’ fingerprints in which we include also fingerprints of known malicious servers, the new malicious ones can be easily discovered by looking at those which belong to clusters containing the known malicious ones. Together with other algorithms, the fingerprinting of servers helps CTA to extend the list of confirmed infections.
How Does Building of Fingerprints Work?
As we mentioned earlier, the fingerprints are histograms modeling frequencies of observed features. Just capturing a probability distribution with a histogram might seem simple. However, there are multiple challenges that have to be addressed. First, how to reliably model a joint probability distribution of multiple quantities without need of large amount of data. Second, how to make this approach practically usable, as we face the limitations with respect to computational requirements. To overcome these problems, we introduced so called soft-histograms.
Soft-histograms are a smoothed version of standard histograms. Commonly, if a standard histogram is updated with a new observation, one nearest bin is selected and its value is increased by 1. In soft-histograms, additional filtering functions centered at each bin divide contribution of each update among multiple bins proportionally to their distances to the observation. This has a smoothing effect on the resulting histogram which helps us to suppress noise present in the observations and which would otherwise make the histogram-based approach unreliable. Parameters of the filtering functions can be optimized jointly with the positions of histogram’s bins during supervised training such that the number of effectively used bins is low which memory and computational requirements. There is a large variety of filtering functions that can be used – for example, the triangular filters as illustrated in Figure 5.

The triangular filters are not the only functions that can be used. It is possible to use, for example, Gaussian functions for filtering and tune their bandwidths in each dimension to change sensitivity of each bin for different feature, which we show in the next section.
One step further: Understanding a malware’s behavioral pattern
When used in supervised learning, the fingerprinting technique helps to find the most important properties of malware’s behavior. If we have samples of some specific malware family, a classifier can be trained, working on top of the histogram-based representation of its behavior. Together with the classifier’s parameters, the learning algorithm can also optimize positions of the soft-histogram bins and filtering functions’ parameters to support the classification performance. Then, by looking at the positions of the bins to which the learning algorithm assigned the highest weights, we can determine which values of which feature represent the important patterns of the malware’s behavior. Again, let us use another example found in networks protected by CTA – for this demonstration, we used fingerprints of connections belonging to Miuref/Boaxxe malware, which is identified as the #CMST01 threat by Cognitive Threat Analytics (see Figure 6).

As seen in the screenshot from CTA’s user interface, the connections can be identified thanks to the considerable amount of encoded data tunneled through the URLs. However, this is not the only evidence usable for detection of this malware. This malware also exhibits a specific pattern with respect to communication timings and sizes of individual requests. These features were used to create soft-histogram fingerprints of the connections and to train a classifier for the Miuref/Boaxxe malware. However, in this case, we used Gaussian functions as the filters and the learning algorithm was able to move the bins’ centers and also adjust their sensitivity for each feature by changing the bandwidth of the Gaussians. Thanks to this, the classifier could use only limited number of bins positioned such that they had maximal discriminative power for identification of this specific malware. The classifier ended up with just four bins with weights significantly higher than zero and, moreover, each of these four bins was sensitive for different feature(s). The sensitivity of the bins for specific features could be achieved by appropriate setting of bandwidths of the Gaussian filtering functions for the respective features.
The positions of the most important bins are summarized in the table below:
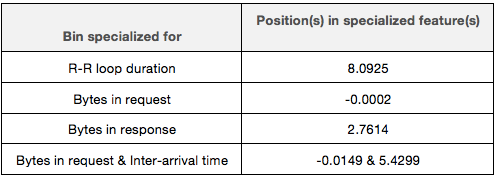
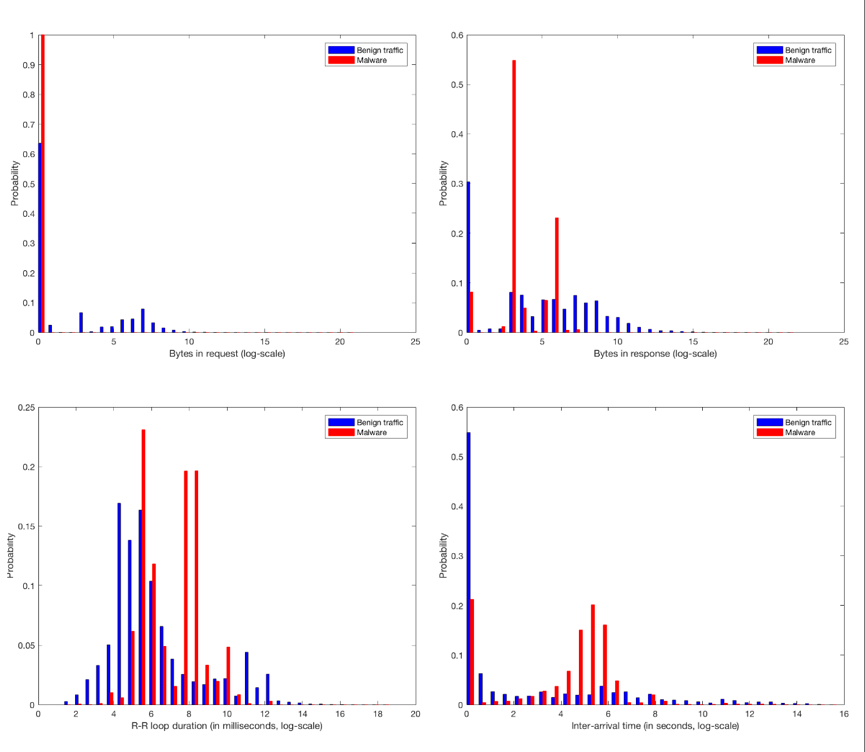
By looking at the distributions of individual features, we can find answer to the question why did the classifier “choose” these positions for the specialized bins (we use logarithmic scale for all the features). In Figure 7 below, we compare distribution of values of each feature for the legitimate (background) traffic to distribution of values observed in the traffic belonging to the malware for which the classifier was trained. As we can see, the most important bins are placed at positions that represent values that are observed in the malware’s traffic with high probabilities. This helps an analyst to discover the malware’s behavioral pattern. In this example, the pattern is: always zero bytes in the request body, the server’s response has mostly around 16 bytes. Furthermore, the malware appears to be operating in two modes – in one mode, the R-R loop duration is about 245ms (5.5 in log-scale), while in the second mode, the duration is about 3000ms (8 in log-scale). The second mode of operation is what makes the malware detectable – the similar pattern is shared by only few percent of benign traffic. Finally, repeating requests with inter-arrival time between 3 and 4 minutes contributes to the typical behavioral pattern of this malware.
Where to go next
For overview of Cognitive Threat Analytics, see https://blogs.cisco.com/security/cognitive-threat-analytics-turn-your-proxy-into-security-device. To request more information or a quote see cognitive.cisco.com. Algorithms that are using the connection fingerprinting were presented at several scientific conferences, for further reading we recommend papers [1], [2] and [3].
References
[1] Kohout, J., Pevny, T. (2015). Unsupervised detection of malware in persistent web traffic. http://ieeexplore.ieee.org/document/7178272/
[2] Lokoc, J. et al. (2016). k-NN Classification of Malware in HTTPS Traffic Using the Metric Space Approach. https://link.springer.com/chapter/10.1007%2F978-3-319-31863-9_10
[3] Kohout, J., Pevny, T. (2015). Automatic discovery of web servers hosting similar applications. http://ieeexplore.ieee.org/document/7140487/
[4] Drago, I. et al. (2012). Inside Dropbox: understanding personal cloud storage services. https://dl.acm.org/citation.cfm?id=2398827


Excellent blog post. I’ll never be tired to repeat: “The more I read, the more I learn from the security blog posts”, thank you for delivering such knowledge through this place. My respects.
Very nicely written!
This is highly educative, Kudos Security should be more in practical form now a days, because that is the way out.