Cisco Stealthwatch Cloud has the unique ability to provide an unprecedented level of visibility and security analytic capabilities within a Kubernetes cluster. It really doesn’t matter where the cluster resides, whether on-premise or in any public cloud environment. Stealthwatch Cloud deploys as a daemonset via a yaml file on the cluster master node, ensuring that it will deploy on every worker node in the cluster and both expand and contract as the cluster’s elasticity fluctuates. It’s very simple to configure this and once it’s configured, the sensor will deploy with each node and ensure full visibility into all node, pod and container traffic. This is done via deploying with a host-level networking shim that ensures full traffic visibility into every packet that involves any container, pod or node.
How’s this done? In this guide I’m going to walk you through how to deploy Stealthwatch Cloud within the Google Cloud Kubernetes Engine or GKE. I’m choosing this because its incredibly simple to deploy a K8s cluster for labbing purposes in a few minutes in GKE, which will allow us to focus our attention on the nuts and bolts of deploying Stealthwatch Cloud step by step into an existing K8s cluster.
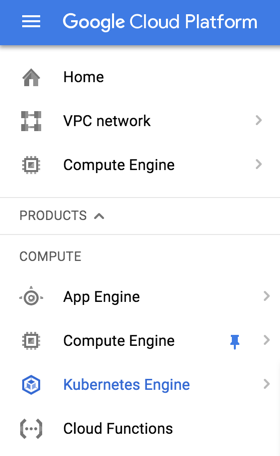
The first step is to login to the GKE utility within your Google Cloud Platform console:
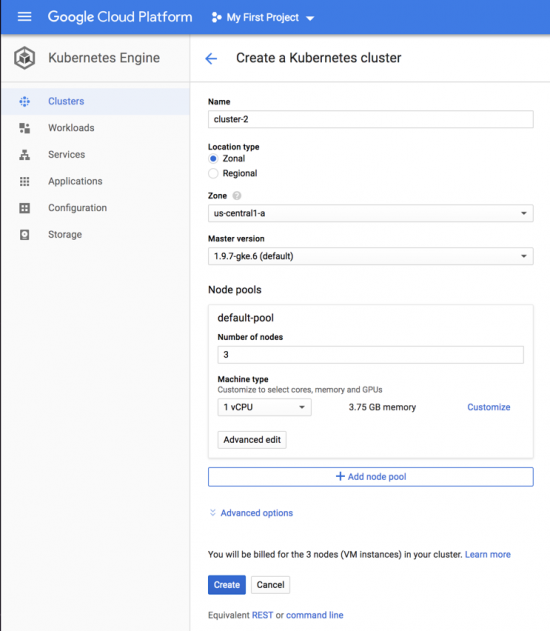
 Create your cluster:
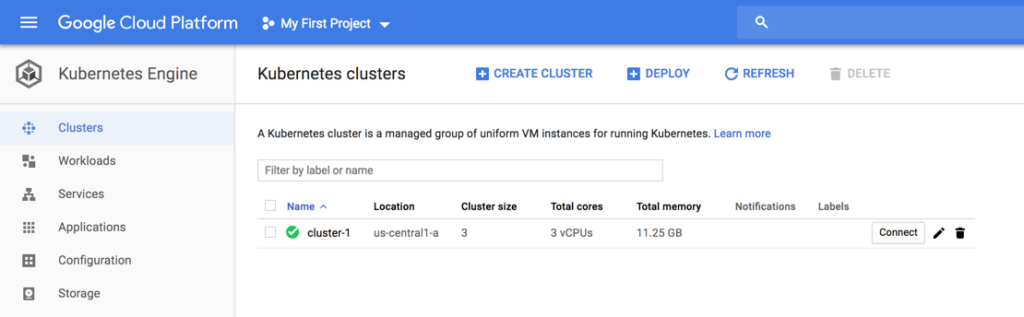
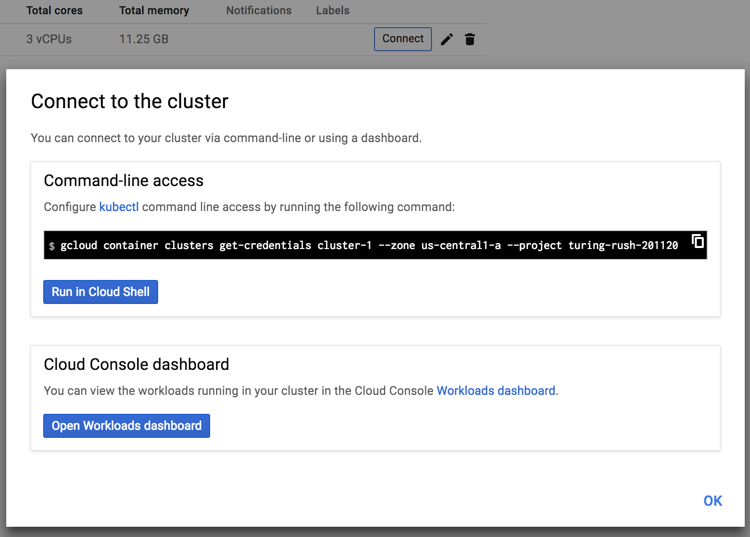
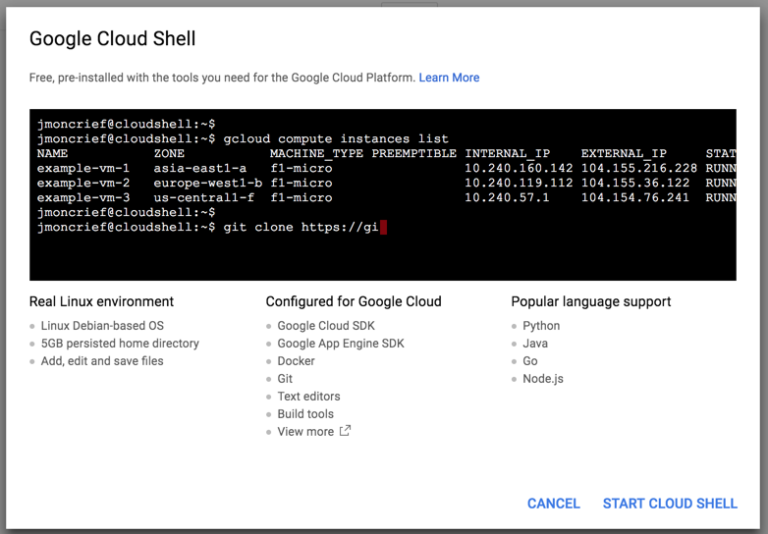
Click Connect to get your option to connect using the built-in console utility. Click the option for “Run in Cloud Shell”:
Click Start Cloud Shell:
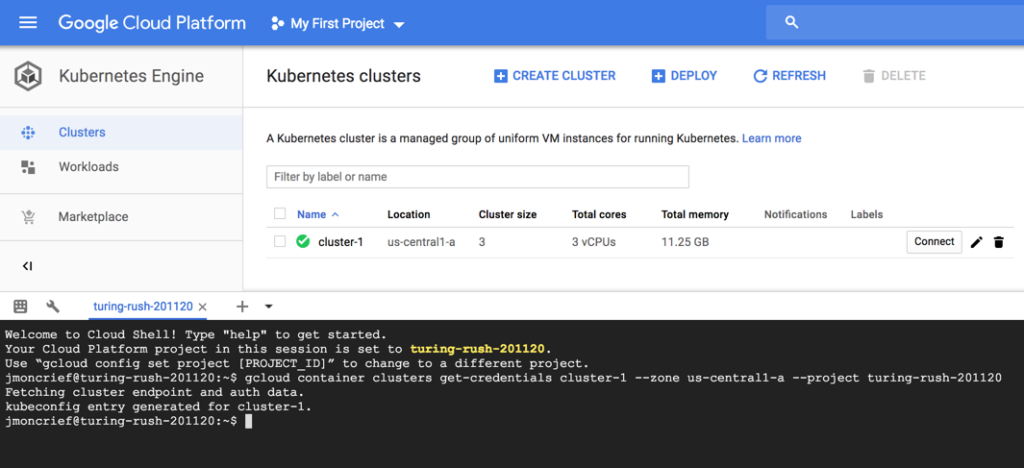
You will now be brought into the GKE Cloud Shell where you can now fully interact with your GKE Kubernetes cluster:
You can check the status of the nodes in your 3-node cluster by issuing the following command:
kubectl get nodes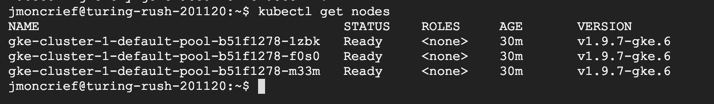
You can also verify that there are currently no deployed pods in the cluster:
kubectl get pods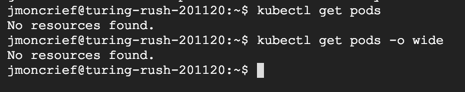
At this point you’ll want to reference the instructions provided in your Stealthwatch Cloud portal on how to integrate Stealthwatch Cloud with your new cluster. In the Integrations page you find the Kubernetes integration page:
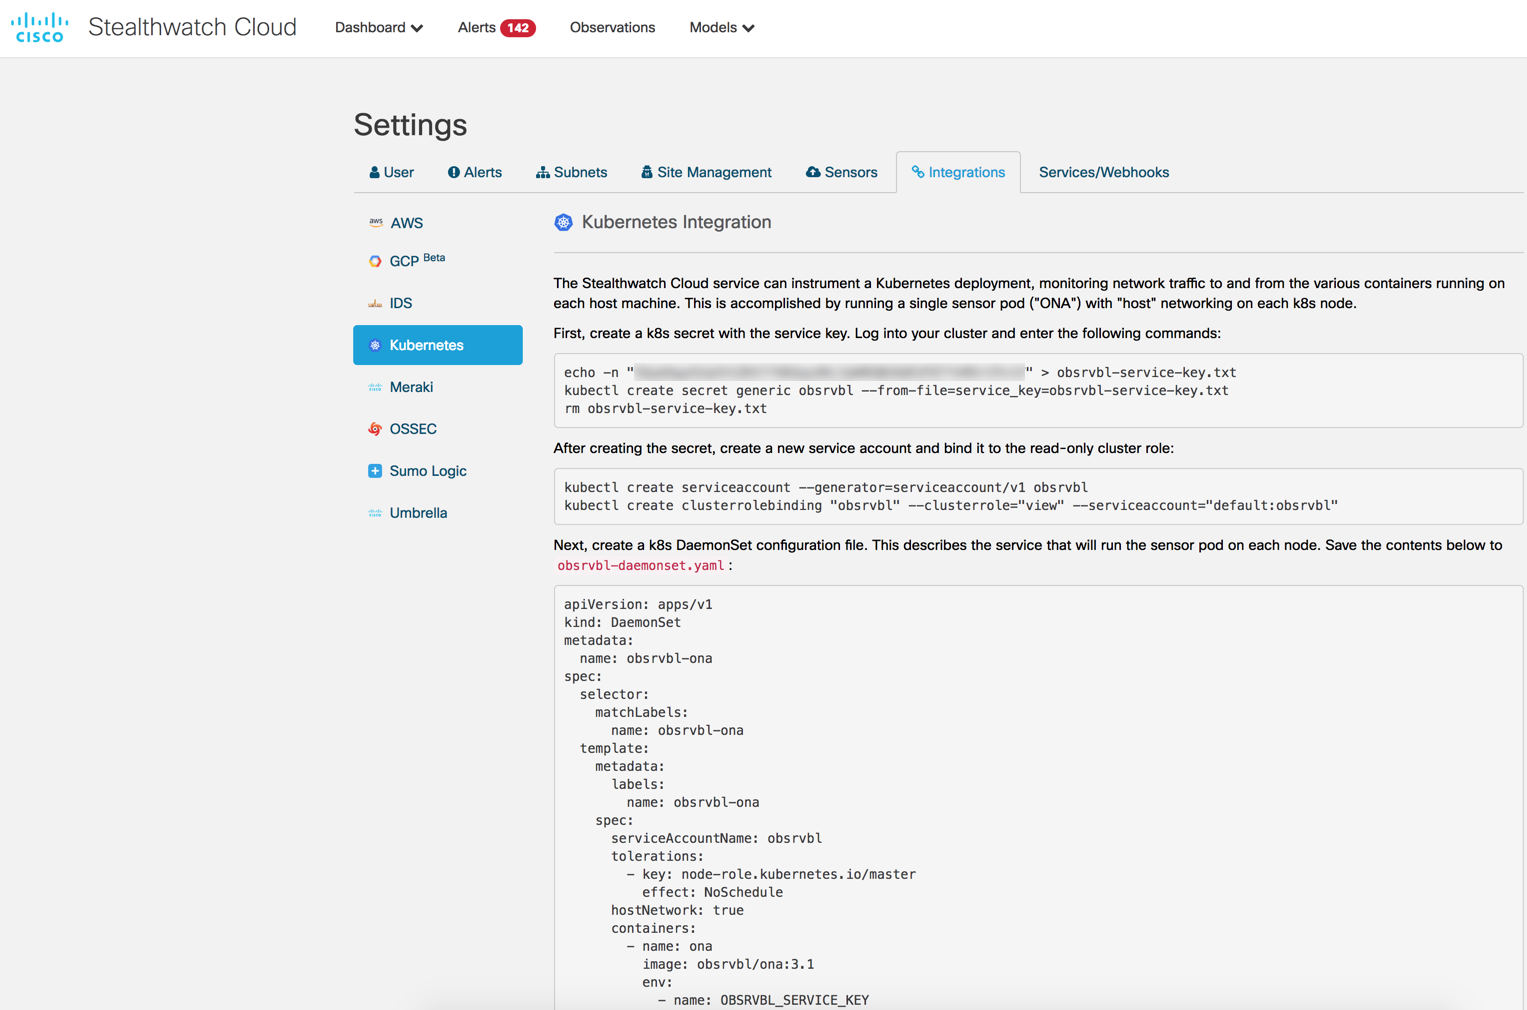
First we’ll create a Kubernetes “Secret” with a Service Key as instructed in the setup steps:

Now we’ll create a service account and bind it to the read-only cluster role:

Next, create a k8s DaemonSet configuration file. This describes the service that will run the sensor pod on each node. Save the contents below to obsrvbl-daemonset.yaml:
![]()
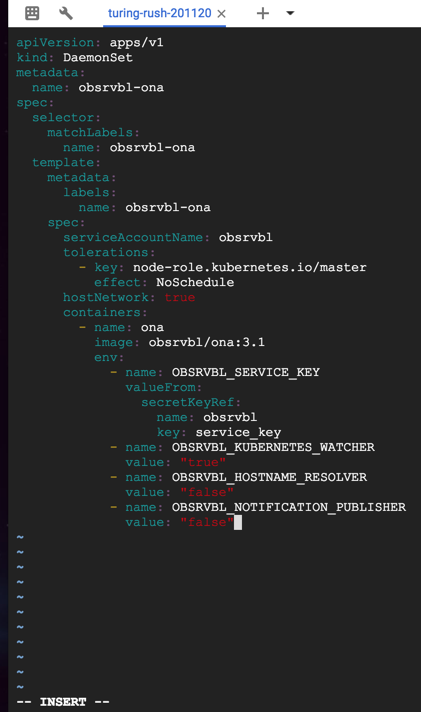
Save the file and then create the sensor pod via:
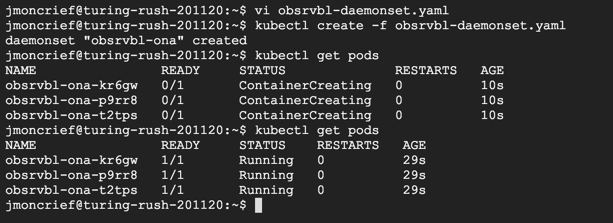
You can see that now we have a Stealthwatch Cloud sensor pod deployed on each of the 3 nodes. That daemonset.yaml will ensure that the pod is deployed on any new worker node replicas as the cluster expands, automatically. We can now switch over to the Stealthwatch Cloud portal to see if the new sensors are available and reporting flow telemetry into the Stealthwatch Cloud engine. Within a few minutes the sensor pods from GKE should start reporting in and when they do you’ll see them populate the sensors page as unique sensors in your Sensor List:
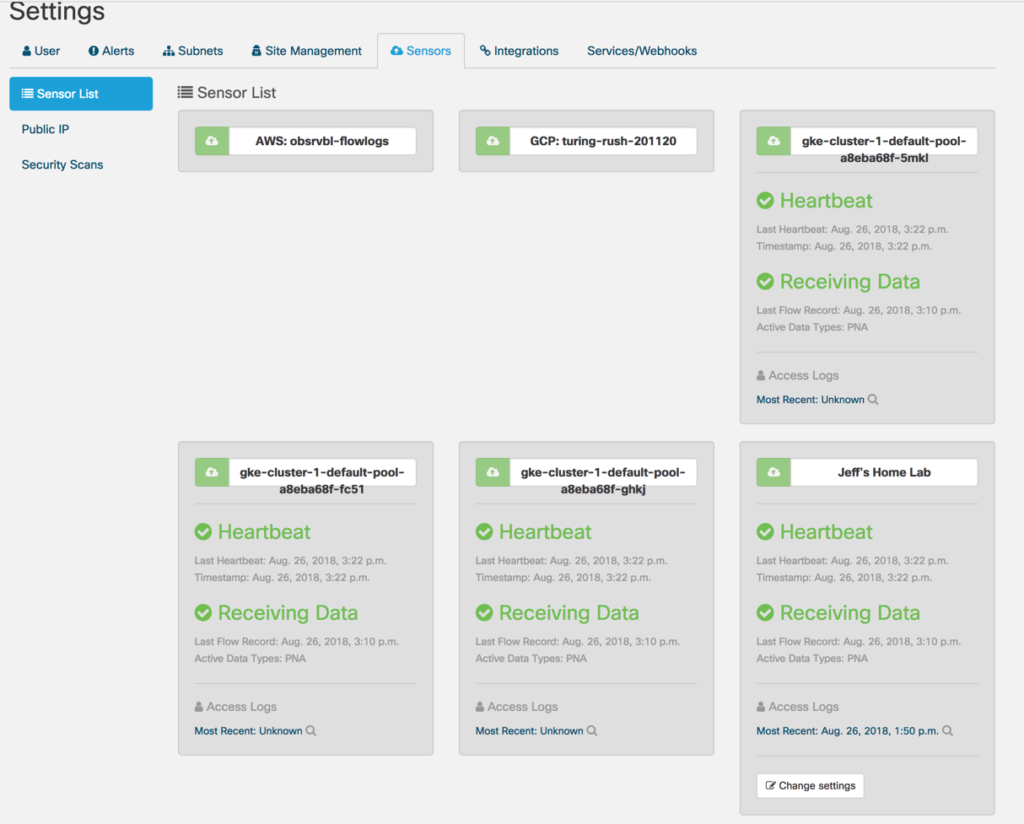
At this point Stealthwatch Cloud is now providing full visibility into all pods on all nodes including the K8s Master node and the full capabilities of Stealthwatch Cloud including Entity Modeling and behavioral anomaly detection will be protecting the GKE cluster.
We can now deploy an application in our cluster to monitor and protect. For simplicity’s sake we’ll deploy a quick NGINX app into a pod in our cluster using the following command:
sudo kubectl create deployment nginx --image=nginxYou can verify the status of the application along with the Stealtwatch Cloud sensors with the following kubectl command:
kubectl get pods -o wide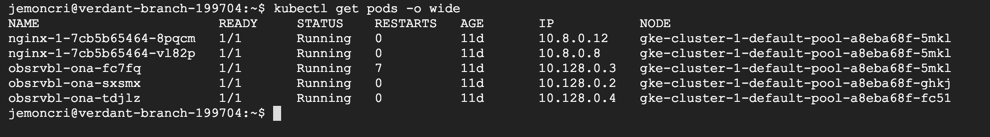
You’ll see in the above that I actually have 2 NGINX instances running and it’s simply because I edited the YAML file for the NGINX app to ensure that 2 replicas were running upon deployment. This can easily be adjusted to set your needs as you scale your K8s cluster.
After a few minutes you can now query your Stealthwatch Cloud portal for anything with “NGINX” and you should see the following type of results:
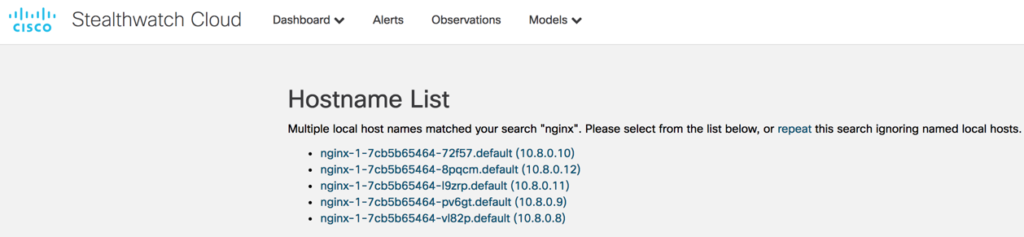
You’ll see both existing and non-existing NGINX pods in the search results above. This is because as the cluster expands and contracts and the pods deploy, each pod gets a unique IP Address to communicate on. The non-existent pods in the Stealthwatch Cloud search results represent previously existent pods in our cluster that were torn down to do reducing and increasing replica pods over time.
At this point you have full visibility into all of the traffic across the NGINX pods and full baselining and anomaly detection capabilities as well should any of them become compromised or begin behaving suspiciously.
To learn more about Cisco Stealthwatch Cloud, visit http://cisco.com/go/stealthwatch-cloud. Or sign up for a free 60-day trial.