![]() This post is co-authored by Martin Lee, Armin Pelkmann, and Preetham Raghunanda.
This post is co-authored by Martin Lee, Armin Pelkmann, and Preetham Raghunanda.
Cyber security analysts tend to redundantly perform the same attack queries with different input data. Unfortunately, the search for useful meta-data correlation across proprietary and open source data sets may be laborious and time consuming with relational databases as multiple tables are joined, queried, and the results inevitably take too long to return. Enter the graph database, a fundamentally improved database technology for specific threat analysis functions. Representing information as a graph allows the discovery of associations and connection that are otherwise not immediately apparent.
Within basic security analysis, we represent domains, IP addresses, and DNS information as nodes, and represent the relationships between them as edges connecting the nodes. In the following example, domains A and B are connected through a shared name server and MX record despite being hosted on different servers. Domain C is linked to domain B through a shared host, but has no direct association with domain A.
 This ability to quickly identify domain-host associations brings attention to further network assets that may have been compromised, or assets that will be used in future attacks.
The Graph Difference
In December, we outlined the importance of the graph database technology in our Big Data stack including the continuous relationship mapping and natural visual representation of the stored connections. In practice, Titan is currently ingesting approximately 10 terabytes of security data per month and that will grow significantly this year as we add additional data. The graph holds dynamic data that continuously updates and seamlessly combines both proprietary and open source data.
Our Extraction, Transformation, and Load (ETL) functions convert multiple in-file data sources into graph messages consisting of edges and nodes. We remove duplicates and push them into a qpid messaging queue. Our ingest framework removes messages from the queue and properly aggregates them in the graph based on a predefined schema. Analysts are able to query Titan using the Gremlin query language and manipulate the results in text mode or the results can be quickly visualized in our custom D3 front end.
Instant Value in a Zero-Day Attack
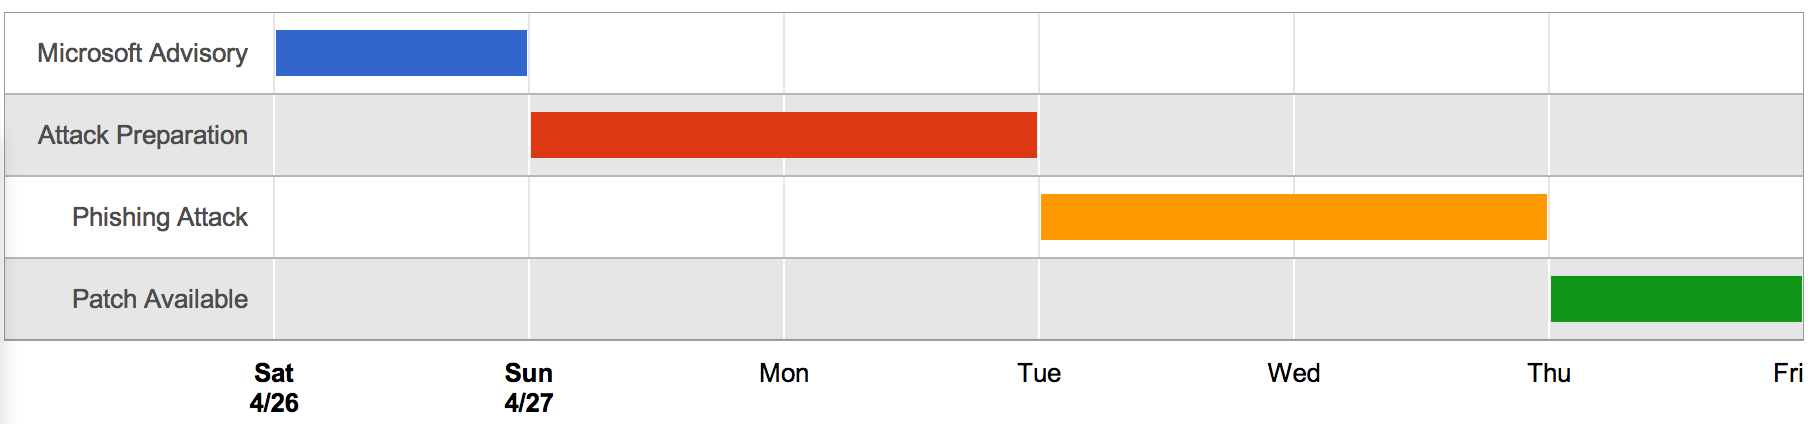
Recently, an Internet Explorer zero-day exploit (CVE-2014-1776) was used in phishing attacks. The attack timeline (below) reveals professional exploitation of the vulnerability. Only two days after public confirmation of the zero-day (Microsoft Security Advisory 2963983), the attack campaign began using social engineering to direct victims to compromised hosts in order to obtain authentication credentials. The attack lasted two days and was finished before Microsoft was able to release a patch, demonstrating efficient attack execution in a short time window, and further reminding us that traditional defenses (patching) are not always an attack mitigation panacea.
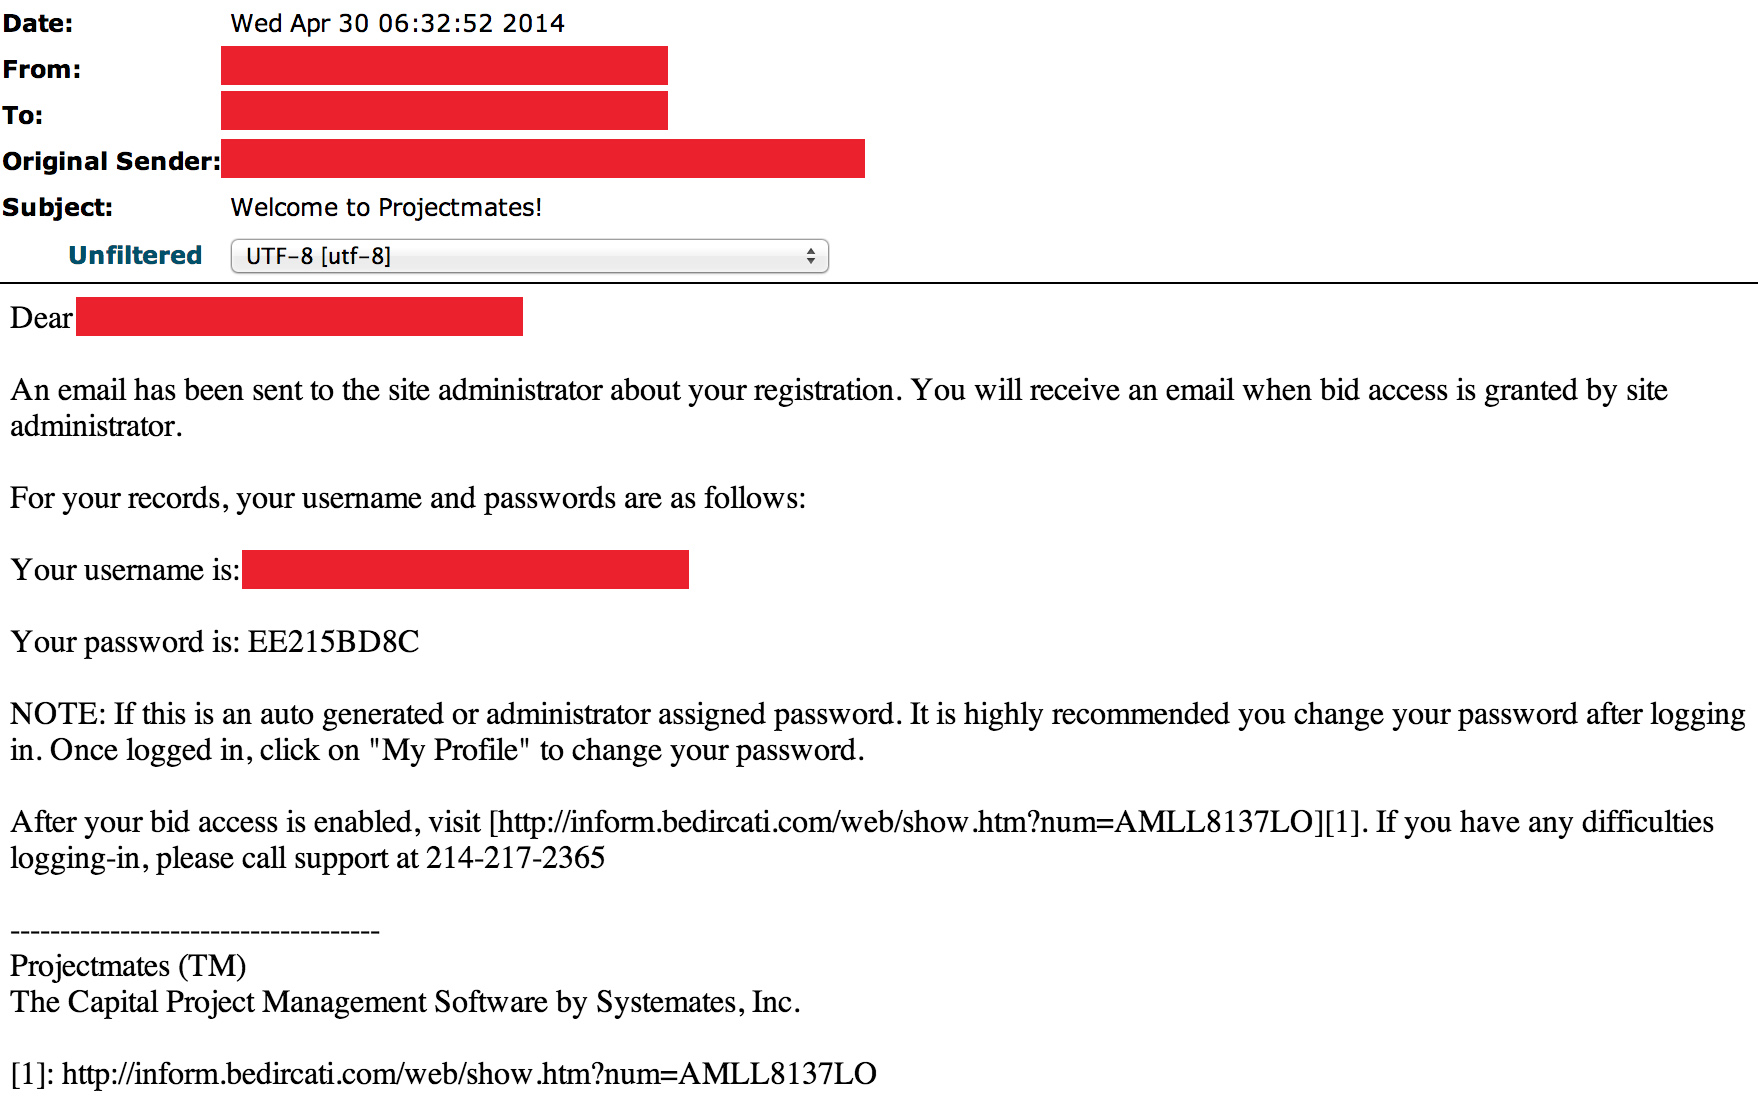
The attack leveraged four domains:
profile.sweeneyphotos.com

web.neonbilisim.com

web.usamultimeters.com

inform.bedircati.com
A Gremlin query for neonbilisim.com and bedircati.com returned results within seconds which produced the following graph.
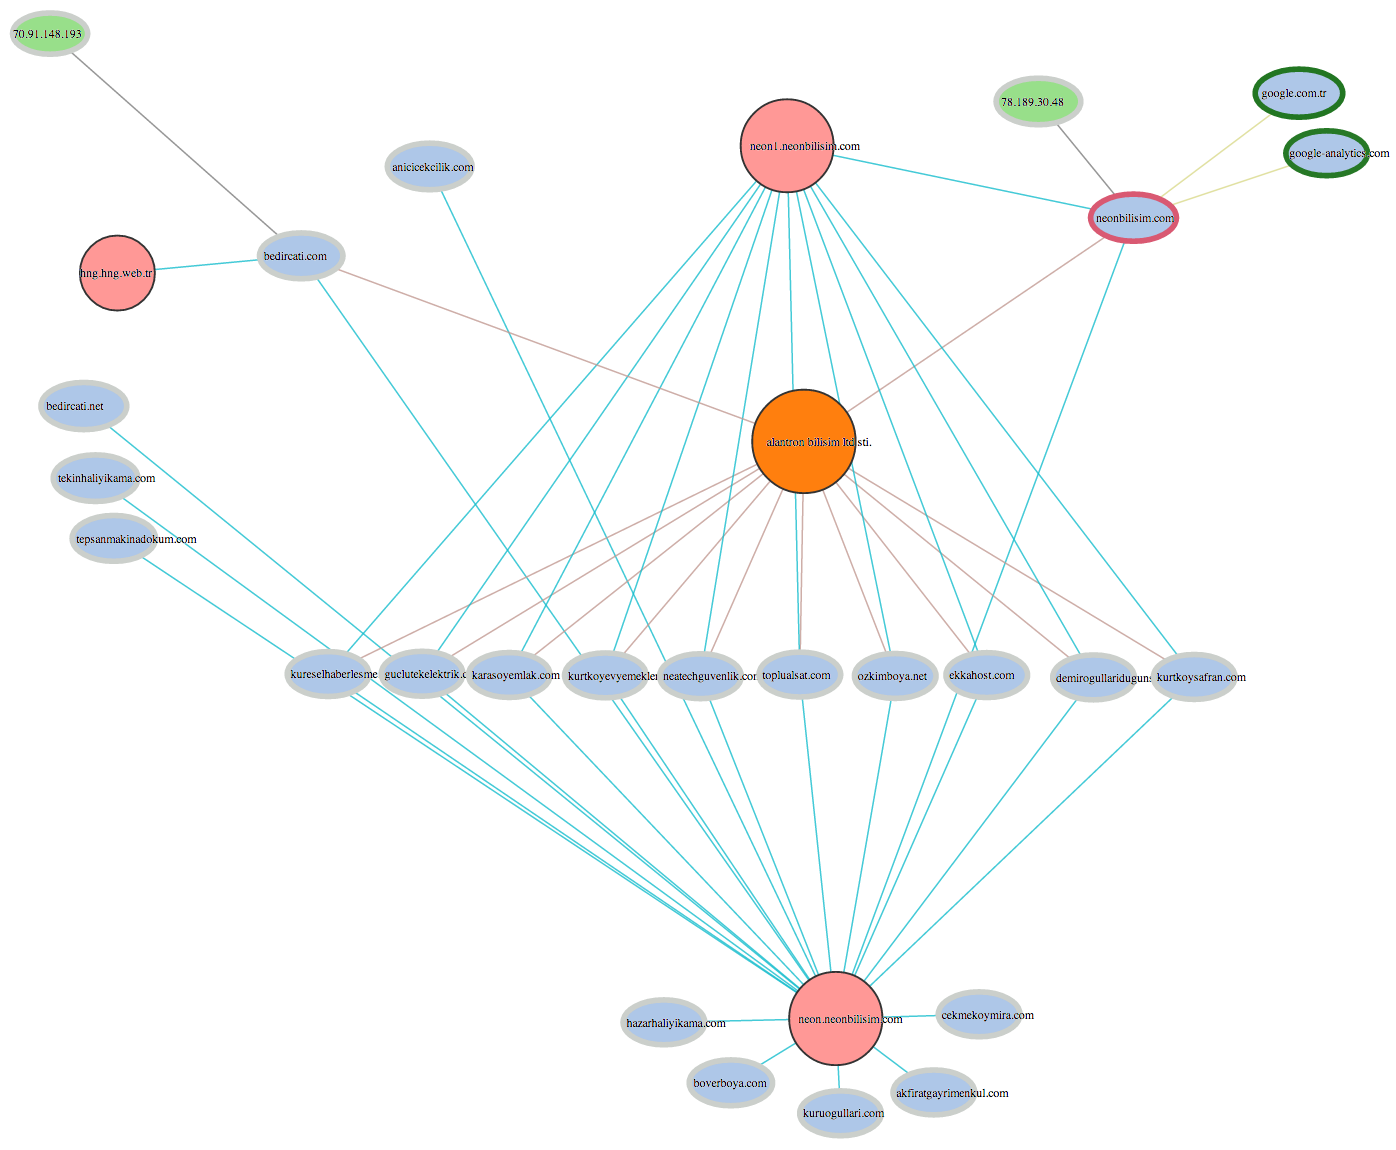
The color scheme employed for different nodes makes interpretation simple and fast, specifically, domains are light blue, name servers are pink, IP addresses are green, and registrars are orange. Additionally, the outer circle color denotes known reputation which vacillates between dark green (very positive reputation), grey (unknown reputation), and bright red (very negative reputation). Oval nodes represent proprietary data and circles indicate open source data. After querying two attack domains we have instant correlation with other data points that may have otherwise taken hours to extrapolate through a manual iterative query or scripting process.
In this attack, we see that neonbilisim.com and bedircati.com share a nameserver (neon.neonbilisim.com). We instantly discover additional domains using the same name server, which may be involved in additional attacks, currently lying dormant, or they may not be used for any malicious purpose at all. However, their association with domains known to have been used by the attacker means that these new domains are worth monitoring for future malicious activity.
bayrakmetal.com.tr

neonbilisim.com.tr

anicicekcilik.com

bedircati.net

boverboya.com

demirogullaridugunsarayi.com

neatechguvenlik.com

tekinhaliyikama.com

kureselhaberlesme.net

guclutekelektrik.com

karasoyemlak.com

toplualsat.com

ozkimboya.net

ekkahost.com

kurtkoysafran.com

hazarhaliyikama.com

cekmekoymira.com
Thus much of the correlation that analysts normally perform has already been articulated in the graph schema (the relationships have already been mapped), which leaves us only the task of viewing the connected data.
Conclusion
The power of the graph database is that it integrates well into an existing Big Data stack, it returns results quickly, and it naturally identifies valuable associations that may not be automatically discovered in an analyst’s manual workflow. Additionally, the database continually ingests all known proprietary and open source data and provides a connected representation to the user, increasing data visibility and derivative analytic opportunities. The graph database is truly transformative in that it maximizes the time available for analysts to do analysis rather than gathering data. When attacks are spreading rapidly or a zero-day exploit is involved, time truly is our most valuable resource.