Software tracing is essential for Cisco’s team of enterprise networking software engineers, along with the legions of developers, systems admins, and tech support personnel among our customers. Tracing is the specialized use of logging to capture the operational behavior of code down to the code execution path. It’s indispensable for developers for troubleshooting network software in production to catch bugs, errors, misconfigurations, or other problems throughout the birth and lifecycle of products.
Cisco has provided a more efficient and effective way to use network software traces at scale for our 80+ enterprise platforms. It’s called unified tracing.
With unified tracing, all traces deployed in software running anywhere in the system (e.g., in line cards or other field replaceable units [FRUs]), are streamed to the main processor of the Cisco device and collected in a single set of files. This integration of trace messages provides time-ordered, real-time visibility into what a router, switch, wireless controller, or Internet of Things (IoT) device is doing across its approximately 100 processes.
Here’s how we’ve ramped up tracing in a big way and what it means for enterprise networking.
Tracing Gets Binary in Cisco IOS XE 16.0
Release 16.x introduced binary tracing to the Cisco IOS XE code base. It’s now widely used.
Binary tracing relies on compiler technology to assist in the encoding of each trace point, allowing for the storage of non-ASCII text objects, like packets and software-generated objects in the trace stream. These binary objects provide richer operational information about how network platforms are performing.
Fully distributed, binary tracing also enables tracing on steroids, with some Cisco enterprise platforms able to exceed peak trace rates of two million traces per second per process. It also separates the encoding of high-performance traces from the decoding of traces, which can be displayed to users later.
Unified Tracing introduced in Cisco IOS XE Release 17.7
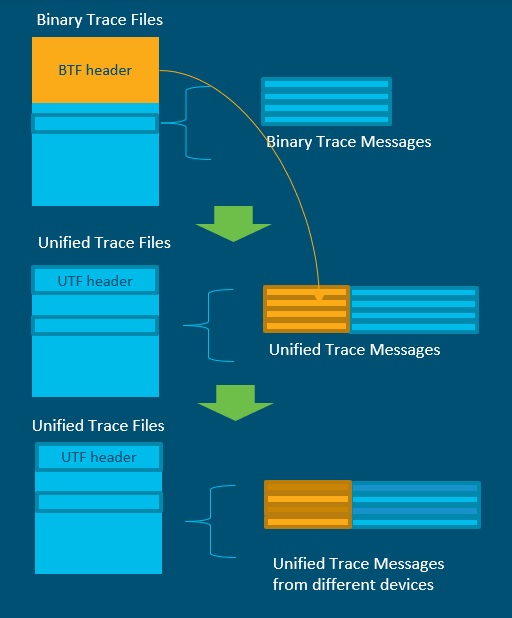
With binary tracing alone, each process writes traces independently to separate files. If you have 100 processes, you have 100 separate sets of files, which slows down troubleshooting.
With unified tracing, all trace files for a system are merged into one trace file set of messages with all of the information about their origins (Figure 1). Each trace event uniquely identifies the calling site information and carries context to know where in the system and the source code it was produced.

Users can filter the time-ordered unified trace messages to make intelligent filtering decisions and see and understand what’s going on in the 100 or so processes at work in each device with greater detail and in real-time. You might notice a large number of errors coming from a single process with unified tracing. Then you can inspect the code and quickly understand what’s going on. Before, reviewing individual trace files one at a time made this process much slower and not scalable.
Developers don’t have to change a single line of code to enjoy the improved logging performance of unified tracing. They can also continue to use the Buginf API as their Cisco IOS XE debug trace command. The goal was to introduce a uniform way to log information throughout a system regardless of the source, avoiding expensive data transformations or duplicate information logged in different ways for different customers.
Features and Benefits of Unified Tracing
- Automated traces from 100+ processes are streamed in real-time, in temporal order, across FRUs to a centralized set of unified trace files
- Centralized trace inspection based on high-rate filtering in real time is now possible―an industry first
- Richer information is collected on bugs, errors, misconfigurations, etc., across all system processes
- Identification of software issues during development and for post-release troubleshooting is accelerated
Additionally, in a coming version of unified tracing, trace files can be exported for use by analytical frameworks to provide further trace inspection and improve troubleshooting and insights. It’s a brand-new feature that also will allow for more efficient use of device disc space because of current CPU limits on the number of traces that can be created. It will enable more traces to be created and the ability to retain trace files elsewhere for the life of a system.
More Meaningful, Scalable Traces
With unified tracing in Cisco IOS XE, customers get a lot more information about what’s happening in their Cisco network devices than ever before. Developers can use unified tracing to finetune performance. Systems administrators and tech support agents can use it for more detailed, faster, and more scalable troubleshooting.
At Cisco we’re continually investing in products to improve the troubleshooting and serviceability of our products and unified tracing is a prime example.
More information on Cisco Unified Tracing is coming with Cisco IOS XE 17.10.
Additional Resources:
Moving Towards a Culture of Systemic Software Quality at Cisco
Solving Multi-vendor Network Management Complexity with OpenConfig – Cisco Blogs
The Cisco Catalyst 9000 Software Quality Mindset – Cisco Blogs
Welcome to Enhanced Programmatic Management of Enterprise Devices – Cisco Blogs


