Thought-leaders, implementers and creators across public sector, private business and education gathered for the second annual Internet of Things World Forum (IoTWF) in Chicago. It was an opportunity to see real examples of the Internet of Things (IoT). While the buzz was about IoT, CMX provided meaningful insights like average registration times, visitors in various zones by the hour, and corresponding dwell times. It was possible to predict which vertical is more likely to adopt IoT first, based on device count, dwell time and traffic patterns.
Cisco Connected Mobile Experiences is a solution that lets organizations leverage their existing Wi-Fi infrastructure for business analytics, and transform the way they connect with their mobile end-users. The Cisco CMX solution consists of Detect, Connect and Engage, which work in unison to create an end-to-end mobile experience for the user while providing business benefits to the enterprise.
- Detect: Aggregate and visualize location data from the Wi-Fi network
- Connect: Easy, secure guest access to the Wi-Fi network
- Engage: Customize the end-user mobile experience to delight customers in your venue
Here are some of the reports we generated and the observations we’ve gleaned.
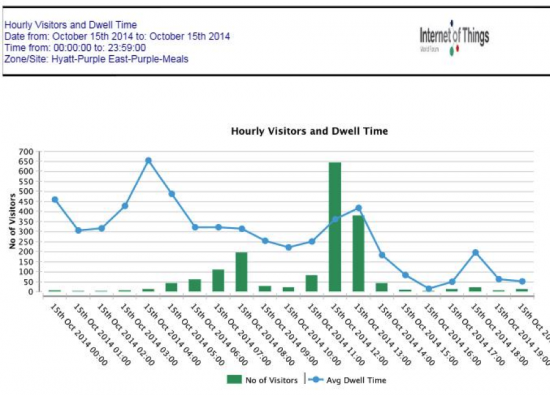
Registration
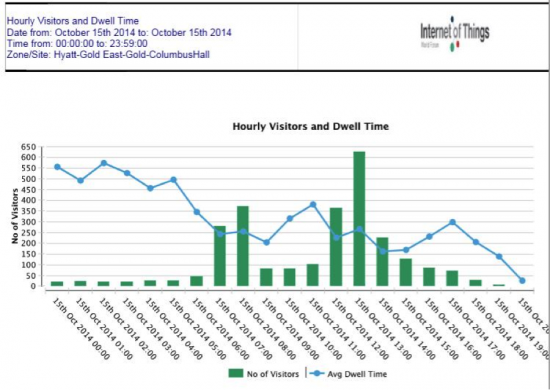
One of the common reports from CMX Analytics is hourly visitors and dwell time. This “Registration” chart provides a view of total number of visitors and corresponding dwell times for the entire day by the hour. The key takeaway is that most participants were registered by 9:00 a.m. and the average wait time was 15 minute. In business terms, this is a great sign for the operations side of the events team, which was able to maintain a consistent average wait time despite the clear spike and variation of registrants entering the zone.

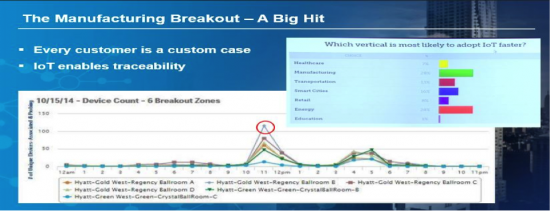
Breakout Popularity
One of the widgets on the CMX Analytics dashboard can be configured to show comparative device count by zone.
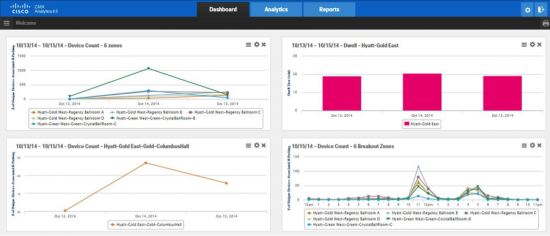
Notice the widget on the bottom right hand side: a comparison of device count by breakout rooms. This provides an insight to which breakout session was most popular.
With a simple cross-check, compare it to the polling from the keynote opener the day before: which vertical is most likely to adopt IoT first? Manufacturing takes the lead on both accounts, followed closely by energy, verifying the audience sentiment and how interest translated to behavior at the conference.
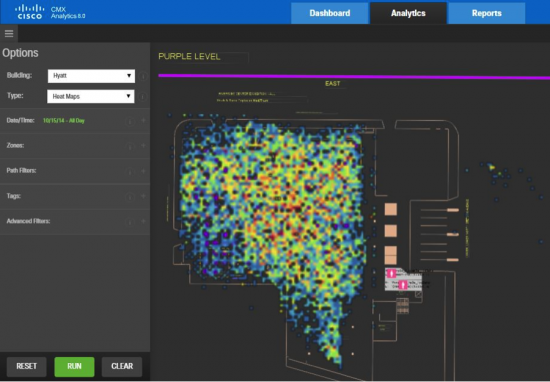
Monitoring Traffic Flow
In the following chart we can see that the dining area peaks at noon and starts to taper off at 1:00 p.m.and a more visual representation of the density of visitors in the dining hall is provided by the heat map. We also see, from the last chart that the crowd shifts from the dining hall to the Expo area after leaving the dining area. This traffic flow is indicated by a drop in number of visitors in the dining hall with a corresponding spike in the Expo area. These insights helped the operations and facilities teams to optimize their work flow.
We are seeing that the data set and reporting that CMX Analytics provides is being used by industries across verticals to drive business outcomes. For more information on Cisco CMX please visit http://cmx.cisco.com
Tweet us @Cisco_Mobility if you have any questions.