
In the previous blog, Naveen introduced our brand new IoT data orchestration software, Cisco Edge Intelligence, to developers. As you have learned, Edge Intelligence (EI) connects assets at the edge to multi-cloud application destinations in a very easy way for the user.
Today, I will cover a detailed overview of how we built the Cisco Edge Intelligence Sandbox on DevNet Sandbox, and how the whole testing environment can save you a lot of time. Also, there will be a useful goodie for you at the end. So, let’s keep reading 😉
Check out the sandbox here: https://devnetsandbox.cisco.com/RM/Diagram/Index/42fa2e98-84b6-45bd-8fa9-653b0d676131?diagramType=Topology
The Sandbox Architecture
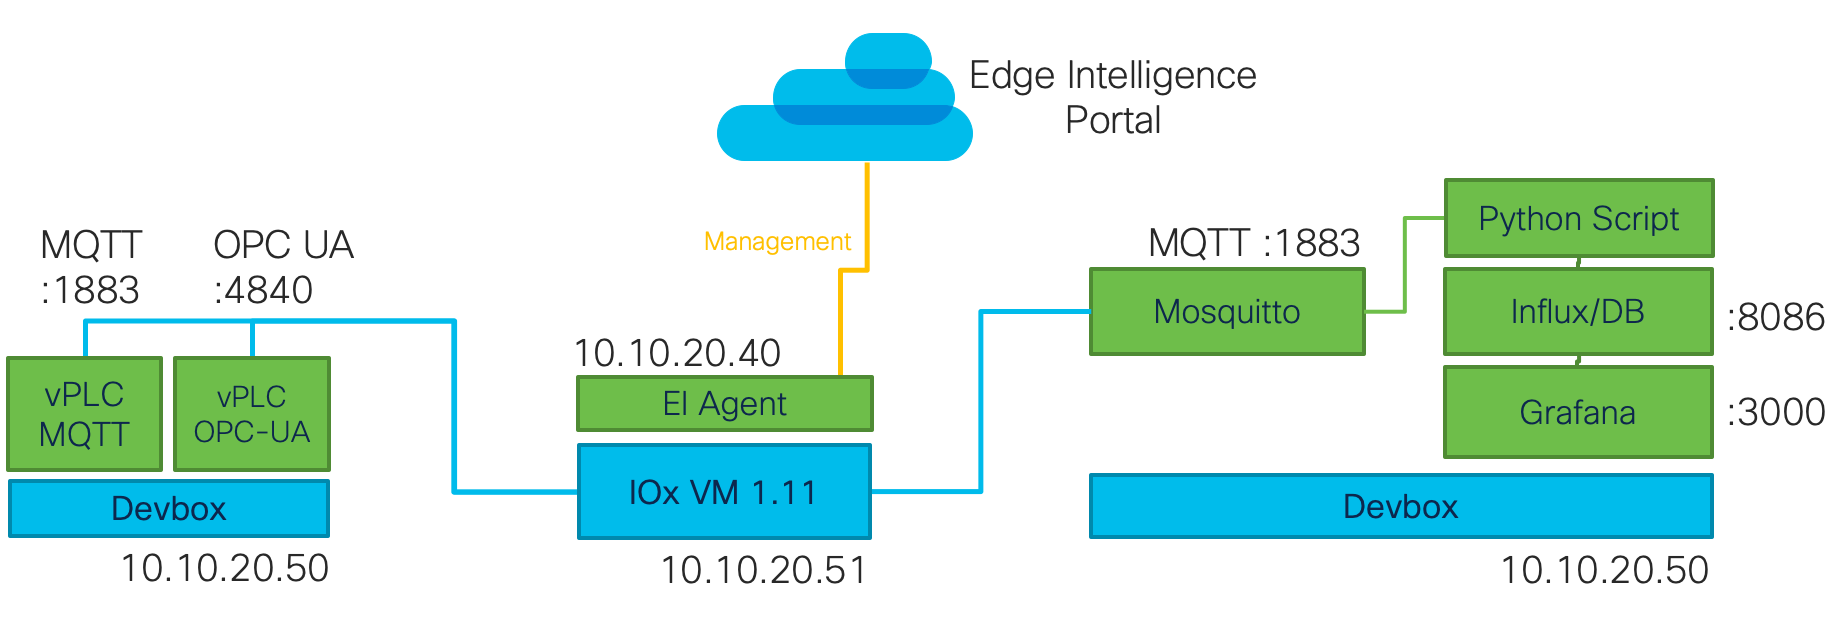
Edge Intelligence has basically 2 major components: a web-dashboard where the user can configure, manage and monitor all data flows (EI Portal) and the data brokers at the network edge (EI agent). For testing and setup, I therefore added the southbound and northbound environments as follows:
Southbound:
- Python Script simulating a virtual PLC and sending MQTT data to the EI agent
- Python Script simulating a virtual PLC and OPC UA server, providing data for the EI agent
Northbound:
- MQTT broker (Mosquitto), time-series database (InfluxDB) and web dashboard (Grafana)
What’s the whole scenario about?
It basically should simulate a distributed water pipeline management solution as seen in the image below. Pipeline sensors are sending sensor data (temperature, pressure, machine setting) via the Cisco Gateway IR1101 (in the sandbox this is a virtual IOx instance) and EI agent to the company’s private cloud for leak monitoring and water quality assurance. The data set is based on real sensor data from Kaggle.
As you can see, this is the on-prem option of EI where the whole data flow remains within the company’s network. Of course, you could also send the data with EI to a public cloud, for example directly into the Azure IoT Hub.

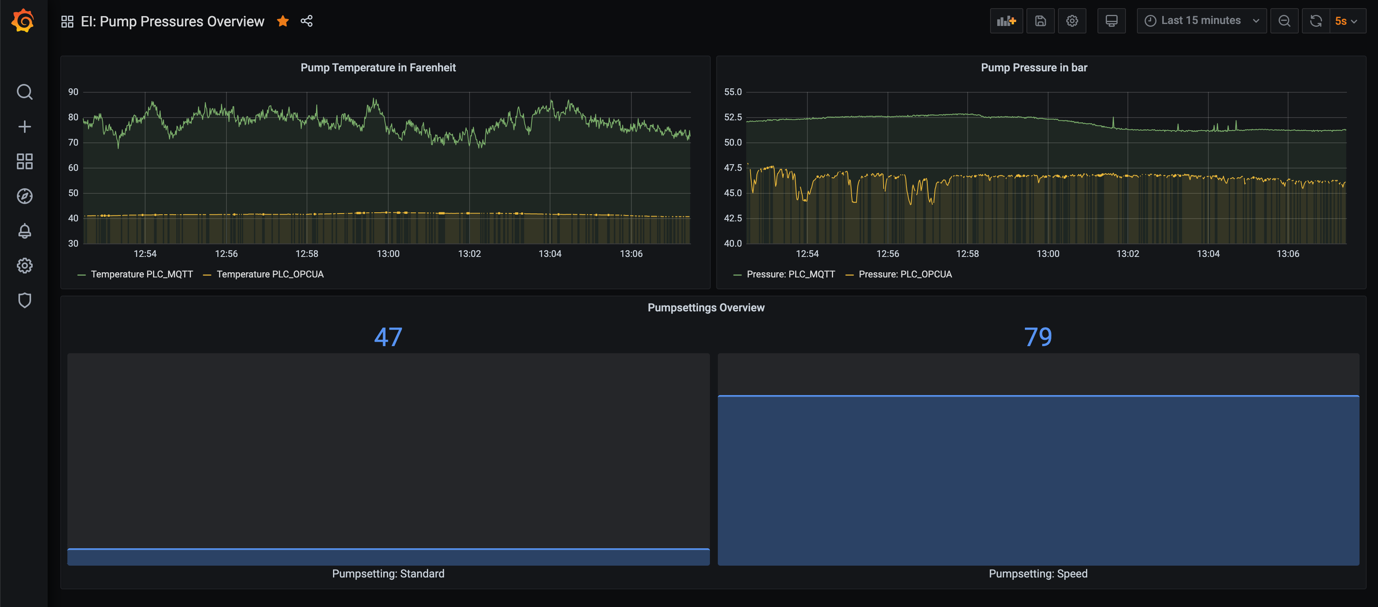
On the northbound side, the aggregated data is sent via MQTT to the open source MQTT broker Mosquitto. From there, a customized script is receiving the subscribed sensor data and putting it into an Influx database where finally the data can be shown on a Grafana web-dashboard as you can see below.
We put all the services on just one Linux machine (Devbox) which is communicating with the virtual IOx environment. For testing, this setup is totally sufficient. However, you can expand it and maybe use a raspberry pi or a second virtual machine to separate southbound and northbound also from a networking perspective.
And here comes your goodie:
You can download the source code and documentation of the OPC UA server on our DevNet Code Exchange, and use it together with the sandbox or in your private lab. Enjoy!
Outlook
Until now, we are extracting data from heterogenous data sources, aggregating them and sending it to our predefined data destinations. That’s really cool since with EI these are just some simple mouse clicks on the web dashboard. However, in the next step we will focus on data transformation where we will execute Java Script code on the EI agent to enable classic edge computing. So, stay tuned for what will come next!
Watch the recorded webinar, “Cisco Edge Intelligence: Moving Data from IoT Edge to Multi-Cloud.” We’ll show you how you can create your asset types, asset inventory, and data policies within just a few minutes and send data from the edge to your MQTT broker or preferred cloud hosting service.
Further Resources:
We’d love to hear what you think. Ask a question or leave a comment below.
And stay connected with Cisco DevNet on social!
Twitter @CiscoDevNet | Facebook | LinkedIn
Visit the new Developer Video Channel


