
Traditional features such as SNMP, CLI, and Syslog, used for collecting operational statistics from a network, have several restrictions due to the growth of the objects like IoT devices and cloud based applications.
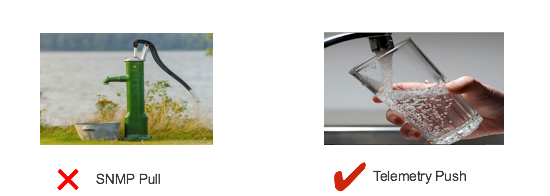
SNMP uses the pull model when retrieving data from a switch. This model cannot scale for today’s high-density platforms, and offers very limited extensibility. The pull model is based on a client sending a request to the switch, then the switch responds to that request. On average, network operators using SNMP poll data every five to thirty minutes. But with today’s speeds and scale that’s not enough to capture important network events. SNMP also uses push model while sending a trap similar to Model-Driven Telemetry on-change notification which is described later in this blog.
These traditional models also impose limits like scale and efficiency. We are using the same tools (SNMP and CLI) to get operational data of our routers and switches that we are using from years. These two also put barriers for truly automating and gathering data from network devices.
The Main use cases for network monitoring and troubleshooting didn’t change much but what’s new is that hardware capabilities and performance has changed tremendously. Many third party applications have been developed to collect data from network devices for data storing, analyzing, indexing, searching, and visualizing. And all these tools are open sourced.
Why Model-Driven Telemetry?
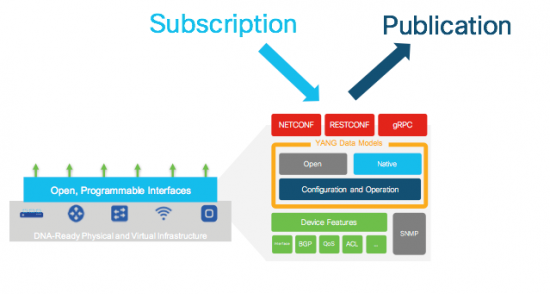
Model-Driven Telemetry is a new approach for network monitoring in which data is streamed from network devices continuously using a push model and provides near real-time access to operational statistics. You can precisely define what data you want to subscribe to using standard YANG models (YANG is a data modeling language used to model configuration and state data manipulated by the NETCONF protocol) with no CLI required. It allows network devices to continuously stream real time configuration and operating state information to subscribers. Structured data is published at a defined cadence, or on-change, based upon the subscription criteria and data type.
You also can use third party applications to collect the data which can be used for monitoring and troubleshooting. Telemetry subscriptions and their updates are transmitted over a NETCONF session. A NETCONF session is established by starting an SSH session to the device on port 830.
How to create Subscription
In order to stream data from the device the application must set up a subscription to a data set in a YANG model. A subscription is a contract between a subscription service and a subscriber that specifies the type of data to be pushed. Subscription allows clients to subscribe to data models and device pushed the data to the collector for the subscribed model.
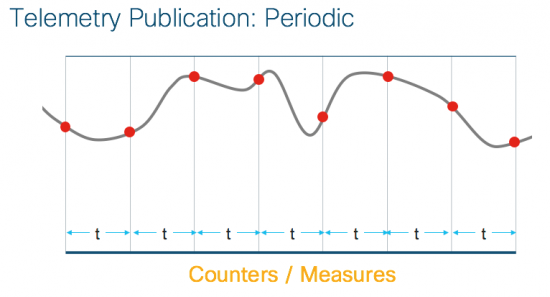
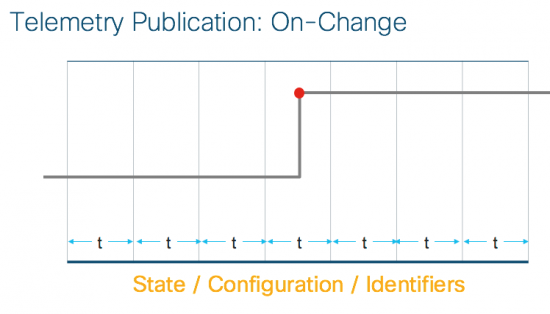
 There are two types of subscriptions: periodic and on-change. With periodic subscription, data is streamed out to the destination at the configured interval. It continuously sends data for the lifetime of that subscription. With on-change, data is published only when a change in the data occurs such as when an interface or OSPF neighbor goes down.
Subscriptions are created over existing NETCONF sessions and are created using XML RPCs (RPC is a Remote Procedure Call protocol which uses XML to encode its calls). The establish-subscription RPC is sent from a client or collector to the network device. The following is a sample output from the show telemetry ietf subscription all detail command, which shows the details of a subscription.
switch#show telemetry ietf subscription all detail
Telemetry subscription detail:
Subscription ID: 2147483678
Type: Dynamic
State: Valid
Stream: yang-push
Encoding: encode-xml
Filter:
Filter type: xpath
XPath: /cpu-usage/cpu-utilization/five-seconds
Update policy:
Update Trigger: periodic
Period: 1000
Notes:
There are different third party applications to collect the data from switch. Below is an example for the data collected in ELK stack and represented in Kibana. ELK stack is an open source application for real time data analytics for structured and unstructured data. KIBANA is an open source data plugin and provides visualization capabilities. Below is the graph for CPU utilization for every five seconds represented in Kibana.

You can delete a subscription in two ways. One is by sending a delete-subscription RPC with the subscription ID or a subscription is also deleted when the NETCONF session is torn down or disconnected.
Now you can also stream on WLC
Until now you have learned about streaming telemetry on switches, but now you can also stream real time data from a Wireless LAN Controller as well. On the WLC, streaming of data will be implemented using pre-configured webhooks. A Webhook is a web application that POSTS a message to a URL when certain things happen, it delivers data to other applications with near real time information. This webhook is a new feature that comes in WLC and enabled with few cli commands.

On the WLC you will subscribe to a tables such as AP’s, client, mapserver using either CLI or the GUI. Once a subscription is enabled on the WLC, it starts streaming data to the telemetry consumer.
Data is published in the form of snapshots at interval of 5 minutes or 30 seconds. Each snapshot can be either ‘Bulk’ or ‘Differential’ type. As the name suggests, ‘Bulk’ is the whole dataset and ‘Differential’ is a patch on top of last bulk. You can also enable network webhook on-change publication that means when a change occurs then only a notification will be sent. Similar to switching you can use different third party applications to view the collected data.
Try it
Modernize your network monitoring using Streaming Telemetry and if you need some help getting started with, refer Cisco.com, DevNet, IOS-XE pages, Learning labs and Sandboxes for more details.
We’d love to hear what you think. Ask a question or leave a comment below.
And stay connected with Cisco DevNet on social!
Twitter @CiscoDevNet | Facebook | LinkedIn
Visit the new Developer Video Channel


Nice an informative article champ!!
Good stuff. Are any examples available for how to use this to get data from IOS-XR and NX-OS? Also things that are a little more obscure like multicast joins?
Thanks,
Greg
Thank you, there are some other blogs on IOS-XR and NX-OS. This is related to IOS-XE. Below link has some blogs on IOS-XR.
https://blogs.cisco.com/author/shellycadora
Not exactly sure what do you mean by Multicast joins related to streaming telemetry. Because streaming telemetry is more like to get operational data from devices for troubleshooting and analyzing.