
As tradition, I had my paid time off during Xmas holidays. When back, I realized Cisco product development team had not slowed down their efforts to ameliorate and update existing products. One point in case is Cisco Datacenter Network Manager for SAN, DCNM-SAN for friends. The newly posted DCNM 11.5 release includes an enhancement about the validated scalability of one specific attribute that will make many users happier. Since I have not seen this specific enhancement explained and extolled anywhere else, I’ll try to offer my view on this.
Cisco SAN Analytics feature
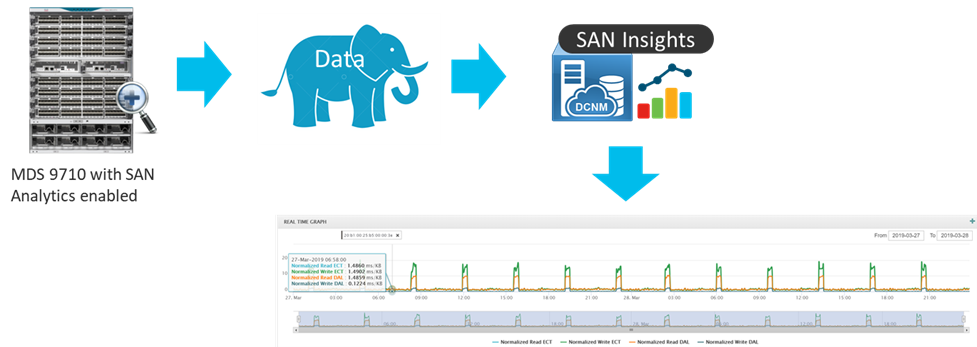
All 32G Fibre Channel fabric switches and directors in the Cisco MDS 9000 family offer the SAN Analytics feature. This industry unique technology only inspects the Fibre Channel and SCSI/NVMe headers, not the payload, and so it is in agreement with GDPR requirements. The switch will process this data and then push the resulting metrics information out the management port. The relevant feature is known as SAN Telemetry Streaming (STS) and it uses the gRPC opensource API, based on HTTP/2 transport and gPB encoding format.
For some more details on SAN Analytics, you may dwell on this blog here:
https://blogs.cisco.com/datacenter/cisco-mds-san-analytics-the-gps-system-for-your-san
Cisco DCNM SAN Insights
Cisco DCNM for SAN includes a feature called SAN Insights. Essentially it enables DCNM to complement and enhance the SAN Analytics capability on network devices. In simple terms, DCNM SAN Insights enables DCNM to perform the following four tasks:
- a scalable receiver for data pushed out of MDS 9000 switches via STS
- a long term repository for the received data
- a post-processing engine for the received data
- an intuitive visualization tool for the processed data

Let’s talk about self-learned I/O flows
But what kind of data is streamed out of MDS 9000 switches and received, stored, processed and displayed by DCNM SAN Insights? Well, essentially it is a massive collection of all the I/O flows traversing the Fibre Channel SAN and their associated 70+ metrics like latency, I/O size, outstanding I/Os, IOPS, throughput, CRC errors and many others. All that data is continuously collected in almost real time and can be accessed in its entirty via the NX OS CLI or some script (on-switch approach). It is a lot of data, in the form of database records and tables, possibly too much for a human being to consume and digest in an easy way.
An alternative method wants MDS 9000 switches to stream the collected data out the management ports every 30 seconds (off-switch approach) and toward an external receiver. This is where DCNM SAN Insights makes the magic: it turns an elephant of data into nice charts that administrators can easily interpret. Of course, some basic knowledge of the Fibre Channel protocol and block storage transactions in general are welcome.
There is no unique definition of an I/O flow over a Fibre Channel network but the easiest way to get it is by describing an I/O flow as a combination of Initiator-Target-LUN (ITL) identifiers. When using the emerging NVMe/FC protocol, that would become Initiator-Target-Namespace (ITN). A single MDS 9000 switch port can so provide visibility for many I/O flows, even thousands of flows when it is an E_port (ISL).
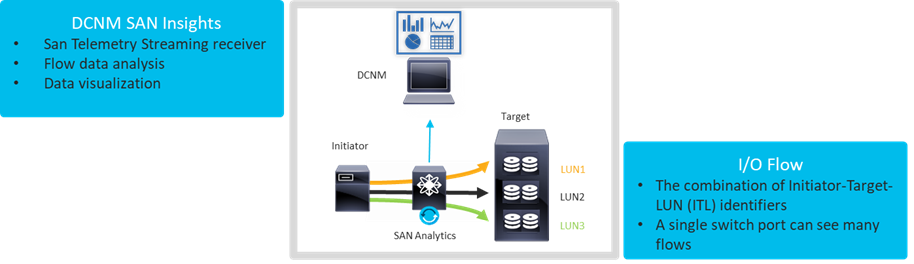
Let’s make an example and fix the concept in memory. Imagine a host (Initiator) zoned 1:1 with a single all flash array port (Target) where 30 LUNs are configured and exposed to that host. On the switch port connected to the host, we would see 30 ITL flows (1x1x30). Now imagine you have many hosts and many targets and even more LUNs so you can work out your math. Depending on number of ports and other configuration parameters, a real world SAN can transport from a few hundreds to many thousands of I/O flows. With DCNM SAN Insights adoption now being so strong within datacenters of any size, I would not be surprised if we would find situations where more than 200,000 I/O flows are present and need to be monitored. In my personal (and limited) experience with this unique capability, majority of customers today seem to have between 2,000 and 40,000 I/O flows running at the same time.
These numbers are even more impressive when you consider that all those I/O flows are automatically discovered by the switches, self-learned. It would be clearly impossible to configure them all manually. At the same time, it would be a bit useless to instruct the switches to monitor just a small subset of them, because we would miss data that could be crucial for an effective troubleshooting activity. The fact I/O flows are automatically discovered is very important because it makes SAN Analytics a proactive troubleshooting tool and not just a reactive one. DCNM SAN Insights builds upon the power of SAN Analytics, adding the ease of use that network administrators love.
Scale matters
All this said and explained, I’m now ready to share more about the recent DCNM enhancement that was the reason for me to write this blog. All data about I/O flows and their metrics are streamed out of MDS 9000 switches toward the external receiver. As a result, the receiver should be able to survive this data deluge. With DCNM 11.5, the tested and officially supported scale limit has been raised up to 60,000 simultaneous self-learned flows with 70+ metrics each, 3 times higher than previous release, and good enough for the majority of deployments.
Cisco is constantly working with customers to gather their input and analyze their real-world storage networks to understand the needs of the solution, while at the same time working to ensure the products can support those requirements. Cisco SAN Analytics is a comprehensive product solution that has the ability to generate up to 2.8 million data points every 30 seconds from a single director. At that rate, being able to consume and process that data in a meaningful manner is quite a tough job. It is not a sprint to the most metrics but rather a marathon to make sense out of the data that you have available over a reasonable amount of time. It is from this marathon with the elephant of data that we can gain actionable insights into real-world storage performance. This forms the basis for the value that DCNM SAN Insights provides. In the end, we all agree elephants are best at marathons, not sprints, right?
Hopefully it is now clear that scale matters. Dealing with one I/O flow at a time is not super-complex but dealing with thousands of I/O flows simultaneously is a totally different kind of animal. DCNM 11.5 release has just made an important step in that direction.
Cisco DCNM is a powerful and comprehensive management tool covering day0, day1 and day2 operations. It has always scored a high success in supporting the management and monitoring needs of Cisco customers for datacenter networking products. With its SAN Insights feature, it has augmented its value by also providing long-term trending, end-to-end correlation, advanced analytics (like automatic learning of the performance), automatic baseline calculations, automatic categorization of flows in colored buckets as per their health, dashboards for top talkers or slowest nodes and so on.
A nice overview of the top 10 use cases for DCNM SAN Insights can be found in this video:
Cisco DCNM 11.5 release notes are posted here, in case you want to read them all by yourself:
https://www.cisco.com/c/en/us/td/docs/dcn/dcnm/1151/release-notes/cisco-dcnm-release-notes-1151.html
You can learn more about DCNM SAN Insights feature directly from official documentation that can be found here:


