
When a business-critical application slows down, the problem is rarely a lack of data. The problem is that every team sees its own telemetry, and no one sees the full story.
The application team sees latency. The network team sees packet loss or a microburst. The security team sees an anomalous traffic pattern. Each team has evidence within its own domain, but the signals live in separate tools, with separate timelines and separate owners. Before anyone can fix the issue, teams first have to connect those signals, reconstruct what actually happened, and restore service.
We first announced Native Splunk in Cisco Nexus One at Cisco Live Amsterdam in February 2026. At Splunk .conf26, we are announcing the expansion of Native Splunk in Nexus One from a single-node to a multi-node architecture – bringing Splunk analytics and authoritative network context together in one unified operational experience.
By bringing Splunk search, dashboards, alerting, and analytics directly into Nexus Dashboard, customers can analyze high-value network telemetry close to where it is generated, preserve its authoritative network context, and connect it with application, infrastructure, and security data through Cisco Data Fabric.
Instead of moving every dataset into one place before it becomes useful, teams can investigate from shared, governed evidence. They can understand what happened, where it happened, when it happened, and what changed, then move from signal to root cause to action faster.
That is the foundation not only for more resilient operations today, but also for trustworthy AI-assisted operations tomorrow.
Bring analytics to the data
For years, the default approach has been to move large volumes of operational data into a centralized platform before analyzing it. As those volumes grow, so does the data gravity: more cost, more latency, more complexity, and more copies of sensitive data to govern.
Cisco Data Fabric provides a different model. It enables organizations to discover, analyze, and correlate distributed data without requiring every dataset to be moved first.
Nexus Dashboard provides trusted, time-aligned network context about what happened, where it happened, when it happened, and how the fabric was configured. Native Splunk makes that context searchable and actionable within Nexus Dashboard, while Cisco Data Fabric connects it with application, infrastructure, and security data across the enterprise.
This is the foundation of Native Splunk in Cisco Nexus One.
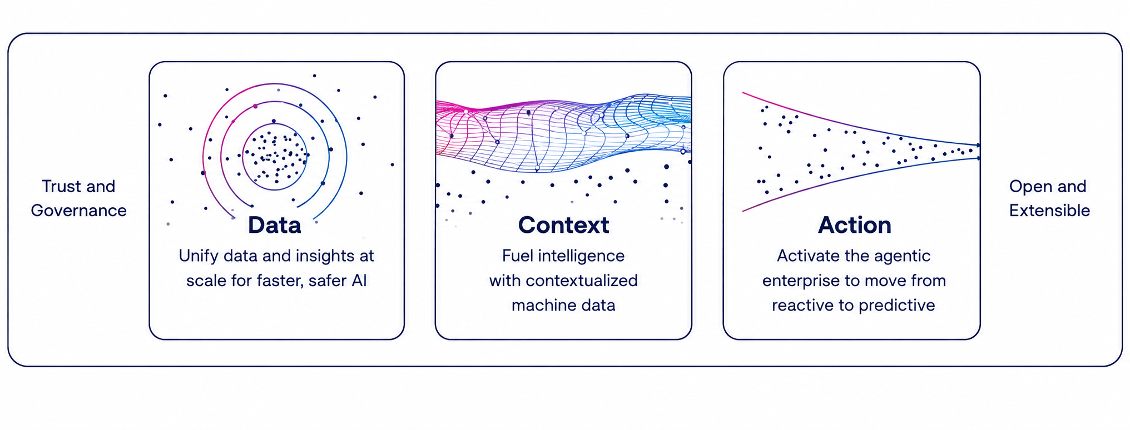
Native Splunk in Nexus Dashboard
Native Splunk is integrated into the on-premises Nexus Dashboard environment, bringing Splunk search, dashboards, alerting, and analytics directly to the network telemetry and context Nexus Dashboard already collects.
That context includes anomalies, advisories, audit events, topology, interface health, and evidence of changes. When the analytics and network context are in the same operational environment, teams do not have to export the data first, recreate its context elsewhere, or reconcile timelines across disconnected systems. Cisco Data Fabric can then connect those insights with application, infrastructure, and security data across the enterprise.
This approach helps customers:
- Preserve data sovereignty and governance by keeping high-value telemetry closer to its source
- Reduce unnecessary data movement and duplication
- Accelerate troubleshooting and root-cause analysis with authoritative network context intact
- Maintain high-fidelity information about topology, configuration, interface health, and changes
- Expand from local investigation to cross-domain operational intelligence
Customers can begin with current-state visibility for rapid triage, then expand to persistent data, continuous monitoring, alerting, and enterprise-wide correlation as their operational requirements grow.
Transforming troubleshooting and AIOps
With Native Splunk and Cisco Data Fabric, NetOps, SecOps, ITOps, and application teams can investigate from shared evidence rather than assembling the story across disconnected tools, tickets, and incomplete timelines.
They can trace an initial signal across topology, traffic, policies, configuration changes, application telemetry, and security events. From there, teams can assess the business impact, identify the root cause, and determine the next approved action. The outcome is fewer handoffs, less time spent reconciling data, and a faster path from symptom to resolution.
For NetOps troubleshooting, Nexus One’s native Splunk capabilities deliver the metadata-driven analytics needed to resolve most issues without exporting data to external analytics engines.
This is the shift from observing infrastructure to operating it intelligently. It also creates the conditions for trustworthy AI-assisted operations: relevant and traceable data, clear business context, and governed recommendations and actions.
Data federation: sovereignty by design
Federated Search allows teams to discover and query data across distributed Cisco Nexus One data center network environments without forcing every dataset into a single location. Machine Data Lake capabilities help retain high-fidelity telemetry data and make it available for future investigation and Agentic AI workflows.
Together, these capabilities provide a practical balance: data remains subject to the organization’s governance controls, while authorized teams and workflows can access the context required for cross-domain analysis.
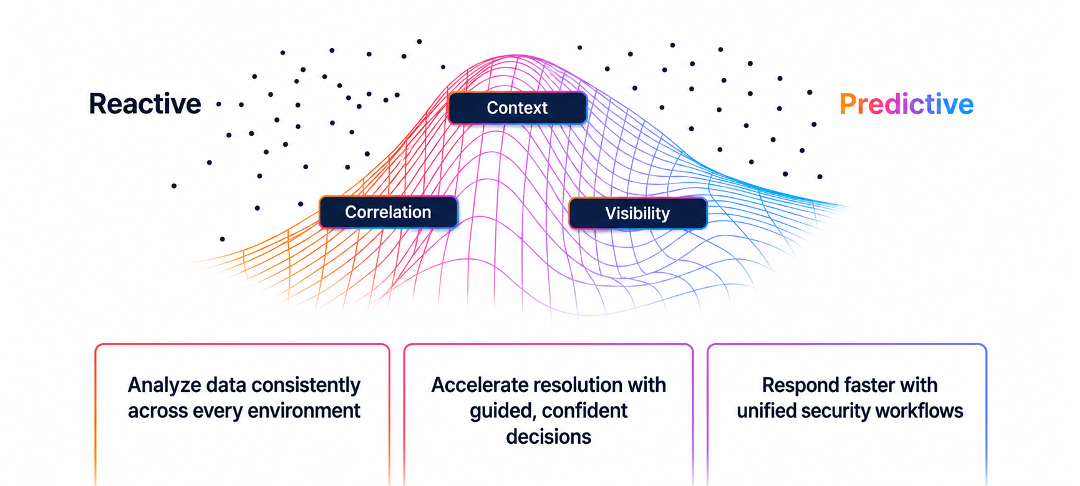
Resilience requires a resilient platform
Operational intelligence only delivers value if it remains available when infrastructure is under stress, undergoing maintenance, or experiencing a failure.
The multi-node Cisco Nexus One offering with Native Splunk provides a resilient foundation for critical data center operations. A multi-node Nexus Dashboard architecture is designed to support high availability, maintenance flexibility, operational continuity, and future growth.
The value is not simply node redundancy. It is the continuity of monitoring, investigation, and coordinated response at the moment the operating environment is changing fastest.
Rather than exporting every byte of raw telemetry to a remote platform, Cisco data center and Splunk customers can analyze high-value signals closer to where they are generated. This helps preserve data sovereignty, reduce unnecessary duplication, and limit the cost of moving and storing operational data.
Cisco Nexus Dashboard supports one-node and multi-node physical cluster configurations with Native Splunk, with sizing based on required scale and performance. The multi-node option provides a compact operating foundation for critical workloads that can scale as observability requirements grow.
Closing the resilience gap
With Native Splunk in Cisco Nexus One, network telemetry becomes more than a record of what happened. It becomes shared operational context that helps teams, and increasingly AI, understand, decide, and act faster.
By bringing Splunk analytics directly to trusted network data in Nexus Dashboard, customers can break down operational silos without surrendering control of their data. That is how organizations close the resilience gap.