Cisco Live! San Francisco was the biggest Cisco Live! yet—25,000 attendees. Read Chris’s blog for more on the network at Cisco Live! You also heard about the Mobility Services APIs enabling location-based services and location-enabled application development in Neha’s blog yesterday. The event also marked a milestone for our CMX team: successful location tracking of all 30,000 devices in the conference center with a single pair of MSEs (Mobility Services Engine) running on 7.6MR2 code to generate analytics and reports based on device location!
Let’s take a closer look at location analytics generated at Cisco Live! If you haven’t seen CMX Analytics before, let me tell you: it’s powerful. There are three pieces of CMX Analytics: Dashboard, Analytics and Reports, all generated by the location data from the MSE. Here are a few key views from the show floor:
1. Dashboard: The CMX Dashboard features a number of customizable widgets that visualize location data such as dwell time and device count by zone or by time.
Hourly Visitors for South Halls on Tuesday May 20
Tuesday marked a steady flow through the day with the World of Solutions and breakout sessions all day. You see that spike at 5pm? That’s when the beverages and refreshments came out—and then you see people tapering off round 7pm to head out for dinner.

Hourly Visitors for South Halls on Thursday May 22
Compare that with Thursday, where you can see the numbers peak in the morning when there were still sessions and the World of Solutions was still open, and see where it clearly tapers off early when all the attendees started their journeys home.

2. Reports: Location data put through the CMX Analytics Engine can then be processed into reports that show historical trends, such as dwell time by day or by hour.
Daily Visitors and Dwell Time Report
North Halls for the Entire Week
Here we have a report showing the Daily Visitors and Dwell Time for the North halls over the week—sudden spike on Monday marking the beginning of Cisco Live! and slowing down over the week.

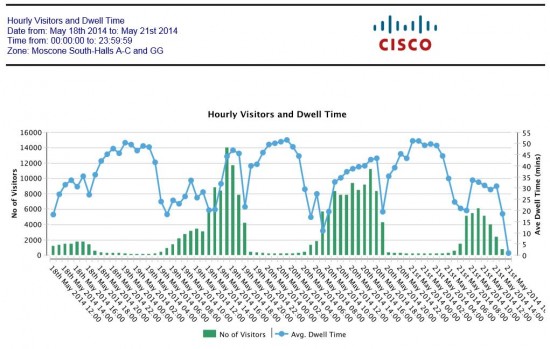
Hourly Visitors and Dwell Time Report
South Halls for the Entire Week
You’ve seen the daily visitors, what if you wanted to slice the data hourly? Here is a report that shows just that. Clearly you can see that there is the traffic during hours of operations, with heaviest traffic in the South halls in the afternoons and early evenings. Interestingly, the highest point on both Monday and Tuesday for the World of Solutions was when the evening receptions started handing out food and drink.
Another interesting conclusion from this data is how we can see the number of visitors go down to single digit during the night and the dwell time go up indicating the security guards at their post.
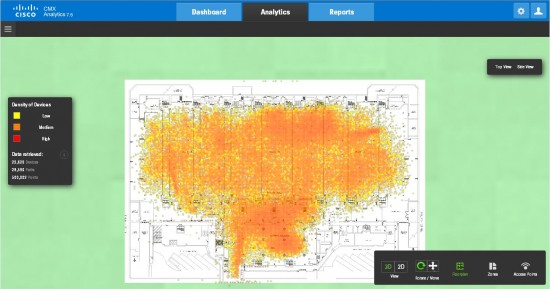
3. Analytics: Analytics is a different type of visualization on a dynamic 2D or 3D map of the venue that can show the location data in one of three flavors: device density, dwell time and crowding.
Dwell Time Visualization
North Upper Lobby Registration on Monday May 19
Looking at dwell times, we can get a view of the registration lobby showing that the average time spent in the registration area was approximately 7 mins. Most people are able to get in and out of registration within a few minutes.

Device Density Heat Map
South Hall on Thursday May 22
This device density heat map of the South Hall on the show floor shows us that the events team did a good job of distributing the points of interest so that people were well spread throughout the venue. If we were to see more red pockets, it could indicate there might be a bottleneck or a particularly interesting demo booth (or extra cool freebies).
Think CMX Analytics looks pretty cool? Here’s a quick tutorial walkthrough on how it works with our TME lead Darryl Sladden.
Learn more about CMX at www.cisco.com/go/cmx.


CONNECT WITH US