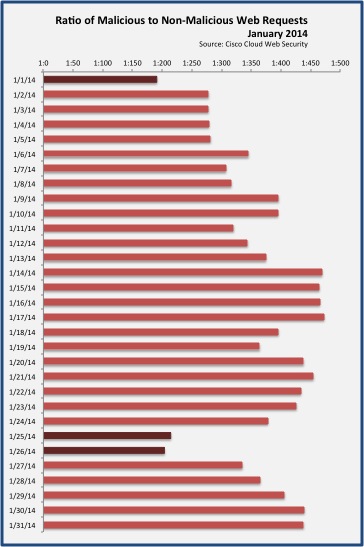
January 2014 started with a bang, with one in every 191 web requests resulting in a web malware encounter. The Cisco Computer Security Incident Response Team (CSIRT) observed this same trend, witnessing a 200% increase in web malware encounters experienced by Cisco employees for the month. Overall, January 1, 25, and 26 were the highest risk days for encountering web delivered malware. In the chart below, the lower the number, the higher the risk of encounters. Still, with a median encounter rate of 1:375 requests, every day of January 2014 represented significant risk for web browsing.
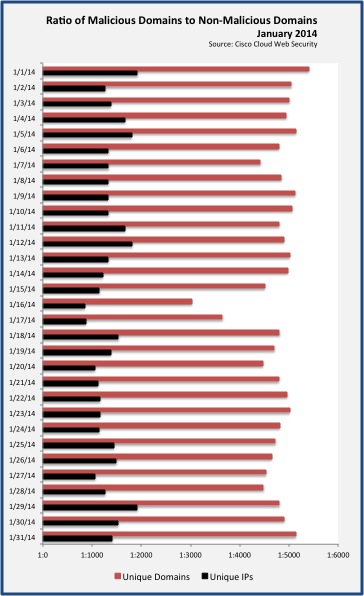
Although January 1, 25, and 26 were heavy encounter days, there were fewer unique domains and IP addresses compared to non-malicious domains and IP addresses on those days. As with the previous chart, the lower the number, the higher the risk. January 16 had the lowest ratio of unique malicious IP addresses and unique malicious domains compared to non-malicious IP addresses and domains. On that date, one of every 847 unique IP addresses was malicious and one out of every 3022 unique domains.
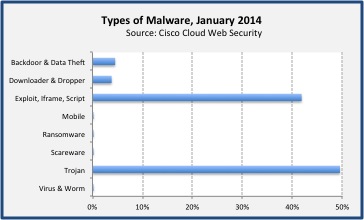
Nearly half of all encounters were exploits, iframes, and malicious scripts. These are precursor encounters that, if left unblocked, lead to malicious downloads.
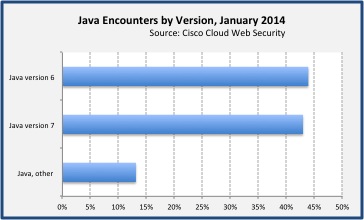
Java remains the most frequently targeted platform for vulnerability exploit. At 44% and 43% of all Java blocks respectively, Java v6 and Java v7 were equal targets of exploit in January 2014. In December 2013, Java v6 comprised 48% of all Java blocks compared to 40% for Java v7.
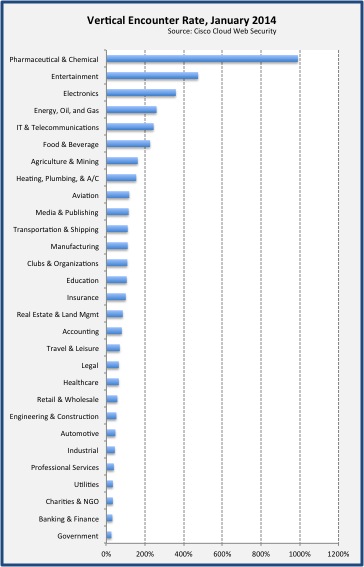
Companies in the Pharmaceutical & Chemical vertical experienced the highest rate of encounters with web-delivered malware. As seen in the Cisco 2014 Annual Security Report, this particular vertical has historically always been one of the highest at-risk of encounters. To assess vertical risk, we first calculate the median encounter rate for all enterprises, and then calculate the median encounter rate for all enterprises in a particular vertical, then compare the two. A rate higher than 100% is considered at increased risk.
Pharmaceutical & Chemical continuing to experience the highest risk is no surprise. Ongoing Cisco research since 2008 has continually found that companies with the most valued intellectual property tend to have the higher risk of malware encounters. Of particular interest is the increase in risk to the Entertainment industry. This same temporary risk increase has been observed in previous years, right around the time of the Academy Awards.
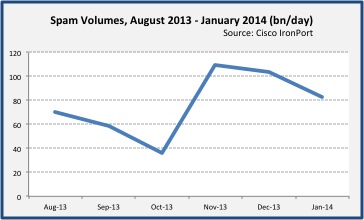
Spam volume decreased by 20% in January 2014 compared to December 2013, though still continuing with the higher volume observed in November 2013. Contributing to this higher volume were malicious email masquerading as correspondence from the Royal Bank of Scotland and Land Registry. The email carried a malicious zip attachment containing a generic downloader trojan. Sender addresses, and message bodies varied, with subjects that included Important Docs, Account Report, and QuickBooks Invoice. Example attachment names included Docs_14012014.zip, Docs.zip, and Notification_1401.zip.
No exploit was used to deliver the malware, instead the email relied upon a well-crafted socially engineered message to entice victims into opening the attached trojan. It does appear the ruse has been effective as the campaign has been ongoing for several months. Cisco first released an advisory warning of this email in August 2013.
The majority of the world’s spam originated in the United States (11.35%), double the rate of second highest Russian Federation and Spain (both at 5.10%). China and Italy followed at 3.53% and 3.35%, respectively.