
We spend a lot of time talking about Wi-Fi coverage, SD-WAN tunneling, switching redundancy, etc., but the true measure of quality isn’t a perfectly deployed network… it’s an excellent user experience. As with all things, it’s often more difficult to diagnose the problem than to fix it.
With more and more applications moving to the cloud, issues our users experience may not be caused by the usual suspects – or as I hear it in my house, “the wireless is broken.” Increasingly, we access our apps on mobile devices – laptops, tablets and smartphones – and these apps are accessed across a WAN or the Internet. Along the way, there are many variables that could lead to a poor experience, and hence perception of the network.
Last month I wrote about a new Meraki tool developed to assist in pinpointing wireless problems. Meraki Wireless Health will help all our customers save time previously spent combing through event logs and reading packet captures with simple, informative details about connectivity and wireless latency. Combined with the troubleshooting tools Meraki customers already enjoy – like Air Marshal security, Auto RF and anomaly detection – a well-designed wireless deployment can now deliver on its promise of better-than-wired connectivity.
Today we’re announcing Meraki’s next step in network intelligence. More and more of the data flowing to and from our apps goes over the Internet or a private wide area network (WAN). Greater insight into the WAN and the servers at the far end is sorely needed to understand what’s really going on – what our users are really experiencing. That’s why we’re so excited about the launch of Meraki’s first WAN and application analytics product, Meraki Insight.
Meraki Insight represents the synthesis of three important trends:
- AI: The artificial intelligence required to build these types of insights has finally become available.
- Data: Cloud systems like the Meraki dashboard make it possible to store the vast amounts of data required to build the models and analyze the trends that make these insights possible.
- SD-WAN: More and more enterprise applications and enterprise sites depend on the Internet, on directly connected sites, on LTE backups or on the public cloud. The time has come for us to be able to see what’s really happening with these applications.
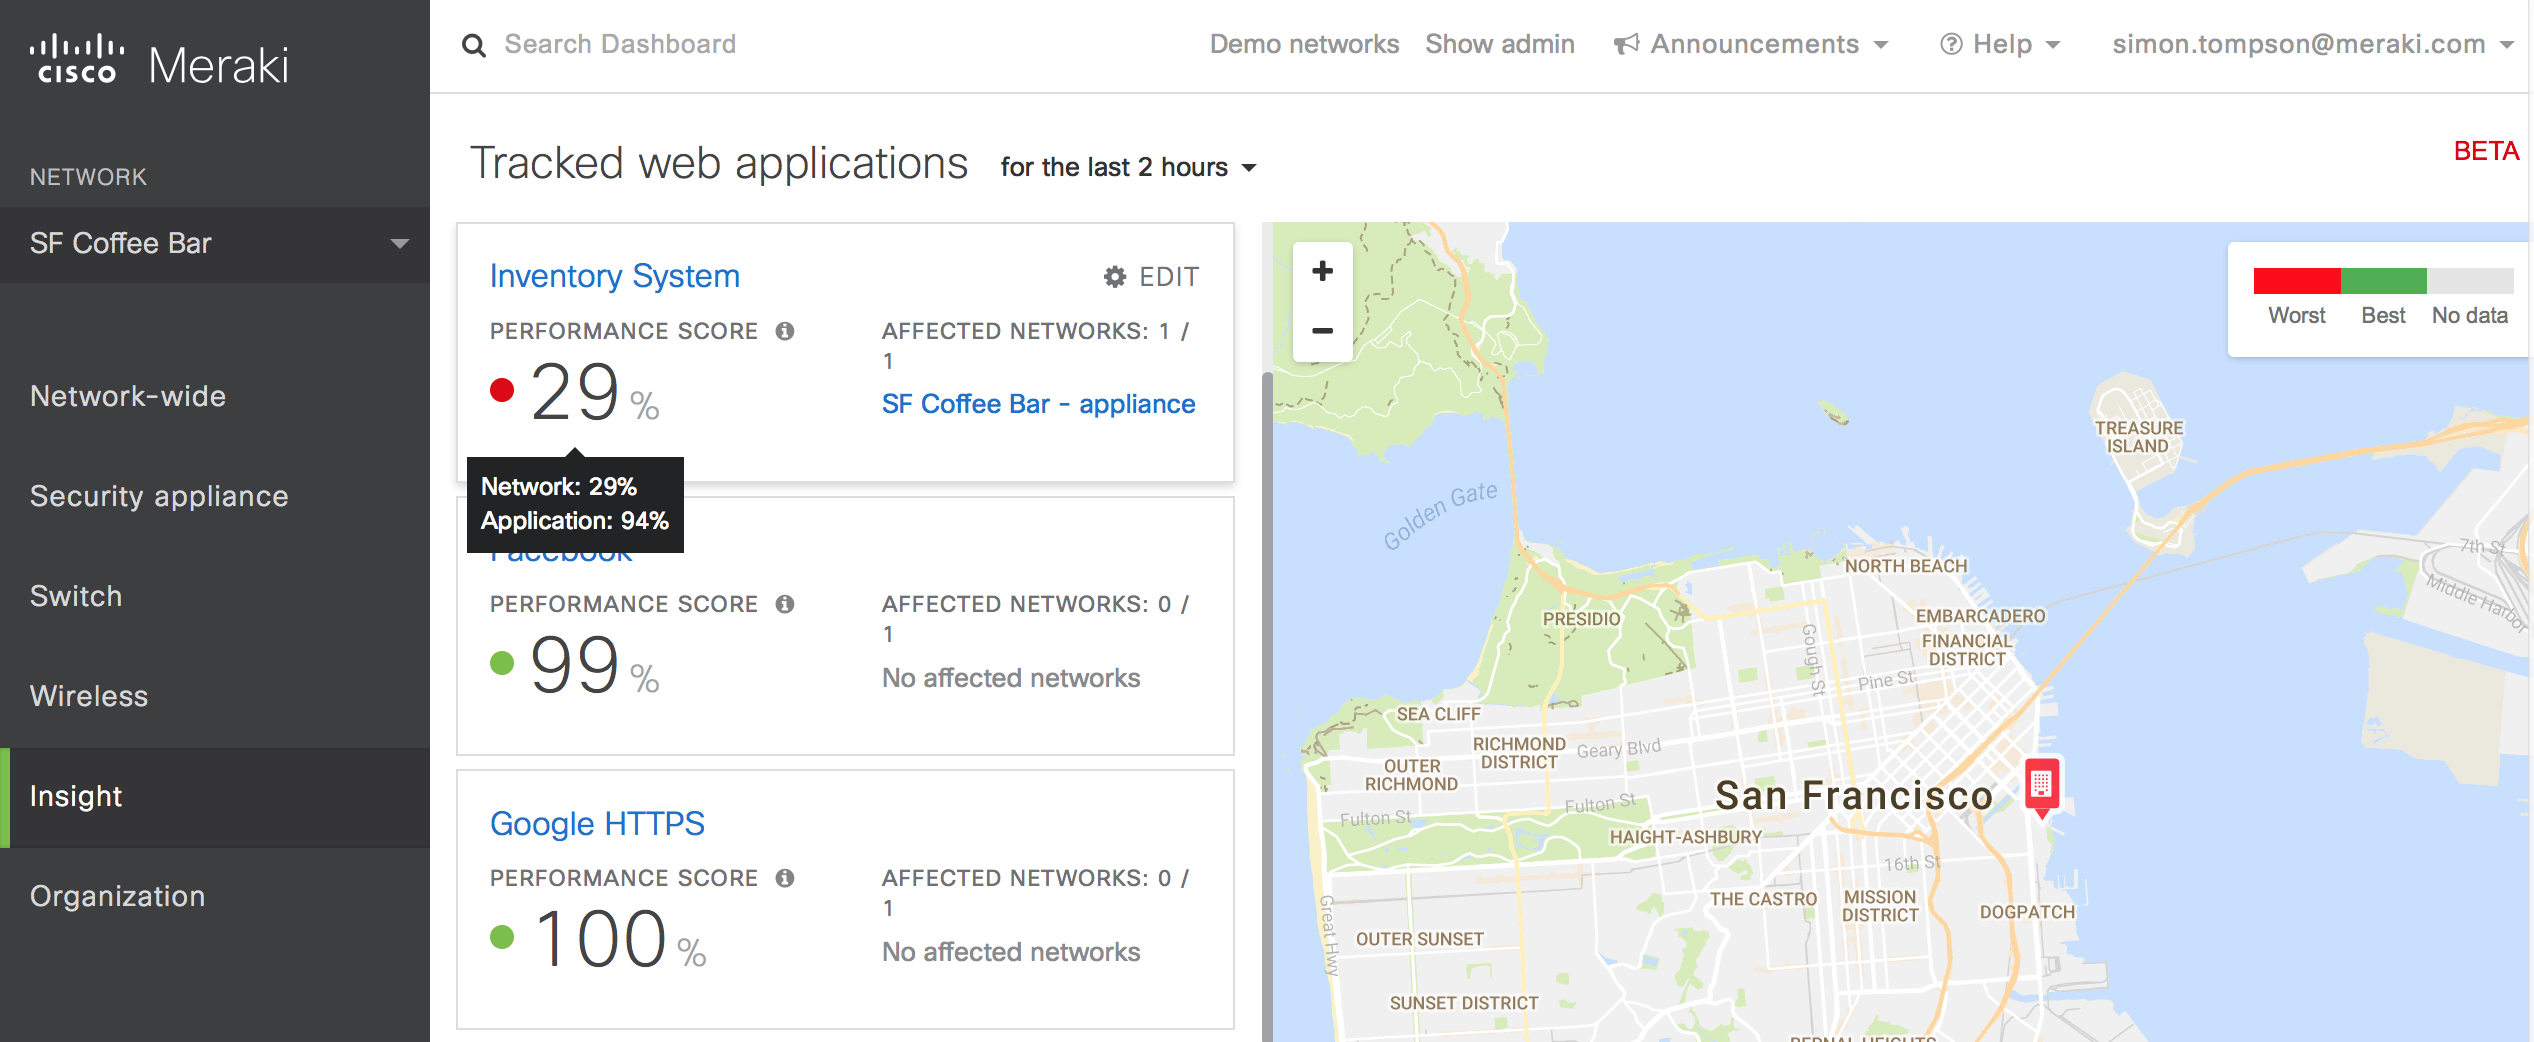
Meraki Insight uses a collector – initially the Meraki MX UTM and SD-WAN appliance – to record data pertaining to LAN, WAN and server performance and then presented in the Meraki dashboard. Administrators can set performance thresholds that feed into a performance score for their mission critical web applications. Monitoring trends in variables like server response time, goodput, WAN loss and latency enables simple correlation between data points at a given point in time to help administrators rapidly identify the true cause of poor user experience. Clearly highlighted anomalies save considerable time compared to searching logs or using third party tools to troubleshoot.
Meraki Insight is already helping real businesses reduce downtime and save money. One large European retailer was able to use the tool in the run up to the holidays to identify the root cause of slowness with their Point of Sale system. It goes without saying that for a retailer, a tool like this quickly pays its way.
At Cisco Meraki, we are constantly striving for simplicity. Meraki products reduce the time it takes to deploy, manage and troubleshoot IT infrastructure, making every step simpler. With Insight we’ve taken another significant step on this journey and towards end-to-end intelligence for the network. We can’t wait to get the tool into your hands.


Nice write-up Todd. "As I hear it in my house, “the wireless is broken.”" So true, and so funny. EVERY SINGLE CUSTOMER THAT SAW MERAKI INSIGHT AT CISCO LIVE was highly impressed. We are excited about this.
Love the camera which can store like 100days of video records
IT'S TRUE THAT NETWORK PROBLEM INCREASING INSTEAD OF REDUCING EVEN AFTER INVENTIONS OF NEW TECHNOLOGIES IN THE WORLD. IN OUR COUNTRY TOO WE ARE FACING SLOW INTERNET NETWORK – MOBILE & LAND LINE BOTH. GOVT. HAVE PLANNED & IMPOSED ONLINE SYSTEMS AND PEOPLE KILL THEIR TIME SITTING ON THE COMPUTER WAITING FOR COMPLETION OF THEIR TASK. BOTH NETWORK AS WELL AS SERVERS, SOFTWARE ETC. SHOULD BE IMPROVED TO SAVE THE SOCIETY'S UNREST.