
If you have gone through my DevOps series, by now you have used kubernetes to deploy a number of pods, services, volumes and namespaces, spread across a number of servers in your cluster. Of course you can use the kubernetes CLI to understand the mapping among these multiple elements, but sometimes it is also convenient to have a configurable GUI that shows this information.
Cockpit is a tool that helps managing Linux servers from your web browser. It allows you to start containers, administer storage, configure networks, and inspect logs. But the key capability I would like to focus on today is its ability to interface with kubernetes API and graphically display how its constructs relate to each other and the underlying infrastructure.
For this example I will be using a common 2-node GKE cluster with our usual myhero application already deployed (please check my previous DevOps blog post for further information on how to replicate it in your own cluster).
Let’s start by going into the cockpit directory in your cloned repo.
$ cd devops_tutorial/devops/cockpit
Create a new namespace for cockpit.
$ kubectl create namespace cockpit
Now apply the cockpit manifest to create the resources required by the dashboard.
$ kubectl -n cockpit create -f kubernetes-cockpit.json
Please wait until all pods are in Running status and READY 1/1. You will also need to wait until the new cockpit service gets and EXTERNAL-IP.
$ kubectl -n cockpit get po,svc
NAME READY STATUS RESTARTS AGE
pod/kubernetes-cockpit-gl8m4 1/1 Running 0 44m

NAME TYPE CLUSTER-IP EXTERNAL-IP PORT(S) AGE
service/kubernetes-cockpit LoadBalancer 10.31.245.114 35.240.118.14 443:30837/TCP 44m
Once assigned please use your browser to navigate to that external IP address using HTTPS. As an example, for the previous output you would need to go to https://35.240.118.14 (please accept any required security exceptions in your browser).

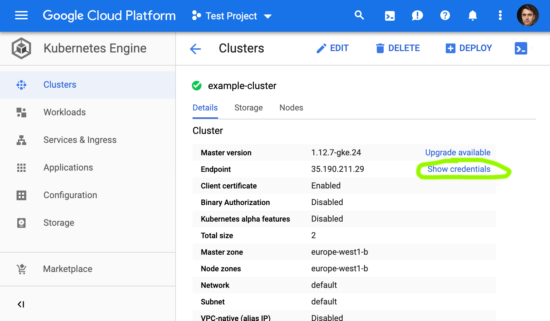
As you can see you will need credentials (user name and password to access your dashboard), and by default those are the ones from your server. Please log into your GKE console and obtain them from Kubernetes Engine – Clusters – <your_cluster_name>, and click on Show credentials.
Please log into cockpit using those values, and feel free to browse the capabilities offered by the dashboard. If you go to Topology you will see a dynamic diagram similar to this:
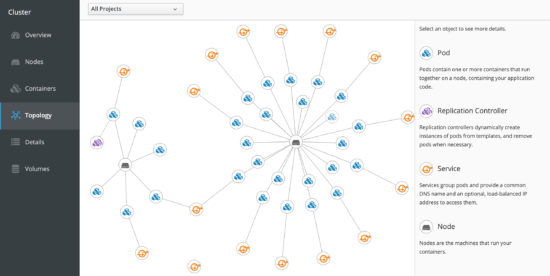
It shows the nodes in your kubernetes cluster (2 in this example), what pods reside in each one of them and the services enabling access to these pods. This way it is easy to understand the real architecture of your deployed application. You can move the different elements around so that they are shown the way you prefer.
By default, it shows information for all projects in the cluster, so let’s filter it to show only info about our myhero application.
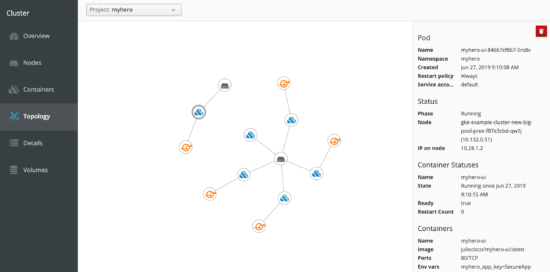
Now you see only the nodes supporting services and pods related to this specific application. I have highlighted the myhero-ui pod on the left, so we can now scale the number of replicas and see how the dashboard automatically reflects this change.
$ kubectl -n myhero scale deployment myhero-ui --replicas=2

As you can see, the dashboard automatically shows in real time how the service is load-balancing into 2 different pods.
Cool way to display your microservices-based application, huh?
Any questions or comments please let me know in the comments section below, Twitter or LinkedIn. See you in my next post, stay tuned!
Related resources on DevNet:
We’d love to hear what you think. Ask a question or leave a comment below.
And stay connected with Cisco DevNet on social!
Twitter @CiscoDevNet | Facebook | LinkedIn
Visit the new Developer Video Channel


