
Cisco DevNet is the platform on which we host Cisco’s constantly-updated API documentation, 1,100+ Code Exchange entries, 54 DevNet Sandboxes, and 740 Learning Labs. Here at DevNet, we believe in practicing what we teach. So our platform is built on an evolving, modern hybrid infrastructure. We’ve learned a lot in the building, and refining, of this ambitious collection of services.
DevNet is built on over 100 on-prem and cloud-based microservices, updated in real-time by a team of engineers, designers, and content creators. Of the tools we use to run this site, there are a few new ones that are proving extremely useful. Here are the top 3 new tools we use, and some interesting things we’ve learned about them.
It was not always so spiffy
As I said, DevNet is based on an evolving architecture. But when we launched the resource, in 2014, it was all hosted in virtual machines on a server in a data center. That system ran out of headroom quickly during our growth years. It wasn’t scaling to keep up with user growth, and it was increasingly hard for us to add features to the service.
In 2017, we moved DevNet over to a cloud-hosted microservice architecture using Kubernetes. We now use Prometheus, Elastic Search, Kibana, Grafana, and other cloud-native platforms. With the flexibility inherent in this setup, and using a DevOps development model, we have found it much easier to add new services and applications to DevNet, as well as to add capacity to keep up with increasing user demand.
Recently, we’ve been driving to enhance application performance and user experience on DevNet. That means working with performance monitoring, full-stack observability, and other solutions across the stack. So I want to focus on tools that make this easier, and what we’ve learned from them.
ThousandEyes
Developer.cisco.com serves a global community, and the performance and experience can vary a lot based on where the users are. Anyone who is responsible for a large-scale global deployment knows that localized performance issues can occur due to service outages, localized connectivity issues, or countless other issues. We use ThousandEyes Cloud Agents, which give us visibility into the underlying network paths our applications use, from our users’ endpoints to our hosted applications in the cloud. Cloud Agents allow us to understand the user experience in specific global regions.
It’s important to us that ThousandEyes’ “synthetic” testing is not at all theoretical. It’s based on real-time internet monitoring and is extremely valuable to us.
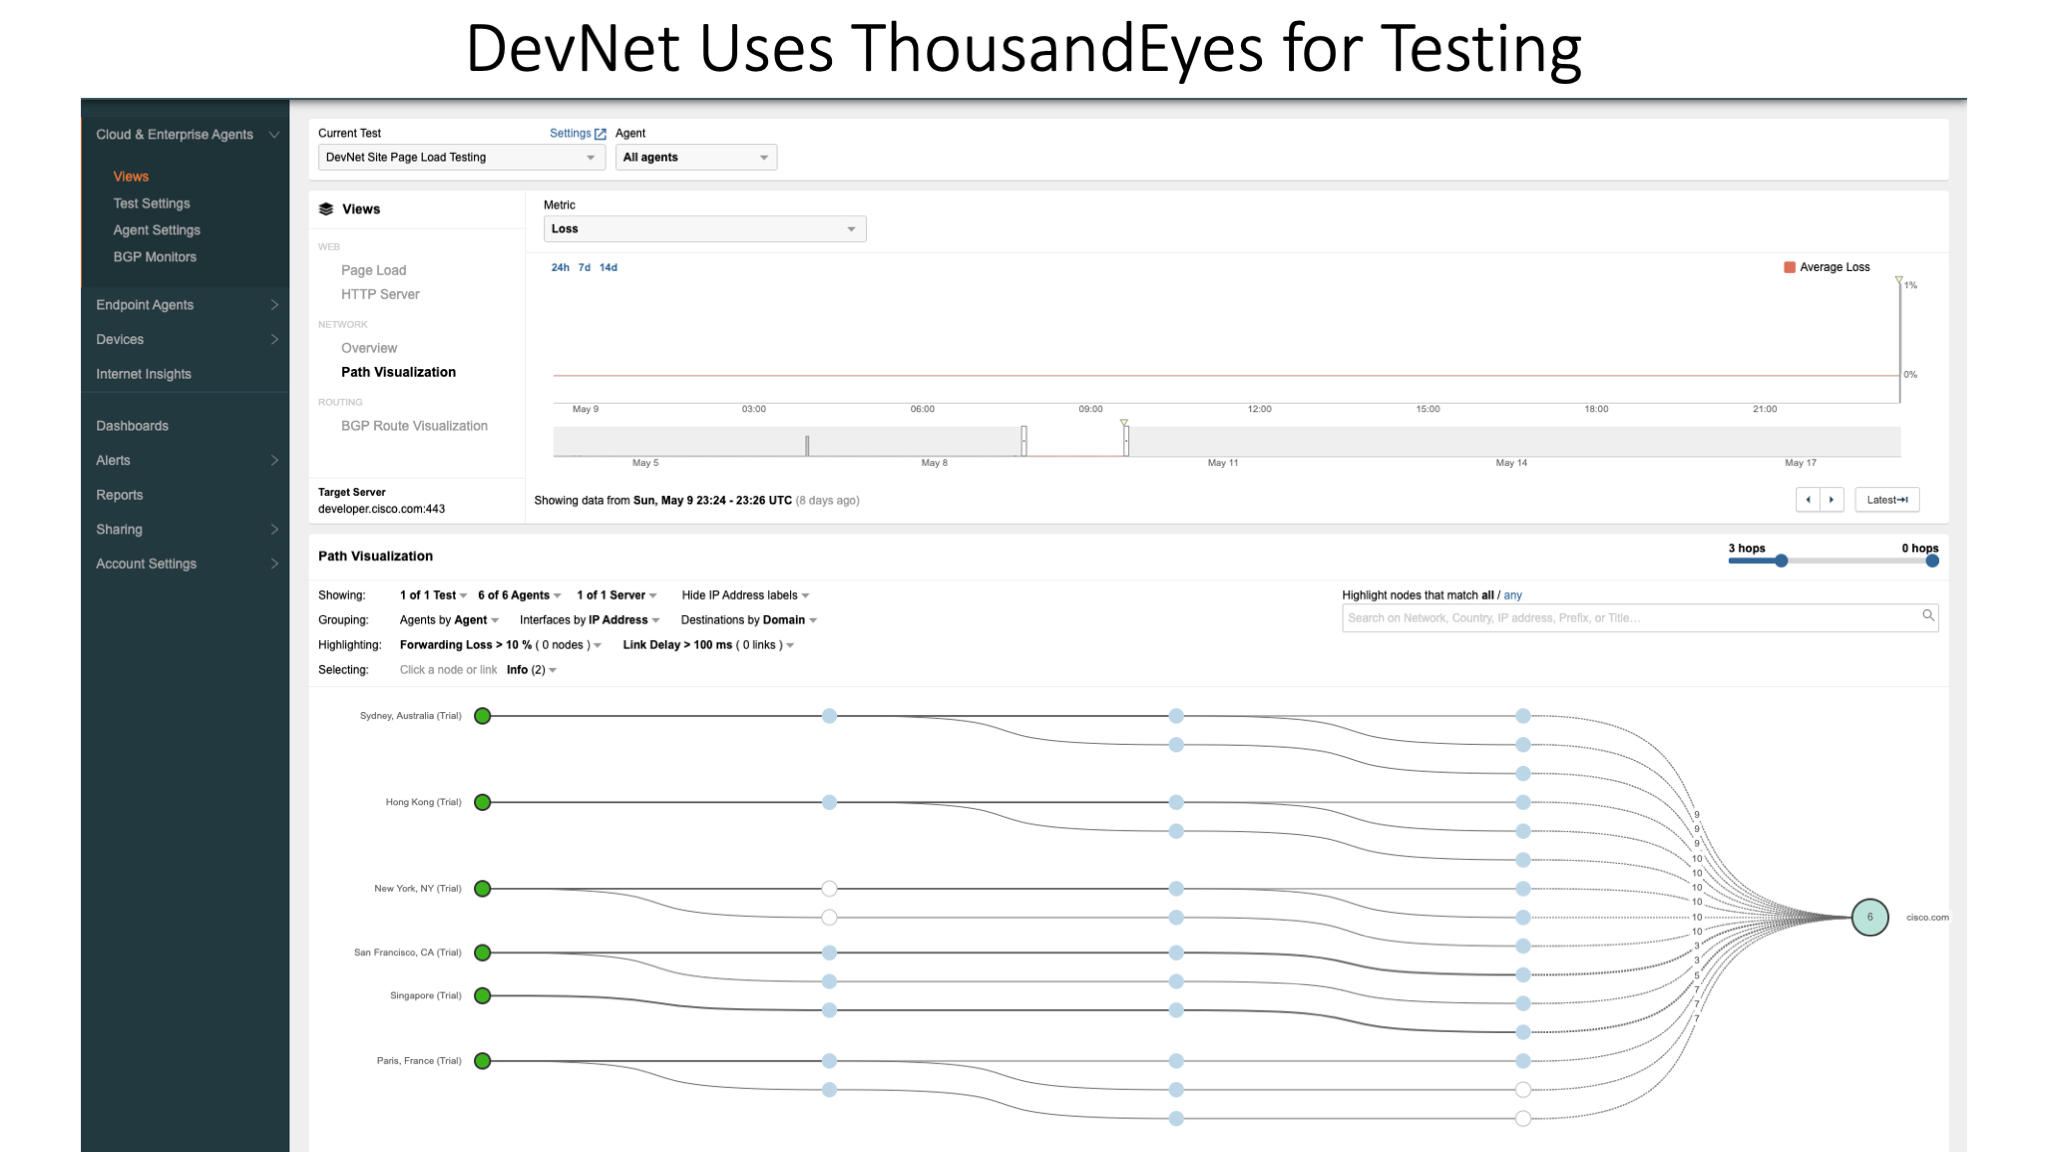
ThousandEyes Path Visualization View for DevNet. This shows the
network paths discovered when ThousandEyes agents visit the
DevNet application page from different locations around the world.
We also use ThousandEyes synthetic transaction tests to automate UI testing, a process that would otherwise be repetitive and manual. ThousandEyes has a Recorder and IDE we can use to record users’ browser interactions, which then creates Transaction tests that integrate into a CI/CD pipeline. As we push changes into our repo, ThousandEyes can execute tests continuously. And this continuous UI testing happens in the global regions users connect from.
ThousandEyes solves very practical problems for us and we continue to see new ways to apply it. For example, ThousandEyes alerts can be pushed into the AppDynamics interface. This consolidates network and application performance issues into one pane of glass, allowing NetOps and AppOps to break silos in quickly identifying the root cause of issues.
AppDynamics (“AppD”)
To optimize user experience, we need to know where our applications can be performance-optimized. Previously, we were using Prometheus with a custom Grafana dashboard to monitor our Kubernetes cluster – including each microservice’s usage of CPU, Memory, and other resources. But this combination did not provide the performance data that we really needed to get insight into our applications to improve them.
Today, with Cisco AppDynamics, we get extremely granular and valuable data, like the response time from individual API calls, or the time for full business transactions that employ microservices and databases – for example, delivering educational content that calls our Learning Lab services, our video system, our quiz engine, our progress tracking microservice and our MySQL server. AppD gives us monitoring from the end user experience of our applications down into the infrastructure in the data center.
This level of intelligence is incredibly valuable. It gives us the opportunity to optimize the responsiveness of user experience by focusing our efforts in precisely the right places.
AppD offers different ways to meter and monitor various parts of the application stack. For example, we use its Javascript agent to monitor the browser application UI. We also use AppD’s SDK for Go for most of our microservices, which are written in Golang. We use a few different database services, like Cassandra and MongoDB; AppD has agents for those processes.
With this suite of monitoring functions, we can monitor end-to-end application performance, which is incredibly valuable to us. It helps us pinpoint performance issues quickly, and makes it easier to create new high-performing services.
See the DevNet AppDynamics Developer Center
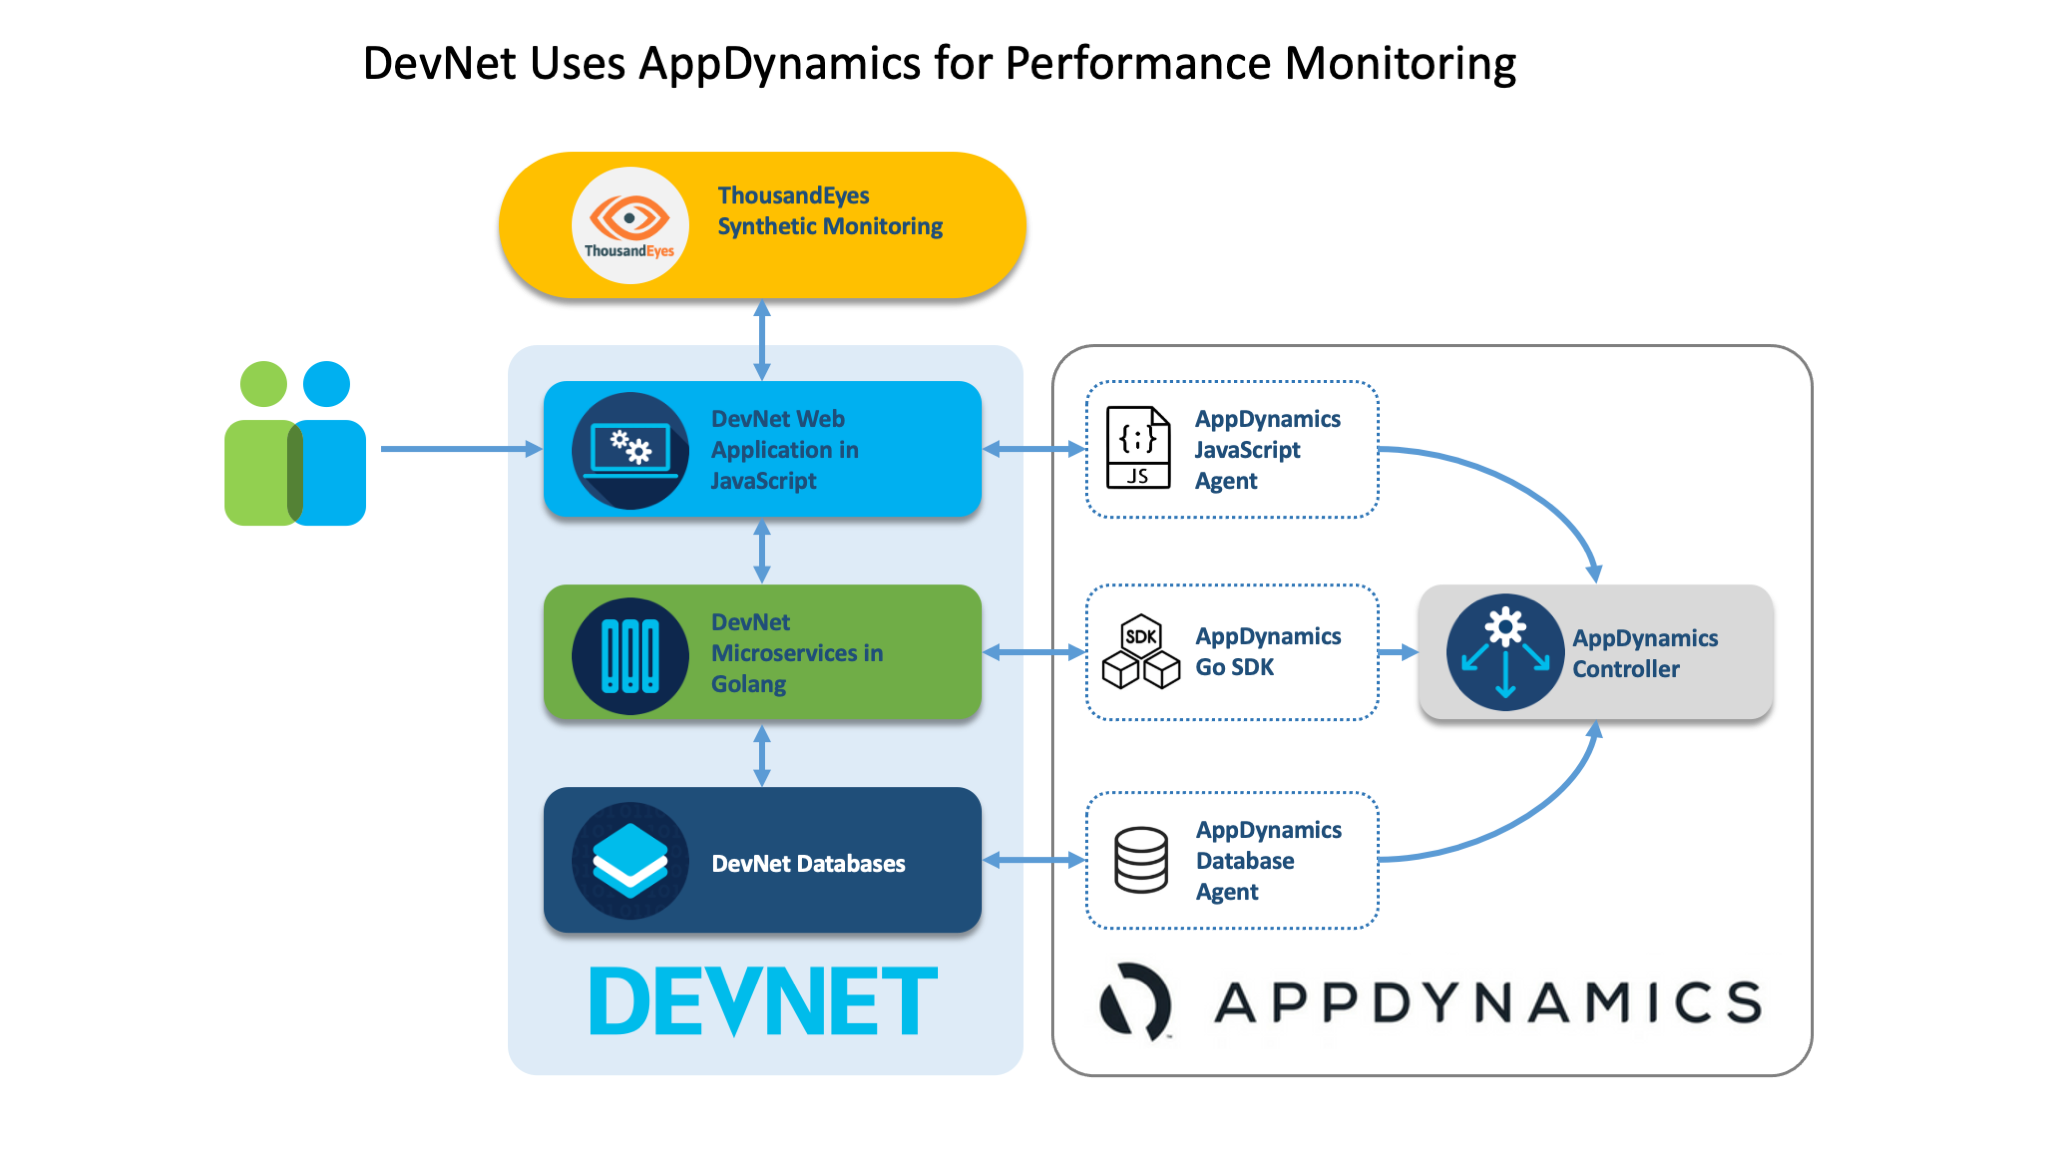 DevNet Application Performance Monitoring Using AppD. This diagram
shows how DevNet leverages AppD for full performance monitoring from
the frontend, to the backend and database.
Istio Service Mesh
Last year, we started tested Istio in our non-production environment. We have been using it to manage the microservices our platform is built on. We found its benefits compelling: it helps us manage, balance, and troubleshoot our increasingly complex web of software.
However, it also takes time for people to learn to use this tool. And it’s a high-stakes game, as misconfigurations in a service mesh can have profound impacts on networks and applications.
But we have found that it is worth the time investment in learning to use the tool. Istio has become one of our key diagnostic and management tools. We use it to analyze the impact on inter-service traffic from what can be subtle changes in microservice configurations. It allows us to apply automation to shift workloads when needed – securely and without having to rebuild the connections between services.
Istio also allows us to configure policy-based access control across microservices, again under programmatic control.
There is one pilot in particular that has a lot of promise: We are using Istio in A/B testing, to dynamically divide traffic in various proportions between stable and new apps and configurations. It makes it configuring and running tests much easier and efficient, and thus is helping us improve the pace of our application development. It frees up engineers so they can get to work on other projects more quickly.
Summary
DevNet is a force multiplier at Cisco – it allows the company to gather developer resources, documentation, and community around many Cisco products. It has been an exciting journey to build, refine, and continuously evolve the DevNet platform. We will continue to evaluate new tools on our tech stack, to make DevNet more valuable and improve user experience.
I hope these insights on three important tools we’ve recently adopted are helpful. What do you think of these tools, and what else have you found valuable? Comment below!
We’d love to hear what you think. Ask a question or leave a comment below.
And stay connected with Cisco DevNet on social!
Twitter @CiscoDevNet | Facebook | LinkedIn
Visit the new Developer Video Channel


